The Hospital Bed Market Report 2022-2032: This report will prove invaluable to leading firms striving for new revenue pockets if they wish to better understand the industry and its underlying dynamics. It will be useful for companies that would like to expand into different industries or to expand their existing operations in a new region.
The Number Of Private Hospitals Has Been Steadily Increasing, Resulting In Increasing Demand For Beds
The quantity of private clinics has been consistently expanding, especially in poor and arising nations, which is probably going to help market advancement all through the conjecture period. The development of the emergency clinic furniture industry is supported by an increment in private emergency clinic medical care spending. Administrative experts in developing economies, for example, China have specific regulations and guidelines overseeing medical services foundation, which prompts the development of emergency clinic framework and the arrangement of better clinical benefits to patients. Because of increasing infection rates, individuals’ inclination for clinics invigorates interest for clinical goods, pushing the business forward. For instance, The Dubai Health Authority (DHA) has uncovered a four percent development in private wellbeing offices in Dubai, demonstrating a reliable increment. Drug stores, analytic and dental focuses, private clinics, and specific focuses are totally remembered for this number. Likewise, 12 new private medical clinics with north of 800 beds opened in Dubai by 2020. Notwithstanding current clinics under development, the quantity of private clinics in Dubai will increment to 38, surpassing the quantity of public emergency clinics nearby.
High Obese Population Fuels Innovations in Hospital Furniture
The tendency of contract manufacturing is becoming more popular in the hospital furniture industry. The notion of customised furniture is gaining traction in the marketplace, with a greater focus on product quality and refinement. Manufacturers are embracing well-thought-out designs centered on end users’ appearance, comfort, and hospitality. Manufacturers are gaining international fame thanks to high-performing hospital furniture. Traditional hospital furniture has the drawback of producing skin ulcers in overweight patients due to additional furniture strain on already weak skin. As a result, firms are putting more effort into improving the usefulness and aesthetics of obese-friendly healthcare furnishings. This is good news for hospitals who are investing in furniture that can support hundreds of pounds of patient weight.
For example, Obesity levels in America remain high, with 70 percent of persons classified as obese or overweight, with no signs of change in sight. More women are embracing the size acceptance movement and demanding trendy attire for “over size” people, as well as dating services, specialist beds, and medical equipment. As healthcare institutions aim to accommodate larger and larger patients, the market for high-capacity bariatric hospital beds, wheelchairs, and lift systems is predicted to grow to $1 billion by 2022.
What Are These Questions You Should Ask Before Buying A Market Research Report?
• How is the hospital bed market evolving?
• What is driving and restraining the hospital bed market?
• How will each hospital bed submarket segment grow over the forecast period and how much revenue will these submarkets account for in 2032?
• How will the market shares for each hospital bed submarket develop from 2022 to 2032?
• What will be the main driver for the overall market from 2022 to 2032?
• Will leading hospital bed markets broadly follow the macroeconomic dynamics, or will individual national markets outperform others?
• How will the market shares of the national markets change by 2032 and which geographical region will lead the market in 2032?
• Who are the leading players and what are their prospects over the forecast period?
• What are the hospital bed projects for these leading companies?
• How will the industry evolve during the period between 2020 and 2032? What are the implication of hospital bed projects taking place now and over the next 10 years?
• Is there a greater need for product commercialisation to further scale the hospital bed market?
• Where is the hospital bed market heading? And how can you ensure you are at the forefront of the market?
• What can be the best investment options for new product and service lines?
• What are the key prospects for moving companies into a new growth path? C-suite?
You need to discover how this will impact the hospital bed market today, and over the next 10 years:
• Our 500-page report provides 285 tables and 282 charts/graphs exclusively to you.
• The report highlights key lucrative areas in the industry so you can target them – NOW.
• Contains in-depth analyse of global, regional and national sales and growth
• Highlights for you the key successful trends, changes and revenue projections made by your competitors
This report tells you TODAY how the hospital bed market will develop in the next 10 years, and in-line with the variations in COVID-19 economic recession and bounce. This market is more critical now than at any point over the last 10 years.
Delivers exclusive COVID-19 variations economic data specific to your market.
To access the data contained in this document please email contactus@visiongain.com
Forecasts to 2032 and other analyses reveal the commercial prospects
• In addition to revenue forecasting to 2032, our new study provides you with recent results, growth rates, and market shares.
• You find original analyses, with business outlooks and developments.
• Discover qualitative analyses (including market dynamics, drivers, opportunities, restraints and challenges), cost structure, impact of rising hospital bed prices and recent developments.
This report includes data analysis and invaluable insight into how COVID-19 will affect the industry and your company. Four COVID-19 recovery patterns and their impact, namely, V, L, W and U are discussed in this report.
Global Hospital Bed Market (COVID Impact Analysis) by Application
• Non-intensive Care Beds
• Intensive Care Beds
Global Hospital Bed Market (COVID Impact Analysis) by Type
• Electric Beds
• Semi-electric Beds
• Manual Beds
Global Hospital Bed Market (COVID Impact Analysis) by Hospital Type
• Publicly Owned Hospitals
• Not-for-Profit Owned Hospitals
• Privately Owned Hospitals
• For-Profit Owned Hospitals
• Other Hospitals
Global Hospital Bed Market (COVID Impact Analysis) by Type of Care
• Curative Care Beds
• Rehabilitative Care Beds
• Long-term Care Beds
• Psychiatric Care Beds
• Maternity Care Beds
• Other hospital beds
Global Hospital Bed Market (COVID Impact Analysis) by End User
• Hospitals
• Home Care Settings
• Elderly Care Facilities
• Other End-User

In addition to the revenue predictions for the overall world market and segments, you will also find revenue forecasts for 4 regional and 20 leading national markets:
North America Hospital Bed Market, 2022 to 2032 Market Outlook
• U.S. Hospital Bed Market, 2022 to 2032 Market Forecast & COVID Impact Analysis
• Canada Hospital Bed Market, 2022 to 2032 Market Forecast & COVID Impact Analysis
• Mexico Hospital Bed Market, 2022 to 2032 Market Forecast & COVID Impact Analysis
Europe Hospital Bed Market, 2022 to 2032 Market Outlook
• Germany Hospital Bed Market, 2022 to 2032 Market Forecast & COVID Impact Analysis
• Spain Hospital Bed Market, 2022 to 2032 Market Forecast & COVID Impact Analysis
• United Kingdom Hospital Bed Market, 2022 to 2032 Market Forecast & COVID Impact Analysis
• France Hospital Bed Market, 2022 to 2032 Market Forecast & COVID Impact Analysis
• Italy Hospital Bed Market, 2022 to 2032 Market Forecast & COVID Impact Analysis
• Rest of Europe Market Forecast & COVID Impact Analysis
Asia Pacific Hospital Bed Market, 2022 to 2032 Market Outlook
• China Hospital Bed Market, 2022 to 2032 Market Forecast & COVID Impact Analysis
• Japan Hospital Bed Market, 2022 to 2032 Market Forecast & COVID Impact Analysis
• India Hospital Bed Market, 2022 to 2032 Market Forecast & COVID Impact Analysis
• Australia Hospital Bed Market, 2022 to 2032 Market Forecast & COVID Impact Analysis
• South Korea Hospital Bed Market, 2022 to 2032 Market Forecast & COVID Impact Analysis
• Rest of Asia Pacific Market Forecast & COVID Impact Analysis
LAMEA Hospital Bed Market, 2022 to 2032 Market Outlook
• Brazil Hospital Bed Market, 2022 to 2032 Market Forecast & COVID Impact Analysis
• Turkey Hospital Bed Market, 2022 to 2032 Market Forecast & COVID Impact Analysis
• Saudi Arabia Hospital Bed Market, 2022 to 2032 Market Forecast & COVID Impact Analysis
• South Africa Hospital Bed Market, 2022 to 2032 Market Forecast & COVID Impact Analysis
• UAE Hospital Bed Market, 2022 to 2032 Market Forecast & COVID Impact Analysis
• Rest of Latin America, Middle East and Africa
Need industry data? Please contact us today.
The report also includes profiles and for some of the leading companies in the Hospital Bed Market, 2022 to 2032, with a focus on this segment of these companies’ operations.
Leading companies and the potential for market growth
• Amico Corporation
• Antano Group
• Famed Zywiec Sp Zo. O
• Gendron Inc.
• Getinge AB
• GF Health Products, Inc.
• Hard Manufacturing Co, Inc.
• Hill-Rom Holdings, Inc.
• Invacare Corporation
• LINET Spol S.R.O
• Malvestio S.P.A
• Medline Industries
• Merivaara Corporation
• Midmark Corporation
• Paramount Bed Holdings Co. Ltd.
• Savaria Corporation
• Savion Industries
• Stiegelmeyer GmbH & Co.
• Stryker Corporation
• Umano Medical Inc.
Overall world revenue for Hospital Bed Market, 2022 to 2032 in terms of value the market will surpass US$xx million in 2022, our work calculates. We predict strong revenue growth through to 2032. Our work identifies which organizations hold the greatest potential. Discover their capabilities, progress, and commercial prospects, helping you stay ahead.
How the Hospital Bed Market, 2022 to 2032 Market report helps you?
In summary, our 521-page report provides you with the following knowledge:
• Revenue forecasts to 2032 for Hospital Bed Market, 2022 to 2032 Market, with forecasts for application, hospital type, bed type each forecasted at a global and regional level– discover the industry’s prospects, finding the most lucrative places for investments and revenues
• Revenue forecasts to 2032 for 4 regional and 20 key national markets – See forecasts for the Hospital Bed Market, 2022 to 2032 market in North America, Europe, Asia-Pacific and LAMEA. Also forecasted is the market in the US, Canada, Mexico, Brazil, Germany, France, UK, Italy, China, India, Japan, and Australia among other prominent economies.
• Prospects for established firms and those seeking to enter the market– including company profiles for 20 of the major companies involved in the Hospital Bed Market, 2022 to 2032 Market.
Find quantitative and qualitative analyses with independent predictions. Receive information that only our report contains, staying informed with this invaluable business intelligence.
Information found nowhere else
With our newly report title, you are less likely to fall behind in knowledge or miss out on opportunities. See how our work could benefit your research, analyses, and decisions. Visiongain’s study is for everybody needing commercial analyses for the Hospital Bed Market, 2022 to 2032 Market and leading companies. You will find data, trends and predictions.
To access the data contained in this document please email contactus@visiongain.com
Buy our report today Hospital Bed Market Report 2022-2032: Forecasts by Application (Non Intensive Care Beds, Intensive Care Beds), by Type (Manual, Semi-Electric, Electric), by Hospital Type (Publicly Owned, Not-for-Profit, Privately Owned, For-Profit), by Type of Care (Curative, Rehabilitative, Long Term, Psychiatric, Maternity), by End-user (Hospitals, Home Care, Settings, Elderly, Facilities) AND Regional and Leading National Market Analysis PLUS Analysis of Leading Companies AND COVID-19 Recovery Scenarios. Avoid missing out by staying informed – order our report now.
Visiongain is a trading partner with the US Federal Government
CCR Ref number: KD4R6
Do you have any custom requirements we can help you with? Any need for a specific country, geo region, market segment or specific company information? Contact us today, we can discuss your needs and see how we can help: contactus@visiongain.com
1. Report Overview
1.1 Introduction to Hospital Bed Market
1.2 Global Hospital Bed Market Overview
1.3 What are the Objectives of this Report?
1.4 What is the Scope of the Report?
1.5 Hospital Bed Market Definition
1.6 Why You Should Read This Report
1.7 What This Report Delivers
1.8 Key Questions Answered By This Analytical Report Include:
1.9 Who is This Report for?
1.10 Research Methodology
1.10.1 Primary Research
1.10.2 Secondary Research
1.10.3 Market Evaluation & Forecasting Methodology
1.11 Frequently Asked Questions (FAQs)
1.12 Associated Visiongain Reports
1.13 About Visiongain
2 Executive Summary
3 Global Market Dynamics
3.1 Current Trends in the Global Market
3.1.1 Need for Bariatric Furniture
3.1.2 Fatal Injuries
3.1.3 Global Health Care Projects
3.2 Market Driving Factors
3.2.1 Rising Numbers of Private Hospitals
3.2.2 Increased Hospital Admissions
3.2.3 Technological Development
3.3 Market Restraining Factors
3.3.1 Expensive Products
3.3.2 Durability is High
3.4 Opportunities in the Global Market
3.4.1 The demand for easy-to-manage quarantine beds is fuelled by the Coronavirus pandemic
3.4.2 Ergonomically Sound Furniture
3.4.3 A High Patient-To-Facility Ratio Creates Revenue Opportunities.
3.4.4 High Obese Population Fuels Innovations in Hospital Furniture
3.4.5 The size of the wood furniture industry is favoured by improved patient comfort and flexibility.
3.5 Challenges in the Global Market
3.5.1 High-Cost Technology
3.5.2 Rising Occurrence of Various Diseases
3.5.3 Experimental Furnitures are Expensive
3.6 SWOT Analysis of The Market
3.6.1 Market Strengths
3.6.1.1 Infrastructure Development is in Demand
3.6.1.2 Increased Investments
3.6.1.3 Increase in Healthcare Fundings
3.6.2 Market Weakness
3.6.2.1 Limited Supply Of Trained Labour
3.6.2.2 Administrative or Policy Flaws
3.6.2.3 High start-up costs and low returns
3.6.3 Market Opportunities
3.6.3.1 Complete Interior Concepts are Critical in the Design of High-End Patient Care Beds
3.6.3.2 The availability of high-quality medical infrastructure in hospitals would help the medical furniture industry grow.
3.6.3.3 Patients and caregivers get benefit from improved features in medical beds.
3.6.4 Market Threats
3.6.4.1 Manufacturing Expenses Are High
3.6.4.2 Shortages Of Healthcare Experts
3.6.4.3 Consumer Exploitation
3.7 PEST Analysis of The Market
3.7.1 The Political Factors Of The Market
3.7.2 The Economic Factors Of The Market
3.7.3 The Social Factors Of The Market
3.7.4 The Technological Factors Of The Market
3.8 Porter’s Five Forces Analysis of the Market
3.8.1 Competitive Rivalry
3.8.2 Threat of New Entrants
3.8.3 Threat of Substitutes
3.8.4 Bargaining Power of Suppliers
3.8.5 Bargaining Power of Buyers
4 Global Hospital Bed Market Analysis
4.1 Global Market Outlook
4.2 Global Market Size Estimation and Forecast
4.2.1 Pre-COVID-19 Market Scenario
4.2.2 Post-COVID-19 Market Scenarios (V, W, U, L-Shaped Recovery Analysis)
4.3 Regional Market Size Estimation and Forecast
4.3.1 Pre-COVID-19 Market Scenario
4.3.2 Post-COVID-19 Market Scenarios (V, W, U, L-Shaped Recovery Analysis)
4.4 Global Market Size Estimation and Forecast by Application
4.4.1 Segment Overview
4.4.1.1 Non-Intensive Care Beds
4.4.1.2 Intensive Care Beds
4.4.2 Pre-COVID-19 Market Scenario
4.4.3 Post-COVID-19 Market Scenarios (V, W, U, L-Shaped Recovery Analysis)
4.5 Global Market Size Estimation and Forecast by Type
4.5.1 Segment Overview
4.5.1.1 Manual Beds
4.5.1.2 Semi-Electric Beds
4.5.1.3 Electric Beds
4.5.2 Pre-COVID-19 Market Scenario
4.5.3 Post-COVID-19 Market Scenarios (V, W, U, L-Shaped Recovery Analysis)
4.6 Global Market Size Estimation and Forecast by Hospital Type
4.6.1 Segment Overview
4.6.1.1 Publicly Owned Hospitals
4.6.1.2 Not-for-Profit Owned Hospitals
4.6.1.3 Privately Owned Hospitals
4.6.1.4 For-Profit Owned Hospitals
4.6.1.5 Others
4.6.2 Pre-COVID-19 Market Scenario
4.6.3 Post-COVID-19 Market Scenarios (V, W, U, L-Shaped Recovery Analysis)
4.7 Global Market Size Estimation and Forecast by Type of Care
4.7.1 Segment Overview
4.7.1.1 Curative Care Beds
4.7.1.2 Rehabilitative Care Beds
4.7.1.3 Long-Term Care Beds
4.7.1.4 Psychiatric Care Beds
4.7.1.5 Maternity Care Beds
4.7.1.6 Others
4.7.2 Pre-COVID-19 Market Scenario
4.7.3 Post-COVID-19 Market Scenarios (V, W, U, L-Shaped Recovery Analysis)
4.8 Global Market Size Estimation and Forecast by End User
4.8.1 Segment Overview
4.8.1.1 Hospitals
4.8.1.2 Home Care Settings
4.8.1.3 Elderly Care Facilities
4.8.2 Pre-COVID-19 Market Scenario
4.8.3 Post-COVID-19 Market Scenarios (V, W, U, L-Shaped Recovery Analysis)
5 North America Hospital Bed Market Analysis
5.1 North America Market Outlook
5.2 North America Market Size Estimation and Forecast
5.2.1 Pre-COVID-19 Market Scenario
5.2.2 Post-COVID-19 Market Scenarios (V, W, U, L-Shaped Recovery Analysis)
5.3 Country Market Size Estimation and Forecast
5.3.1 Pre-COVID-19 Market Scenario
5.3.2 Post-COVID-19 Market Scenarios (V, W, U, L-Shaped Recovery Analysis)
5.4 North America Market Size Estimation and Forecast by Application
5.4.1 Pre-COVID-19 Market Scenario
5.4.2 Post-COVID-19 Market Scenarios (V, W, U, L-Shaped Recovery Analysis)
5.5 North America Market Size Estimation and Forecast by Type
5.5.1 Pre-COVID-19 Market Scenario
5.5.2 Post-COVID-19 Market Scenarios (V, W, U, L-Shaped Recovery Analysis)
5.6 North America Market Size Estimation and Forecast by Hospital Type
5.6.1 Pre-COVID-19 Market Scenario
5.6.2 Post-COVID-19 Market Scenarios (V, W, U, L-Shaped Recovery Analysis)
5.7 North America Market Size Estimation and Forecast Type of Care
5.7.1 Pre-COVID-19 Market Scenario
5.7.2 Post-COVID-19 Market Scenarios (V, W, U, L-Shaped Recovery Analysis)
5.8 North America Market Size Estimation and Forecast by End User
5.8.1 Pre-COVID-19 Market Scenario
5.8.2 Post-COVID-19 Market Scenarios (V, W, U, L-Shaped Recovery Analysis)
5.9 US Hospital Bed Market Analysis
5.9.1 Restrictions by U.S FDA on Hospital Furniture.
5.9.2 Pre-COVID-19 Market Scenario
5.9.3 Post-COVID-19 Market Scenarios (V, W, U, L-Shaped Recovery Analysis)
5.10 Canada Hospital Bed Market Analysis
5.10.1 Hospitals Have Always Been The Highest Healthcare Spenders
5.10.2 Pre-COVID-19 Market Scenario
5.10.3 Post-COVID-19 Market Scenarios (V, W, U, L-Shaped Recovery Analysis)
5.11 Mexico Hospital Bed Market Analysis
5.11.1 Covid-19 Has Not Overwhelmed Mexico’s Health Care system
5.11.2 Pre-COVID-19 Market Scenario
5.11.3 Post-COVID-19 Market Scenarios (V, W, U, L-Shaped Recovery Analysis)
6 Europe Hospital Bed Market Analysis
6.1 Europe Market Outlook
6.2 Europe Market Size Estimation and Forecast
6.2.1 Pre-COVID-19 Market Scenario
6.2.2 Post-COVID-19 Market Scenarios (V, W, U, L-Shaped Recovery Analysis)
6.3 Country Market Size Estimation and Forecast
6.3.1 Pre-COVID-19 Market Scenario
6.3.2 Post-COVID-19 Market Scenarios (V, W, U, L-Shaped Recovery Analysis)
6.4 Europe Market Size Estimation and Forecast by Application
6.4.1 Pre-COVID-19 Market Scenario
6.4.2 Post-COVID-19 Market Scenarios (V, W, U, L-Shaped Recovery Analysis)
6.5 Europe Market Size Estimation and Forecast by Type
6.5.1 Pre-COVID-19 Market Scenario
6.5.2 Post-COVID-19 Market Scenarios (V, W, U, L-Shaped Recovery Analysis)
6.6 Europe Market Size Estimation and Forecast by Hospital Type
6.6.1 Pre-COVID-19 Market Scenario
6.6.2 Post-COVID-19 Market Scenarios (V, W, U, L-Shaped Recovery Analysis)
6.7 Europe Market Size Estimation and Forecast by Type of Care
6.7.1 Pre-COVID-19 Market Scenario
6.7.2 Post-COVID-19 Market Scenarios (V, W, U, L-Shaped Recovery Analysis)
6.8 Europe Market Size Estimation and Forecast by End User
6.8.1 Pre-COVID-19 Market Scenario
6.8.2 Post-COVID-19 Market Scenarios (V, W, U, L-Shaped Recovery Analysis)
6.9 Germany Hospital Bed Market Analysis
6.9.1 Germany Has Sufficient Capacity Of Hospital Beds In The Pandemic.
6.9.2 Push And Pull Factors Explain Excessive Hospital Capacity.
6.9.3 Pre-COVID-19 Market Scenario
6.9.4 Post-COVID-19 Market Scenarios (V, W, U, L-Shaped Recovery Analysis)
6.10 UK Hospital Bed Market Analysis
6.10.1 Europe’s Fastest Growing Regional Market in Terms of Hospital Market is UK.
6.10.2 Pre-COVID-19 Market Scenario
6.10.3 Post-COVID-19 Market Scenarios (V, W, U, L-Shaped Recovery Analysis)
6.11 France Hospital Bed Market Analysis
6.11.1 Hospitals Continues To Decrease In France
6.11.2 Pre-COVID-19 Market Scenario
6.11.3 Post-COVID-19 Market Scenarios (V, W, U, L-Shaped Recovery Analysis)
6.12 Italy Hospital Bed Market Analysis
6.12.1 Italy Is Moving Towards Value Based Health Care.
6.12.2 Pre-COVID-19 Market Scenario
6.12.3 Post-COVID-19 Market Scenarios (V, W, U, L-Shaped Recovery Analysis)
6.13 Spain Hospital Bed Market Analysis
6.13.1 Spain Handled Consistent Number Of Patients On A Limited Hospital Beds
6.13.2 Pre-COVID-19 Market Scenario
6.13.3 Post-COVID-19 Market Scenarios (V, W, U, L-Shaped Recovery Analysis)
6.14 Rest of Europe Hospital Bed Market Analysis
6.14.1 Europe’s Hospital Bed Market is Growing
6.14.2 Pre-COVID-19 Market Scenario
6.14.3 Post-COVID-19 Market Scenarios (V, W, U, L-Shaped Recovery Analysis)
7 Asia-Pacific Hospital Bed Market Analysis
7.1 Asia-Pacific Market Outlook
7.2 Asia-Pacific Market Size Estimation and Forecast
7.2.1 Pre-COVID-19 Market Scenario
7.2.2 Post-COVID-19 Market Scenarios (V, W, U, L-Shaped Recovery Analysis)
7.3 Country Market Size Estimation and Forecast
7.3.1 Pre-COVID-19 Market Scenario
7.3.2 Post-COVID-19 Market Scenarios (V, W, U, L-Shaped Recovery Analysis)
7.4 Asia-Pacific Market Size Estimation and Forecast by Application
7.4.1 Pre-COVID-19 Market Scenario
7.4.2 Post-COVID-19 Market Scenarios (V, W, U, L-Shaped Recovery Analysis)
7.5 Asia-Pacific Market Size Estimation and Forecast by Type
7.5.1 Pre-COVID-19 Market Scenario
7.5.2 Post-COVID-19 Market Scenarios (V, W, U, L-Shaped Recovery Analysis)
7.6 Asia-Pacific Market Size Estimation and Forecast by Hospital Type
7.6.1 Pre-COVID-19 Market Scenario
7.6.2 Post-COVID-19 Market Scenarios (V, W, U, L-Shaped Recovery Analysis)
7.7 Asia-Pacific Market Size Estimation and Forecast by Type of Care
7.7.1 Pre-COVID-19 Market Scenario
7.7.2 Post-COVID-19 Market Scenarios (V, W, U, L-Shaped Recovery Analysis)
7.8 Asia-Pacific Market Size Estimation and Forecast by End User
7.8.1 Pre-COVID-19 Market Scenario
7.8.2 Post-COVID-19 Market Scenarios (V, W, U, L-Shaped Recovery Analysis)
7.9 China Hospital Bed Market Analysis
7.9.1 The Private Sector Has Significantly Developed In China's Hospital Business.
7.9.2 Pre-COVID-19 Market Scenario
7.9.3 Post-COVID-19 Market Scenarios (V, W, U, L-Shaped Recovery Analysis)
7.10 India Hospital Bed Market Analysis
7.10.1 India Met With Huge Shortage Of Beds During The Pandemic
7.10.2 Pre-COVID-19 Market Scenario
7.10.3 Post-COVID-19 Market Scenarios (V, W, U, L-Shaped Recovery Analysis)
7.11 Japan Hospital Bed Market Analysis
7.11.1 Japan Has An Active Healthcare System
7.11.2 Pre-COVID-19 Market Scenario
7.11.3 Post-COVID-19 Market Scenarios (V, W, U, L-Shaped Recovery Analysis)
7.12 South Korea Hospital Bed Market Analysis
7.12.1 South Korea Will Increase The Number Of Beds Amid Spread Of Covid-19 Variant Omicron
7.12.2 Pre-COVID-19 Market Scenario
7.12.3 Post-COVID-19 Market Scenarios (V, W, U, L-Shaped Recovery Analysis)
7.13 Australia Hospital Bed Market Analysis
7.13.1 A Cooperation Between The Australian Government And The Commercial Health Industry Has Secured 30,000 Hospital Beds.
7.13.2 Four Sites For Modular Hospital Beds Have Been Selected In Western Australia.
7.13.3 Pre-COVID-19 Market Scenario
7.13.4 Post-COVID-19 Market Scenarios (V, W, U, L-Shaped Recovery Analysis)
7.14 Rest of Asia-Pacific Hospital Bed Market Analysis
7.14.1 The Region Is Expected To Develop Fast
7.14.2 Pre-COVID-19 Market Scenario
7.14.3 Post-COVID-19 Market Scenarios (V, W, U, L-Shaped Recovery Analysis)
8 LAMEA Hospital Bed Market Analysis
8.1 LAMEA Market Outlook
8.2 LAMEA Market Size Estimation and Forecast
8.2.1 Pre-COVID-19 Market Scenario
8.2.2 Post-COVID-19 Market Scenarios (V, W, U, L-Shaped Recovery Analysis)
8.3 Country Market Size Estimation and Forecast
8.3.1 Pre-COVID-19 Market Scenario
8.3.2 Post-COVID-19 Market Scenarios (V, W, U, L-Shaped Recovery Analysis)
8.4 LAMEA Market Size Estimation and Forecast by Application
8.4.1 Pre-COVID-19 Market Scenario
8.4.2 Post-COVID-19 Market Scenarios (V, W, U, L-Shaped Recovery Analysis)
8.5 LAMEA Market Size Estimation and Forecast by Type
8.5.1 Pre-COVID-19 Market Scenario
8.5.2 Post-COVID-19 Market Scenarios (V, W, U, L-Shaped Recovery Analysis)
8.6 LAMEA Market Size Estimation and Forecast by Hospital Type
8.6.1 Pre-COVID-19 Market Scenario
8.6.2 Post-COVID-19 Market Scenarios (V, W, U, L-Shaped Recovery Analysis)
LAMEA Market Size Estimation and Forecast by Type of Care
8.6.3 Pre-COVID-19 Market Scenario
8.6.4 Post-COVID-19 Market Scenarios (V, W, U, L-Shaped Recovery Analysis)
8.7 LAMEA Market Size Estimation and Forecast by End User
8.7.1 Pre-COVID-19 Market Scenario
8.7.2 Post-COVID-19 Market Scenarios (V, W, U, L-Shaped Recovery Analysis)
8.8 Brazil Hospital Bed Market Analysis
8.8.1 Brazil’s Hospitals Were Over Burdened Due To Bed Shortages
8.8.2 Pre-COVID-19 Market Scenario
8.8.3 Post-COVID-19 Market Scenarios (V, W, U, L-Shaped Recovery Analysis)
8.9 South Africa Hospital Bed Market Analysis
8.9.1 South Africa Has a Possibility That Public Hospitals Run Out Of Critical Care Beds
8.9.2 Pre-COVID-19 Market Scenario
8.9.3 Post-COVID-19 Market Scenarios (V, W, U, L-Shaped Recovery Analysis)
8.10 Saudi Arabia Hospital Bed Market Analysis
8.10.1 In Saudi Arabia, The Public Sector Dominates The Provision Of Healthcare Services
8.10.2 Pre-COVID-19 Market Scenario
8.10.3 Post-COVID-19 Market Scenarios (V, W, U, L-Shaped Recovery Analysis)
8.11 Turkey Hospital Bed Market Analysis
8.11.1 Turkey Will Increase Expenditure On Overall Healthcare
8.11.2 Pre-COVID-19 Market Scenario
8.11.3 Post-COVID-19 Market Scenarios (V, W, U, L-Shaped Recovery Analysis)
8.12 UAE Hospital Bed Market Analysis
8.12.1 UAE in Scarcity Of Hospital Beds
8.12.2 Pre-COVID-19 Market Scenario
8.12.3 Post-COVID-19 Market Scenarios (V, W, U, L-Shaped Recovery Analysis)
8.13 Rest of LAMEA Hospital Bed Market Analysis
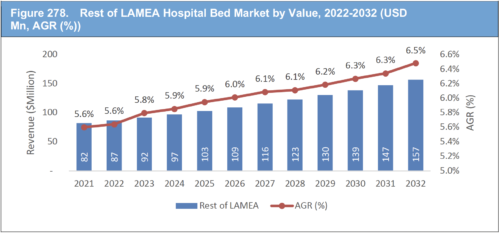
8.13.1 The LAMEA Is Striving To Respond To The Huge Problems Posed By The COVID-19 Pandemic.
8.13.2 Pre-COVID-19 Market Scenario
8.13.3 Post-COVID-19 Market Scenarios (V, W, U, L-Shaped Recovery Analysis)
9 Leading Company Analysis and Profile
9.1 GF Health Products Inc.
9.1.1 Company Snapshot
9.1.1 Company Overview
9.1.2 Company Financial Profile
9.1.3 Company Product Benchmarking
9.1.4 Company Recent Developments
9.2 Getinge AB
9.2.1 Company Snapshot
9.2.2 Company Overview
9.2.3 Company Financial Profile
9.2.4 Company Product Benchmarking
9.2.5 Company Recent Developments
9.3 Hillrom
9.3.1 Company Snapshot
9.3.2 Company Overview
9.3.3 Company Financial Profile
9.3.4 Company Product Benchmarking
9.3.5 Company Recent Developments
9.4 Invacare Corporation
9.4.1 Company Snapshot
9.4.2 Company Overview
9.4.3 Company Financial Profile
9.4.4 Company Product Benchmarking
9.5 Malvestio S.P.A
9.5.1 Company Snapshot
9.5.2 Company Overview
9.5.3 Company Product Benchmarking
9.6 Stryker Corporation
9.6.1 Company Snapshot
9.6.2 Company Overview
9.6.3 Company Financial Profile
9.6.4 Company Product Benchmarking
9.6.5 Company Recent Developments
9.7 Savaria Corporation
9.7.1 Company Snapshot
9.7.2 Company Overview
9.7.3 Company Financial Profile
9.7.4 Company Product Benchmarking
9.7.5 Company Recent Developments
9.8 Antano Group
9.8.1 Company Snapshot
9.8.2 Company Overview
9.8.3 Company Product Benchmarking
9.9 Savion Industries
9.9.1 Company Snapshot
9.9.2 Company Overview
9.9.3 Company Product Benchmarking
9.10 Stiegelmeyer GmbH & Co.
9.10.1 Company Snapshot
9.10.2 Company Overview
9.10.3 Company Product Benchmarking
9.11 Amico Corporation
9.11.1 Company Snapshot
9.11.2 Company Overview
9.11.3 Company Product Benchmarking
9.12 Medline Industries
9.12.1 Company Snapshot
9.12.2 Company Overview
9.12.3 Company Product Benchmarking
9.12.4 Company Recent Developments
9.13 LINET Spol S.R.O
9.13.1 Company Snapshot
9.13.2 Company Overview
9.13.3 Company Product Benchmarking
9.13.4 Company Recent Developments
9.14 Merivaara Corporation
9.14.1 Company Snapshot
9.14.2 Company Overview
9.14.3 Company Product Benchmarking
9.14.4 Company Recent Developments
9.15 Paramount Bed Holdings Co. Ltd.
9.15.1 Company Snapshot
9.15.2 Company Overview
9.15.3 Company Financial Profile
9.15.4 Company Product Benchmarking
9.15.5 Company Recent Developments
9.16 Midmark Corporation
9.16.1 Company Snapshot
9.16.2 Company Overview
9.16.3 Company Product Benchmarking
9.17 Famed Zywiec Sp Zo. O
9.17.1 Company Snapshot
9.17.2 Company Overview
9.17.3 Company Product Benchmarking
9.18 Gendron Inc.
9.18.1 Company Snapshot
9.18.2 Company Overview
9.18.3 Company Product Benchmarking
9.19 Hard Manufacturing Co, Inc.
9.19.1 Company Snapshot
9.19.2 Company Overview
9.19.3 Company Product Benchmarking
9.20 Umano Medical Inc.
9.20.1 Company Snapshot
9.20.2 Company Overview
9.20.3 Company Product Benchmarking
10 Conclusion and Recommendations
10.1 Concluding Remarks
10.2 Recommendations for Market Players
List of Tables
Table 1. Global Hospital Bed Market Snapshot, 2022 & 2032 (US$ million, CAGR %)
Table 2. Global Hospital Bed Market Forecast, 2022-2032 (USD Mn, AGR (%), CAGR(%))
Table 3. Global Hospital Bed Market Forecast, 2022-2032 (USD Mn, AGR (%), CAGR(%)) (V – Shaped Recovery)
Table 4. Global Hospital Bed Market Forecast, 2022-2032 (USD Mn, AGR (%), CAGR(%)) (W – Shaped Recovery)
Table 5. Global Hospital Bed Market Forecast, 2022-2032 (USD Mn, AGR (%), CAGR(%))(U – Shaped Recovery)
Table 6. Global Hospital Bed Market Forecast, 2022-2032 (USD Mn, AGR (%), CAGR(%)) (L – Shaped Recovery)
Table 7. Global Hospital Bed Market by Region, 2022-2032 (USD Mn, AGR (%), CAGR(%))
Table 8. Global Hospital Bed Market by Region, 2022-2032 (USD Mn, AGR (%), CAGR(%))(V – Shaped Recovery)
Table 9. Global Hospital Bed Market by Region, 2022-2032 (USD Mn, AGR (%), CAGR(%))(W – Shaped Recovery)
Table 10. Global Hospital Bed Market by Region, 2022-2032 (USD Mn, AGR (%), CAGR(%))(U – Shaped Recovery)
Table 11. Global Hospital Bed Market by Region, 2022-2032 (USD Mn, AGR (%), CAGR(%)) (L – Shaped Recovery)
Table 12. Global Hospital Bed Market by Application, 2022-2032 (USD Mn, AGR (%), CAGR(%))
Table 13. Global Hospital Bed Market by Application, 2022-2032 (USD Mn, AGR (%), CAGR(%)) (V – Shaped Recovery)
Table 14. Global Hospital Bed Market by Application, 2022-2032 (USD Mn, AGR (%), CAGR(%)) (W – Shaped Recovery)
Table 15. Global Hospital Bed Market by Application, 2022-2032 (USD Mn, AGR (%), CAGR(%)) (U – Shaped Recovery)
Table 16. Global Hospital Bed Market by Application, 2022-2032 (USD Mn, AGR (%), CAGR(%)) (L – Shaped Recovery)
Table 17. Global Hospital Bed Market by Type, 2022-2032 (USD Mn, AGR (%), CAGR(%))
Table 18. Global Hospital Bed Market by Type, 2022-2032 (USD Mn, AGR (%), CAGR(%))(V – Shaped Recovery)
Table 19. Global Hospital Bed Market by Type, 2022-2032 (USD Mn, AGR (%), CAGR(%)) (W – Shaped Recovery)
Table 20. Global Hospital Bed Market by Type, 2022-2032 (USD Mn, AGR (%), CAGR(%)) (U – Shaped Recovery)
Table 21. Global Hospital Bed Market by Type, 2022-2032 (USD Mn, AGR (%), CAGR(%))(L – Shaped Recovery)
Table 22. Global Hospital Bed Market by Hospital Type, 2022-2032 (USD Mn, AGR (%), CAGR(%))
Table 23. Global Hospital Bed Market by Hospital Type, 2022-2032 (USD Mn, AGR (%), CAGR(%))(V – Shaped Recovery)
Table 24. Global Hospital Bed Market by Hospital Type, 2022-2032 (USD Mn, AGR (%), CAGR(%))(W – Shaped Recovery)
Table 25. Global Hospital Bed Market by Hospital Type, 2022-2032 (USD Mn, AGR (%), CAGR(%))(U – Shaped Recovery)
Table 26. Global Hospital Bed Market by Hospital Type, 2022-2032 (USD Mn, AGR (%), CAGR(%))(L – Shaped Recovery)
Table 27. Global Hospital Bed Market by Type of Care, 2022-2032 (USD Mn, AGR (%), CAGR(%))
Table 28. Global Hospital Bed Market by Type of Care, 2022-2032 (USD Mn, AGR (%), CAGR(%))(V – Shaped Recovery)
Table 29. Global Hospital Bed Market by Type of Care, 2022-2032 (USD Mn, AGR (%), CAGR(%))(W – Shaped Recovery)
Table 30. Global Hospital Bed Market by Type of Care, 2022-2032 (USD Mn, AGR (%), CAGR(%))(U – Shaped Recovery)
Table 31. Global Hospital Bed Market by Type of Care, 2022-2032 (USD Mn, AGR (%), CAGR(%)) (L – Shaped Recovery)
Table 32. Global Hospital Bed Market by End User, 2022-2032 (USD Mn, AGR (%), CAGR(%))
Table 33. Global Hospital Bed Market by End User, 2022-2032 (USD Mn, AGR (%), CAGR(%))(V – Shaped Recovery)
Table 34. Global Hospital Bed Market by End User, 2022-2032 (USD Mn, AGR (%), CAGR(%))(W – Shaped Recovery)
Table 35. Global Hospital Bed Market by End User, 2022-2032 (USD Mn, AGR (%), CAGR(%)) (U – Shaped Recovery)
Table 36. Global Hospital Bed Market by End User, 2022-2032 (USD Mn, AGR (%), CAGR(%)) (L – Shaped Recovery)
Table 37. North America Hospital Bed Market by Value, 2022-2032 (USD Mn, AGR (%), CAGR(%))
Table 38. North America Hospital Bed Market by Value, 2022-2032 (USD Mn, AGR (%), CAGR(%))(V – Shaped Recovery)
Table 39. North America Hospital Bed Market by Value, 2022-2032 (USD Mn, AGR (%), CAGR(%))(W – Shaped Recovery)
Table 40. North America Hospital Bed Market by Value, 2022-2032 (USD Mn, AGR (%), CAGR(%))(U – Shaped Recovery)
Table 41. North America Hospital Bed Market by Value, 2022-2032 (USD Mn, AGR (%), CAGR(%))(L – Shaped Recovery)
Table 42. North America Hospital Bed Market by Country, 2022-2032 (USD Mn, AGR (%), CAGR(%))
Table 43. North America Hospital Bed Market by Country, 2022-2032 (USD Mn, AGR (%), CAGR(%))(V – Shaped Recovery)
Table 44. North America Hospital Bed Market by Country, 2022-2032 (USD Mn, AGR (%), CAGR(%))(W – Shaped Recovery)
Table 45. North America Hospital Bed Market by Country, 2022-2032 (USD Mn, AGR (%), CAGR(%))(U – Shaped Recovery)
Table 46. North America Hospital Bed Market by Country, 2022-2032 (USD Mn, AGR (%), CAGR(%))(L – Shaped Recovery)
Table 47. North America Hospital Bed Market by Application, 2022-2032 (USD Mn, AGR (%), CAGR(%))
Table 48. North America Hospital Bed Market by Application, 2022-2032 (USD Mn, AGR (%), CAGR(%))(V – Shaped Recovery)
Table 49. North America Hospital Bed Market by Application, 2022-2032 (USD Mn, AGR (%), CAGR(%))(W – Shaped Recovery)
Table 50. North America Hospital Bed Market by Application, 2022-2032 (USD Mn, AGR (%), CAGR(%))(U – Shaped Recovery)
Table 51. North America Hospital Bed Market by Application, 2022-2032 (USD Mn, AGR (%), CAGR(%))(L – Shaped Recovery)
Table 52. North America Hospital Bed Market by Type, 2022-2032 (USD Mn, AGR (%), CAGR(%))
Table 53. North America Hospital Bed Market by Type, 2022-2032 (USD Mn, AGR (%), CAGR(%))(V – Shaped Recovery)
Table 54. North America Hospital Bed Market by Type, 2022-2032 (USD Mn, AGR (%), CAGR(%))(W – Shaped Recovery)
Table 55. North America Hospital Bed Market by Type, 2022-2032 (USD Mn, AGR (%), CAGR(%))(U – Shaped Recovery)
Table 56. North America Hospital Bed Market by Type, 2022-2032 (USD Mn, AGR (%), CAGR(%))(L – Shaped Recovery)
Table 57. North America Hospital Bed Market by Hospital Type, 2022-2032 (USD Mn, AGR (%), CAGR(%))
Table 58. North America Hospital Bed Market by Hospital Type, 2022-2032 (USD Mn, AGR (%), CAGR(%))(V – Shaped Recovery)
Table 59. North America Hospital Bed Market by Hospital Type, 2022-2032 (USD Mn, AGR (%), CAGR(%))(W – Shaped Recovery)
Table 60. North America Hospital Bed Market by Hospital Type, 2022-2032 (USD Mn, AGR (%), CAGR(%))(U – Shaped Recovery)
Table 61. North America Hospital Bed Market by Hospital Type, 2022-2032 (USD Mn, AGR (%), CAGR(%))(L – Shaped Recovery)
Table 62. North America Hospital Bed Market by Type of Care, 2022-2032 (USD Mn, AGR (%), CAGR(%))
Table 63. North America Hospital Bed Market by Type of Care, 2022-2032 (USD Mn, AGR (%), CAGR(%))(V – Shaped Recovery)
Table 64. North America Hospital Bed Market by Type of Care, 2022-2032 (USD Mn, AGR (%), CAGR(%))(W – Shaped Recovery)
Table 65. North America Hospital Bed Market by Type of Care, 2022-2032 (USD Mn, AGR (%), CAGR(%))(U – Shaped Recovery)
Table 66. North America Hospital Bed Market by Type of Care, 2022-2032 (USD Mn, AGR (%), CAGR(%))(L – Shaped Recovery)
Table 67. North America Hospital Bed Market by End User, 2022-2032 (USD Mn, AGR (%), CAGR(%))
Table 68. North America Hospital Bed Market by End User, 2022-2032 (USD Mn, AGR (%), CAGR(%))(V – Shaped Recovery)
Table 69. North America Hospital Bed Market by End User, 2022-2032 (USD Mn, AGR (%), CAGR(%))(W – Shaped Recovery)
Table 70. North America Hospital Bed Market by End User, 2022-2032 (USD Mn, AGR (%), CAGR(%))(U – Shaped Recovery)
Table 71. North America Hospital Bed Market by End User, 2022-2032 (USD Mn, AGR (%), CAGR(%))(L – Shaped Recovery)
Table 72. US Hospital Bed Market by Value, 2022-2032 (USD Mn, AGR (%), CAGR(%))
Table 73. US Hospital Bed Market by Value, 2022-2032 (USD Mn, AGR (%), CAGR(%))(V – Shaped Recovery)
Table 74. US Hospital Bed Market by Value, 2022-2032 (USD Mn, AGR (%), CAGR(%))(W – Shaped Recovery)
Table 75. US Hospital Bed Market by Value, 2022-2032 (USD Mn, AGR (%), CAGR(%))(U – Shaped Recovery)
Table 76. US Hospital Bed Market by Value, 2022-2032 (USD Mn, AGR (%), CAGR(%))(L – Shaped Recovery)
Table 77. Canada Hospital Bed Market by Value, 2022-2032 (USD Mn, AGR (%), CAGR(%))
Table 78. Canada Hospital Bed Market by Value, 2022-2032 (USD Mn, AGR (%), CAGR(%))(V – Shaped Recovery)
Table 79. Canada Hospital Bed Market by Value, 2022-2032 (USD Mn, AGR (%), CAGR(%))(W – Shaped Recovery)
Table 80. Canada Hospital Bed Market by Value, 2022-2032 (USD Mn, AGR (%), CAGR(%))(U – Shaped Recovery)
Table 81. Canada Hospital Bed Market by Value, 2022-2032 (USD Mn, AGR (%), CAGR(%))(L – Shaped Recovery)
Table 82. Mexico Hospital Bed Market by Value, 2022-2032 (USD Mn, AGR (%), CAGR(%))
Table 83. Mexico Hospital Bed Market by Value, 2022-2032 (USD Mn, AGR (%), CAGR(%))(V – Shaped Recovery)
Table 84. Mexico Hospital Bed Market by Value, 2022-2032 (USD Mn, AGR (%), CAGR(%))(W – Shaped Recovery)
Table 85. Mexico Hospital Bed Market by Value, 2022-2032 (USD Mn, AGR (%), CAGR(%))(U – Shaped Recovery)
Table 86. Mexico Hospital Bed Market by Value, 2022-2032 (USD Mn, AGR (%), CAGR(%))(L – Shaped Recovery)
Table 87. Europe Hospital Bed Market by Value, 2022-2032 (USD Mn, AGR (%), CAGR(%))
Table 88. Europe Hospital Bed Market by Value, 2022-2032 (USD Mn, AGR (%), CAGR(%))(V – Shaped Recovery)
Table 89. Europe Hospital Bed Market by Value, 2022-2032 (USD Mn, AGR (%), CAGR(%))(W – Shaped Recovery)
Table 90. Europe Hospital Bed Market by Value, 2022-2032 (USD Mn, AGR (%), CAGR(%))(U – Shaped Recovery)
Table 91. Europe Hospital Bed Market by Value, 2022-2032 (USD Mn, AGR (%), CAGR(%))(L – Shaped Recovery)
Table 92. Europe Hospital Bed Market by Country, 2022-2032 (USD Mn, AGR (%), CAGR(%))
Table 93. Europe Hospital Bed Market by Country, 2022-2032 (USD Mn, AGR (%), CAGR(%))(V – Shaped Recovery)
Table 94. Europe Hospital Bed Market by Country, 2022-2032 (USD Mn, AGR (%), CAGR(%))(W – Shaped Recovery)
Table 95. Europe Hospital Bed Market by Country, 2022-2032 (USD Mn, AGR (%), CAGR(%))(U – Shaped Recovery)
Table 96. Europe Hospital Bed Market by Country, 2022-2032 (USD Mn, AGR (%), CAGR(%))(L – Shaped Recovery)
Table 97. Europe Hospital Bed Market by Application, 2022-2032 (USD Mn, AGR (%), CAGR(%))
Table 98. Europe Hospital Bed Market by Application, 2022-2032 (USD Mn, AGR (%), CAGR(%))(V – Shaped Recovery)
Table 99. Europe Hospital Bed Market by Application, 2022-2032 (USD Mn, AGR (%), CAGR(%))(W – Shaped Recovery)
Table 100. Europe Hospital Bed Market by Application, 2022-2032 (USD Mn, AGR (%), CAGR(%))(U – Shaped Recovery)
Table 101. Europe Hospital Bed Market by Application, 2022-2032 (USD Mn, AGR (%), CAGR(%))(L – Shaped Recovery)
Table 102. Europe Hospital Bed Market by Type, 2022-2032 (USD Mn, AGR (%), CAGR(%))
Table 103. Europe Hospital Bed Market by Type, 2022-2032 (USD Mn, AGR (%), CAGR(%))(V – Shaped Recovery)
Table 104. Europe Hospital Bed Market by Type, 2022-2032 (USD Mn, AGR (%), CAGR(%))(W – Shaped Recovery)
Table 105. Europe Hospital Bed Market by Type, 2022-2032 (USD Mn, AGR (%), CAGR(%))(U – Shaped Recovery)
Table 106. Europe Hospital Bed Market by Type, 2022-2032 (USD Mn, AGR (%), CAGR(%))(L – Shaped Recovery)
Table 107. Europe Hospital Bed Market by Hospital Type, 2022-2032 (USD Mn, AGR (%), CAGR(%))
Table 108. Europe Hospital Bed Market by Hospital Type, 2022-2032 (USD Mn, AGR (%), CAGR(%))(V – Shaped Recovery)
Table 109. Europe Hospital Bed Market by Hospital Type, 2022-2032 (USD Mn, AGR (%), CAGR(%))(W – Shaped Recovery)
Table 110. Europe Hospital Bed Market by Hospital Type, 2022-2032 (USD Mn, AGR (%), CAGR(%))(U – Shaped Recovery)
Table 111. Europe Hospital Bed Market by Hospital Type, 2022-2032 (USD Mn, AGR (%), CAGR(%))(L – Shaped Recovery)
Table 112. Europe Hospital Bed Market by Type of Care, 2022-2032 (USD Mn, AGR (%), CAGR(%))
Table 113. Europe Hospital Bed Market by Type of Care, 2022-2032 (USD Mn, AGR (%), CAGR(%))(V – Shaped Recovery)
Table 114. Europe Hospital Bed Market by Type of Care, 2022-2032 (USD Mn, AGR (%), CAGR(%))(W – Shaped Recovery)
Table 115. Europe Hospital Bed Market by Type of Care, 2022-2032 (USD Mn, AGR (%), CAGR(%))(U – Shaped Recovery)
Table 116. Europe Hospital Bed Market by Type of Care, 2022-2032 (USD Mn, AGR (%), CAGR(%))(L – Shaped Recovery)
Table 117. Europe Hospital Bed Market by End User, 2022-2032 (USD Mn, AGR (%), CAGR(%))
Table 118. Europe Hospital Bed Market by End User, 2022-2032 (USD Mn, AGR (%), CAGR(%))(V – Shaped Recovery)
Table 119. Europe Hospital Bed Market by End User, 2022-2032 (USD Mn, AGR (%), CAGR(%))(W – Shaped Recovery)
Table 120. Europe Hospital Bed Market by End User, 2022-2032 (USD Mn, AGR (%), CAGR(%))(U – Shaped Recovery)
Table 121. Europe Hospital Bed Market by End User, 2022-2032 (USD Mn, AGR (%), CAGR(%))(L – Shaped Recovery)
Table 122. Germany Hospital Bed Market by Value, 2022-2032 (USD Mn, AGR (%), CAGR(%))
Table 123. Germany Hospital Bed Market by Value, 2022-2032 (USD Mn, AGR (%), CAGR(%))(V – Shaped Recovery)
Table 124. Germany Hospital Bed Market by Value, 2022-2032 (USD Mn, AGR (%), CAGR(%))(W – Shaped Recovery)
Table 125. Germany Hospital Bed Market by Value, 2022-2032 (USD Mn, AGR (%), CAGR(%))(U – Shaped Recovery)
Table 126. Germany Hospital Bed Market by Value, 2022-2032 (USD Mn, AGR (%), CAGR(%))(L – Shaped Recovery)
Table 127. UK Hospital Bed Market by Value, 2022-2032 (USD Mn, AGR (%), CAGR(%))
Table 128. UK Hospital Bed Market by Value, 2022-2032 (USD Mn, AGR (%), CAGR(%))(V – Shaped Recovery)
Table 129. UK Hospital Bed Market by Value, 2022-2032 (USD Mn, AGR (%), CAGR(%))(W – Shaped Recovery)
Table 130. UK Hospital Bed Market by Value, 2022-2032 (USD Mn, AGR (%), CAGR(%))(U – Shaped Recovery)
Table 131. UK Hospital Bed Market by Value, 2022-2032 (USD Mn, AGR (%), CAGR(%))(L – Shaped Recovery)
Table 132. France Hospital Bed Market by Value, 2022-2032 (USD Mn, AGR (%), CAGR(%))
Table 133. France Hospital Bed Market by Value, 2022-2032 (USD Mn, AGR (%), CAGR(%))(V – Shaped Recovery)
Table 134. France Hospital Bed Market by Value, 2022-2032 (USD Mn, AGR (%), CAGR(%))(W – Shaped Recovery)
Table 135. France Hospital Bed Market by Value, 2022-2032 (USD Mn, AGR (%), CAGR(%))(U – Shaped Recovery)
Table 136. France Hospital Bed Market by Value, 2022-2032 (USD Mn, AGR (%), CAGR(%))(L – Shaped Recovery)
Table 137. Italy Hospital Bed Market by Value, 2022-2032 (USD Mn, AGR (%), CAGR(%))
Table 138. Italy Hospital Bed Market by Value, 2022-2032 (USD Mn, AGR (%), CAGR(%))(V – Shaped Recovery)
Table 139. Italy Hospital Bed Market by Value, 2022-2032 (USD Mn, AGR (%), CAGR(%))(W – Shaped Recovery)
Table 140. Italy Hospital Bed Market by Value, 2022-2032 (USD Mn, AGR (%), CAGR(%))(U – Shaped Recovery)
Table 141. Italy Hospital Bed Market by Value, 2022-2032 (USD Mn, AGR (%), CAGR(%))(L – Shaped Recovery)
Table 142. Spain Hospital Bed Market by Value, 2022-2032 (USD Mn, AGR (%), CAGR(%))
Table 143. Spain Hospital Bed Market by Value, 2022-2032 (USD Mn, AGR (%), CAGR(%))(V – Shaped Recovery)
Table 144. Spain Hospital Bed Market by Value, 2022-2032 (USD Mn, AGR (%), CAGR(%))(W – Shaped Recovery)
Table 145. Spain Hospital Bed Market by Value, 2022-2032 (USD Mn, AGR (%), CAGR(%))(U – Shaped Recovery)
Table 146. Spain Hospital Bed Market by Value, 2022-2032 (USD Mn, AGR (%), CAGR(%))(L – Shaped Recovery)
Table 147. Rest of Europe Hospital Bed Market by Value, 2022-2032 (USD Mn, AGR (%), CAGR(%))
Table 148. Rest of Europe Hospital Bed Market by Value, 2022-2032 (USD Mn, AGR (%), CAGR(%))(V – Shaped Recovery)
Table 149. Rest of Europe Hospital Bed Market by Value, 2022-2032 (USD Mn, AGR (%), CAGR(%))(W – Shaped Recovery)
Table 150. Rest of Europe Hospital Bed Market by Value, 2022-2032 (USD Mn, AGR (%), CAGR(%))(U – Shaped Recovery)
Table 151. Rest of Europe Hospital Bed Market by Value, 2022-2032 (USD Mn, AGR (%), CAGR(%))(L – Shaped Recovery)
Table 152. Asia-Pacific Hospital Bed Market by Value, 2022-2032 (USD Mn, AGR (%), CAGR(%))
Table 153. Asia-Pacific Hospital Bed Market by Value, 2022-2032 (USD Mn, AGR (%), CAGR(%))(%)) (V – Shaped Recovery)
Table 154. Asia-Pacific Hospital Bed Market by Value, 2022-2032 (USD Mn, AGR (%), CAGR(%))(W – Shaped Recovery)
Table 155. Asia-Pacific Hospital Bed Market by Value, 2022-2032 (USD Mn, AGR (%), CAGR(%)) (U – Shaped Recovery)
Table 156. Asia-Pacific Hospital Bed Market by Value, 2022-2032 (USD Mn, AGR (%), CAGR(%))(L – Shaped Recovery)
Table 157. Asia-Pacific Hospital Bed Market by Country, 2022-2032 (USD Mn, AGR (%), CAGR(%))
Table 158. Asia-Pacific Hospital Bed Market by Country, 2022-2032 (USD Mn, AGR (%), CAGR(%))(V – Shaped Recovery)
Table 159. Asia-Pacific Hospital Bed Market by Country, 2022-2032 (USD Mn, AGR (%), CAGR(%))(W – Shaped Recovery)
Table 160. Asia-Pacific Hospital Bed Market by Country, 2022-2032 (USD Mn, AGR (%), CAGR(%))(U – Shaped Recovery)
Table 161. Asia-Pacific Hospital Bed Market by Country, 2022-2032 (USD Mn, AGR (%), CAGR(%))(L – Shaped Recovery)
Table 162. Asia-Pacific Hospital Bed Market by Application, 2022-2032 (USD Mn, AGR (%), CAGR(%))
Table 163. Asia-Pacific Hospital Bed Market by Application, 2022-2032 (USD Mn, AGR (%), CAGR(%))(V – Shaped Recovery)
Table 164. Asia-Pacific Hospital Bed Market by Application, 2022-2032 (USD Mn, AGR (%), CAGR(%))(W – Shaped Recovery)
Table 165.
Table 166. Asia-Pacific Hospital Bed Market by Application, 2022-2032 (USD Mn, AGR (%), CAGR(%))(U – Shaped Recovery)
Table 167. Asia-Pacific Hospital Bed Market by Application, 2022-2032 (USD Mn, AGR (%), CAGR(%))(L – Shaped Recovery)
Table 168. Asia-Pacific Hospital Bed Market by Type, 2022-2032 (USD Mn, AGR (%), CAGR(%))
Table 169. Asia-Pacific Hospital Bed Market by Type, 2022-2032 (USD Mn, AGR (%), CAGR(%))(V – Shaped Recovery)
Table 170. Asia-Pacific Hospital Bed Market by Type, 2022-2032 (USD Mn, AGR (%), CAGR(%))(W – Shaped Recovery)
Table 171. Asia-Pacific Hospital Bed Market by Type, 2022-2032 (USD Mn, AGR (%), CAGR(%))(U – Shaped Recovery)
Table 172. Asia-Pacific Hospital Bed Market by Type, 2022-2032 (USD Mn, AGR (%), CAGR(%))(L – Shaped Recovery)
Table 173. Asia-Pacific Hospital Bed Market by Hospital Type, 2022-2032 (USD Mn, AGR (%), CAGR(%))
Table 174. Asia-Pacific Hospital Bed Market by Hospital Type, 2022-2032 (USD Mn, AGR (%), CAGR(%))(V – Shaped Recovery)
Table 175. Asia-Pacific Hospital Bed Market by Hospital Type, 2022-2032 (USD Mn, AGR (%), CAGR(%))(W – Shaped Recovery)
Table 176. Asia-Pacific Hospital Bed Market by Hospital Type, 2022-2032 (USD Mn, AGR (%), CAGR(%))(U – Shaped Recovery)
Table 177. Asia-Pacific Hospital Bed Market by Hospital Type, 2022-2032 (USD Mn, AGR (%), CAGR(%))(L – Shaped Recovery)
Table 178. Asia-Pacific Hospital Bed Market by Type of Care, 2022-2032 (USD Mn, AGR (%), CAGR(%))
Table 179. Asia-Pacific Hospital Bed Market by Type of Care, 2022-2032 (USD Mn, AGR (%), CAGR(%))(V – Shaped Recovery)
Table 180. Asia-Pacific Hospital Bed Market by Type of Care, 2022-2032 (USD Mn, AGR (%), CAGR(%))(W – Shaped Recovery)
Table 181. Asia-Pacific Hospital Bed Market by Type of Care, 2022-2032 (USD Mn, AGR (%), CAGR(%))(U – Shaped Recovery)
Table 182.
Table 183. Asia-Pacific Hospital Bed Market by Type of Care, 2022-2032 (USD Mn, AGR (%), CAGR(%))(L – Shaped Recovery)
Table 184. Asia-Pacific Hospital Bed Market by End User, 2022-2032 (USD Mn, AGR (%), CAGR(%))
Table 185. Asia-Pacific Hospital Bed Market by End User, 2022-2032 (USD Mn, AGR (%), CAGR(%))(V – Shaped Recovery)
Table 186. Asia-Pacific Hospital Bed Market by End User, 2022-2032 (USD Mn, AGR (%), CAGR(%))(W – Shaped Recovery)
Table 187. Asia-Pacific Hospital Bed Market by End User, 2022-2032 (USD Mn, AGR (%), CAGR(%))(U – Shaped Recovery)
Table 188. Asia-Pacific Hospital Bed Market by End User, 2022-2032 (USD Mn, AGR (%), CAGR(%))(L – Shaped Recovery)
Table 189. China Hospital Bed Market by Value, 2022-2032 (USD Mn, AGR (%), CAGR(%))
Table 190. China Hospital Bed Market by Value, 2022-2032 (USD Mn, AGR (%), CAGR(%))(V – Shaped Recovery)
Table 191. China Hospital Bed Market by Value, 2022-2032 (USD Mn, AGR (%), CAGR(%))(W – Shaped Recovery)
Table 192. China Hospital Bed Market by Value, 2022-2032 (USD Mn, AGR (%), CAGR(%))(U – Shaped Recovery)
Table 193. China Hospital Bed Market by Value, 2022-2032 (USD Mn, AGR (%), CAGR(%))(L – Shaped Recovery)
Table 194. India Hospital Bed Market by Value, 2022-2032 (USD Mn, AGR (%), CAGR(%))
Table 195. India Hospital Bed Market by Value, 2022-2032 (USD Mn, AGR (%), CAGR(%))(V – Shaped Recovery)
Table 196. India Hospital Bed Market by Value, 2022-2032 (USD Mn, AGR (%), CAGR(%))(W – Shaped Recovery)
Table 197. India Hospital Bed Market by Value, 2022-2032 (USD Mn, AGR (%), CAGR(%))(U – Shaped Recovery)
Table 198. India Hospital Bed Market by Value, 2022-2032 (USD Mn, AGR (%), CAGR(%))(L – Shaped Recovery)
Table 199. Japan Hospital Bed Market by Value, 2022-2032 (USD Mn, AGR (%), CAGR(%))
Table 200. Japan Hospital Bed Market by Value, 2022-2032 (USD Mn, AGR (%), CAGR(%))(V – Shaped Recovery)
2027 and is projected to grow at CAGR of 7.9% in the other half period 2027-2032.
Table 201. Japan Hospital Bed Market by Value, 2022-2032 (USD Mn, AGR (%), CAGR(%))(W – Shaped Recovery)
Table 202. Japan Hospital Bed Market by Value, 2022-2032 (USD Mn, AGR (%), CAGR(%))(U – Shaped Recovery)
Table 203. Japan Hospital Bed Market by Value, 2022-2032 (USD Mn, AGR (%), CAGR(%))(L – Shaped Recovery)
Table 204. South Korea Hospital Bed Market by Value, 2022-2032 (USD Mn, AGR (%), CAGR(%))
Table 205. South Korea Hospital Bed Market by Value, 2022-2032 (USD Mn, AGR (%), CAGR(%))(V – Shaped Recovery)
Table 206. South Korea Hospital Bed Market by Value, 2022-2032 (USD Mn, AGR (%), CAGR(%))(W – Shaped Recovery)
Table 207. South Korea Hospital Bed Market by Value, 2022-2032 (USD Mn, AGR (%), CAGR(%))(U – Shaped Recovery)
Table 208. South Korea Hospital Bed Market by Value, 2022-2032 (USD Mn, AGR (%), CAGR(%))(L – Shaped Recovery)
Table 209. Australia Hospital Bed Market by Value, 2022-2032 (USD Mn, AGR (%), CAGR(%))
Table 210. Australia Hospital Bed Market by Value, 2022-2032 (USD Mn, AGR (%), CAGR(%))(V – Shaped Recovery)
Table 211. Australia Hospital Bed Market by Value, 2022-2032 (USD Mn, AGR (%), CAGR(%))(W – Shaped Recovery)
Table 212. Australia Hospital Bed Market by Value, 2022-2032 (USD Mn, AGR (%), CAGR(%))(U – Shaped Recovery)
Table 213. Australia Hospital Bed Market by Value, 2022-2032 (USD Mn, AGR (%), CAGR(%))(L – Shaped Recovery)
Table 214. Rest of Asia-Pacific Hospital Bed Market by Value, 2022-2032 (USD Mn, AGR (%), CAGR(%))
Table 215. Rest of Asia-Pacific Hospital Bed Market by Value, 2022-2032 (USD Mn, AGR (%), CAGR(%))(V – Shaped Recovery)
Table 216. Rest of Asia-Pacific Hospital Bed Market by Value, 2022-2032 (USD Mn, AGR (%), CAGR(%))(W – Shaped Recovery)
Table 217. Rest of Asia-Pacific Hospital Bed Market by Value, 2022-2032 (USD Mn, AGR (%), CAGR(%))(U – Shaped Recovery)
Table 218. Rest of Asia-Pacific Hospital Bed Market by Value, 2022-2032 (USD Mn, AGR (%), CAGR(%))(L – Shaped Recovery)
Table 219. LAMEA Hospital Bed Market by Value, 2022-2032 (USD Mn, AGR (%), CAGR(%))
Table 220. LAMEA Hospital Bed Market by Value, 2022-2032 (USD Mn, AGR (%), CAGR(%))(V – Shaped Recovery)
Table 221. LAMEA Hospital Bed Market by Value, 2022-2032 (USD Mn, AGR (%), CAGR(%))(W – Shaped Recovery)
Table 222. LAMEA Hospital Bed Market by Value, 2022-2032 (USD Mn, AGR (%), CAGR(%))(U – Shaped Recovery)
Table 223. LAMEA Hospital Bed Market by Value, 2022-2032 (USD Mn, AGR (%), CAGR(%))(L – Shaped Recovery)
Table 224. LAMEA Hospital Bed Market by Country, 2022-2032 (USD Mn, AGR (%), CAGR(%))
Table 225. LAMEA Hospital Bed Market by Country, 2022-2032 (USD Mn, AGR (%), CAGR(%))(V – Shaped Recovery)
Table 226. LAMEA Hospital Bed Market by Country, 2022-2032 (USD Mn, AGR (%), CAGR(%))(W – Shaped Recovery)
Table 227. LAMEA Hospital Bed Market by Country, 2022-2032 (USD Mn, AGR (%), CAGR(%))(U – Shaped Recovery)
Table 228. LAMEA Hospital Bed Market by Country, 2022-2032 (USD Mn, AGR (%), CAGR(%))(L – Shaped Recovery)
Table 229. LAMEA Hospital Bed Market by Application, 2022-2032 (USD Mn, AGR (%), CAGR(%))
Table 230. LAMEA Hospital Bed Market by Application, 2022-2032 (USD Mn, AGR (%), CAGR(%))(V – Shaped Recovery)
Table 231. LAMEA Hospital Bed Market by Application, 2022-2032 (USD Mn, AGR (%), CAGR(%))(W – Shaped Recovery)
Table 232. LAMEA Hospital Bed Market by Application, 2022-2032 (USD Mn, AGR (%), CAGR(%))(U – Shaped Recovery)
Table 233. LAMEA Hospital Bed Market by Application, 2022-2032 (USD Mn, AGR (%), CAGR(%))(L – Shaped Recovery)
Table 234. LAMEA Hospital Bed Market by Type, 2022-2032 (USD Mn, AGR (%), CAGR(%))
Table 235. LAMEA Hospital Bed Market by Type, 2022-2032 (USD Mn, AGR (%), CAGR(%))(V – Shaped Recovery)
Table 236. LAMEA Hospital Bed Market by Type, 2022-2032 (USD Mn, AGR (%), CAGR(%))(W – Shaped Recovery)
Table 237. LAMEA Hospital Bed Market by Type, 2022-2032 (USD Mn, AGR (%), CAGR(%))(U – Shaped Recovery)
Table 238. LAMEA Hospital Bed Market by Type, 2022-2032 (USD Mn, AGR (%), CAGR(%))(L – Shaped Recovery)
Table 239. LAMEA Hospital Bed Market by Hospital Type, 2022-2032 (USD Mn, AGR (%), CAGR(%))
Table 240. LAMEA Hospital Bed Market by Hospital Type, 2022-2032 (USD Mn, AGR (%), CAGR(%))(V – Shaped Recovery)
Table 241. LAMEA Hospital Bed Market by Hospital Type, 2022-2032 (USD Mn, AGR (%), CAGR(%))(W – Shaped Recovery)
Table 242. LAMEA Hospital Bed Market by Hospital Type, 2022-2032 (USD Mn, AGR (%), CAGR(%))(U – Shaped Recovery)
Table 243. LAMEA Hospital Bed Market by Hospital Type, 2022-2032 (USD Mn, AGR (%), CAGR(%))(L – Shaped Recovery)
Table 244. LAMEA Hospital Bed Market by Type of Care, 2022-2032 (USD Mn, AGR (%), CAGR(%))
Table 245. LAMEA Hospital Bed Market by Type of Care, 2022-2032 (USD Mn, AGR (%), CAGR(%))(V – Shaped Recovery)
Table 246. LAMEA Hospital Bed Market by Type of Care, 2022-2032 (USD Mn, AGR (%), CAGR(%))(%)) (W – Shaped Recovery)
Table 247. LAMEA Hospital Bed Market by Type of Care, 2022-2032 (USD Mn, AGR (%), CAGR(%))(U – Shaped Recovery)
Table 248. LAMEA Hospital Bed Market by Type of Care, 2022-2032 (USD Mn, AGR (%), CAGR(%))(L – Shaped Recovery)
Table 249. LAMEA Hospital Bed Market by End User, 2022-2032 (USD Mn, AGR (%), CAGR(%))
Table 250. LAMEA Hospital Bed Market by End User, 2022-2032 (USD Mn, AGR (%), CAGR(%))(V – Shaped Recovery)
Table 251. LAMEA Hospital Bed Market by End User, 2022-2032 (USD Mn, AGR (%), CAGR(%))(W – Shaped Recovery)
Table 252. LAMEA Hospital Bed Market by End User, 2022-2032 (USD Mn, AGR (%), CAGR(%))(U – Shaped Recovery)
Table 253. LAMEA Hospital Bed Market by End User, 2022-2032 (USD Mn, AGR (%), CAGR(%))(L – Shaped Recovery)
Table 254. Brazil Hospital Bed Market by Value, 2022-2032 (USD Mn, AGR (%), CAGR(%))
Table 255. Brazil Hospital Bed Market by Value, 2022-2032 (USD Mn, AGR (%), CAGR(%))(V – Shaped Recovery)
Table 256. Brazil Hospital Bed Market by Value, 2022-2032 (USD Mn, AGR (%), CAGR(%))(W – Shaped Recovery)
Table 257. Brazil Hospital Bed Market by Value, 2022-2032 (USD Mn, AGR (%), CAGR(%))(U – Shaped Recovery)
Table 258. Brazil Hospital Bed Market by Value, 2022-2032 (USD Mn, AGR (%), CAGR(%))(L – Shaped Recovery)
Table 259. South Africa Hospital Bed Market by Value, 2022-2032 (USD Mn, AGR (%), CAGR(%))
Table 260. South Africa Hospital Bed Market by Value, 2022-2032 (USD Mn, AGR (%), CAGR(%))(V – Shaped Recovery)
Table 261. South Africa Hospital Bed Market by Value, 2022-2032 (USD Mn, AGR (%), CAGR(%))(W – Shaped Recovery)
Table 262. South Africa Hospital Bed Market by Value, 2022-2032 (USD Mn, AGR (%), CAGR(%))(U – Shaped Recovery)
Table 263. South Africa Hospital Bed Market by Value, 2022-2032 (USD Mn, AGR (%), CAGR(%))(L – Shaped Recovery)
Table 264. Saudi Arabia Hospital Bed Market by Value, 2022-2032 (USD Mn, AGR (%), CAGR(%))
Table 265. Saudi Arabia Hospital Bed Market by Value, 2022-2032 (USD Mn, AGR (%), CAGR(%))(V – Shaped Recovery)
Table 266. Saudi Arabia Hospital Bed Market by Value, 2022-2032 (USD Mn, AGR (%), CAGR(%))(W – Shaped Recovery)
Table 267. Saudi Arabia Hospital Bed Market by Value, 2022-2032 (USD Mn, AGR (%), CAGR(%))(U – Shaped Recovery)
Table 268. Saudi Arabia Hospital Bed Market by Value, 2022-2032 (USD Mn, AGR (%), CAGR(%))(L – Shaped Recovery)
Table 269. Turkey Hospital Bed Market by Value, 2022-2032 (USD Mn, AGR (%), CAGR(%))
Table 270. Turkey Hospital Bed Market by Value, 2022-2032 (USD Mn, AGR (%), CAGR(%))(V – Shaped Recovery)
Table 271. Turkey Hospital Bed Market by Value, 2022-2032 (USD Mn, AGR (%), CAGR(%))(W – Shaped Recovery)
Table 272. Turkey Hospital Bed Market by Value, 2022-2032 (USD Mn, AGR (%), CAGR(%))(U – Shaped Recovery)
Table 273. Turkey Hospital Bed Market by Value, 2022-2032 (USD Mn, AGR (%), CAGR(%))(L – Shaped Recovery)
Table 274. UAE Hospital Bed Market by Value, 2022-2032 (USD Mn, AGR (%), CAGR(%))
Table 275. UAE Hospital Bed Market by Value, 2022-2032 (USD Mn, AGR (%), CAGR(%))(V – Shaped Recovery)
Table 276. UAE Hospital Bed Market by Value, 2022-2032 (USD Mn, AGR (%), CAGR(%))(W – Shaped Recovery)
Table 277. UAE Hospital Bed Market by Value, 2022-2032 (USD Mn, AGR (%), CAGR(%))(U – Shaped Recovery)
Table 278. UAE Hospital Bed Market by Value, 2022-2032 (USD Mn, AGR (%), CAGR(%))(L – Shaped Recovery)
Table 279. Rest of LAMEA Hospital Bed Market by Value, 2022-2032 (USD Mn, AGR (%), CAGR(%))
Table 280. Rest of LAMEA Hospital Bed Market by Value, 2022-2032 (USD Mn, AGR (%), CAGR(%))(V – Shaped Recovery)
Table 281. Rest of LAMEA Hospital Bed Market by Value, 2022-2032 (USD Mn, AGR (%), CAGR(%))(W – Shaped Recovery)
Table 282. Rest of LAMEA Hospital Bed Market by Value, 2022-2032 (USD Mn, AGR (%), CAGR(%))(U – Shaped Recovery)
Table 283. Rest of LAMEA Hospital Bed Market by Value, 2022-2032 (USD Mn, AGR (%), CAGR(%))(L – Shaped Recovery)
Table 284. GF Health Products: Company Information
Table 285. GF Health Products: Company Revenue 2016-2020 (US$Mn, AGR %)
Table 286. GF Health Products: Company Product and Service Benchmarking
Table 287. GF Health Products: Company Recent Developments till Feb,2021
Table 288. Getinge AB : Company Information
Table 289. Getinge AB: Company Revenue 2016-2020 (US$Mn, AGR %)
Table 290. Getinge AB: Company Product and Service Benchmarking
Table 291. Getinge AB: Company Recent Developments till Feb,2021
Table 292. Hillrom Holdings Inc. : Company Information
Table 293. Hillrom Holdings Inc.: Company Revenue 2016-2020 (US$Mn, AGR %)
Table 294. Hillrom Holdings Inc.: Company Product and Service Benchmarking
Table 295. Hillrom Holdings Inc.: Company Recent Developments till Feb,2021
Table 296. Invacare Corporation: Company Information
Table 297. Invacare Corporation: Company Revenue 2016-2020 (US$Mn, AGR %)
Table 298. Invacare Corporation: Company Product and Service Benchmarking
Table 299. Malvestio S.P.A : Company Information
Table 300. Malvestio S.P.A: Company Product and Service Benchmarking
Table 301. Stryker Corporation: Company Information*
Table 302. Stryker Corporation: Company Revenue 2016-2020 (US$Mn, AGR %)
Table 303. Stryker Corporation: Company Product and Service Benchmarking
Table 304. Stryker Corporation: Company Recent Developments till Feb,2021
Table 305. Savaria Corporation: Company Information
Table 306. Savaria Corporation: Company Revenue 2016-2020 (US$Mn, AGR %)
Table 307. Savaria Corporation: Company Product and Service Benchmarking
Table 308. Savaria Corporation: Company Recent Developments till Feb,2021
Table 309. Antano Group: Company Information
Table 310. Antano Group: Company Product and Service Benchmarking
Table 311. Savion Industries : Company Information
Table 312. Savion Industries: Company Product and Service Benchmarking
Table 313. Stiegelmeyer GmbH & Co. : Company Information
Table 314. Stiegelmeyer GmbH & Co. : Company Product and Service Benchmarking
Table 315. Amico Corporation: Company Information
Table 316. Amico Corporation: Company Product and Service Benchmarking
Table 317. Medline Industries: Company Information
Table 318. Medline Industries: Company Product and Service Benchmarking
Table 319. Medline Industries: Company Recent Developments till Feb,2021
Table 320. LINET Spol S.R.O: Company Information
Table 321. LINET Spol S.R.O : Company Product and Service Benchmarking
Table 322. LINET Spol S.R.O: Company Recent Developments till Feb,2021
Table 323. Merivaara Corporation: Company Information
Table 324. Merivaara Corporation: Company Product and Service Benchmarking
Table 325. Merivaara Corporation: Company Recent Developments till Feb,2021
Table 326. Paramount Bed Holdings Co. Ltd: Company Information
Table 327. Paramount Bed Holdings Co. Ltd: Company Revenue 2016-2020 (US$Mn, AGR %)
Table 328. Paramount Bed Holdings Co. Ltd: Company Product and Service Benchmarking
Table 329. Paramount Bed Holdings Co. Ltd: Company Recent Developments till Feb,2021
Table 330. Midmark Corporation: Company Information
Table 331. Midmark Corporation: Company Product and Service Benchmarking
Table 332. Famed Zyweic Sp Zo. O: Company Information
Table 333. Famed Zyweic Sp Zo. O: Company Product and Service Benchmarking
Table 334. Gendron Inc. : Company Information
Table 335. Gendron Inc. : Company Product and Service Benchmarking
Table 336. Hard Manufacturing Co, Inc. : Company Information
Table 337. Hard Manufacturing Co, Inc. : Company Product and Service Benchmarking
Table 338. Umano Medical Inc. : Company Information
Table 339. Umano Medical Inc. : Company Product and Service Benchmarking
List of Figures
Figure 1. Global Hospital Bed Market Segmentation
Figure 2. SWOT Analysis
Figure 3. Global Hospital Bed Market by Value, 2022-2032 (USD Mn, AGR (%))
Figure 4. Global Hospital Bed Market by Value, 2022-2032 (USD Mn, AGR (%)) (V – Shaped Recovery)
Figure 5. Global Hospital Bed Market by Value, 2022-2032 (USD Mn, AGR (%)) (W – Shaped Recovery)
Figure 6. Global Hospital Bed Market by Value, 2022-2032 (USD Mn, AGR (%)) (U – Shaped Recovery)
Figure 7. Global Hospital Bed Market by Value, 2022-2032 (USD Mn, AGR (%)) (L – Shaped Recovery)
Figure 8. Global Hospital Bed Market by Region, 2022-2032 (USD Mn, AGR (%))
Figure 9. Global Hospital Bed Market by Region, 2022-2032 (USD Mn, AGR (%), ) (V – Shaped Recovery)
Figure 10. Global Hospital Bed Market by Region, 2022-2032 (USD Mn, AGR (%), ) (W – Shaped Recovery)
Figure 11. Global Hospital Bed Market by Region, 2022-2032 (USD Mn, AGR (%), ) (U – Shaped Recovery)
Figure 12. Global Hospital Bed Market by Region, 2022-2032 (USD Mn, AGR (%), ) (L – Shaped Recovery)
Figure 13. Global Hospital Bed Market by Application, 2022-2032 (USD Mn, AGR (%))
Figure 14. Global Hospital Bed Market by Application, 2022-2032 (USD Mn, AGR (%)) (V – Shaped Recovery)
Figure 15. Global Hospital Bed Market by Application, 2022-2032 (USD Mn, AGR (%)) (W – Shaped Recovery)
Figure 16. Global Hospital Bed Market by Application, 2022-2032 (USD Mn, AGR (%)) (U – Shaped Recovery)
Figure 17. Global Hospital Bed Market by Application, 2022-2032 (USD Mn, AGR (%)) (L – Shaped Recovery)
Figure 18. Global Hospital Bed Market Type, 2022-2032 (USD Mn, AGR (%)) (L – Shaped Recovery)
Figure 19. Global Hospital Bed Market Type, 2022-2032 (USD Mn, AGR (%)) (V – Shaped Recovery)
Figure 20. Global Hospital Bed Market Type, 2022-2032 (USD Mn, AGR (%)) (W – Shaped Recovery)
Figure 21. Global Hospital Bed Market Type, 2022-2032 (USD Mn, AGR (%)) (U – Shaped Recovery)
Figure 22. Global Hospital Bed Market Type, 2022-2032 (USD Mn, AGR (%)) (L – Shaped Recovery)
Figure 23. Global Hospital Bed Market Hospital Type, 2022-2032 (USD Mn, AGR (%))
Figure 24. Global Hospital Bed Market Hospital Type, 2022-2032 (USD Mn, AGR (%)) (V – Shaped Recovery)
Figure 25. Global Hospital Bed Market Hospital Type, 2022-2032 (USD Mn, AGR (%)) (W – Shaped Recovery)
Figure 26. Global Hospital Bed Market Hospital Type, 2022-2032 (USD Mn, AGR (%)) (U – Shaped Recovery)
Figure 27. Global Hospital Bed Market Hospital Type, 2022-2032 (USD Mn, AGR (%)) (L – Shaped Recovery)
Figure 28. Global Hospital Bed Market Type of Care, 2022-2032 (USD Mn, AGR (%))
Figure 29. Global Hospital Bed Market Type of Care, 2022-2032 (USD Mn, AGR (%)) (V – Shaped Recovery)
Figure 30. Global Hospital Bed Market Type of Care, 2022-2032 (USD Mn, AGR (%)) (W – Shaped Recovery)
Figure 31. Global Hospital Bed Market Type of Care, 2022-2032 (USD Mn, AGR (%)) (U – Shaped Recovery)
Figure 32. Global Hospital Bed Market Type of Care, 2022-2032 (USD Mn, AGR (%)) (L – Shaped Recovery)
Figure 33. Global Hospital Bed Market End User, 2022-2032 (USD Mn, AGR (%))
Figure 34. Global Hospital Bed Market End User, 2022-2032 (USD Mn, AGR (%)) (V – Shaped Recovery)
Figure 35. Global Hospital Bed Market End User, 2022-2032 (USD Mn, AGR (%)) (W – Shaped Recovery)
Figure 36. Global Hospital Bed Market End User, 2022-2032 (USD Mn, AGR (%)) (U – Shaped Recovery)
Figure 37. Global Hospital Bed Market End User, 2022-2032 (USD Mn, AGR (%)) (L – Shaped Recovery)
Figure 38. North America Hospital Bed Market by Value, 2022-2032 (USD Mn, AGR (%))
Figure 39. North America Hospital Bed Market by Value, 2022-2032 (USD Mn, AGR (%)) (V – Shaped Recovery)
Figure 40. North America Hospital Bed Market by Value, 2022-2032 (USD Mn, AGR (%)) (W – Shaped Recovery)
Figure 41. North America Hospital Bed Market by Value, 2022-2032 (USD Mn, AGR (%)) (U – Shaped Recovery)
Figure 42. North America Hospital Bed Market by Value, 2022-2032 (USD Mn, AGR (%)) (L – Shaped Recovery)
Figure 43. North America Hospital Bed Market by Country, 2022-2032 (USD Mn, AGR (%))
Figure 44. North America Hospital Bed Market by Country, 2022-2032 (USD Mn, AGR (%)) (V – Shaped Recovery)
Figure 45. North America Hospital Bed Market by Country, 2022-2032 (USD Mn, AGR (%)) (W – Shaped Recovery)
Figure 46. North America Hospital Bed Market by Country, 2022-2032 (USD Mn, AGR (%)) (U – Shaped Recovery)
Figure 47. North America Hospital Bed Market by Country, 2022-2032 (USD Mn, AGR (%)) (L – Shaped Recovery)
Figure 48. North America Hospital Bed Market by Application, 2022-2032 (USD Mn, AGR (%))
Figure 49. North America Hospital Bed Market by Application, 2022-2032 (USD Mn, AGR (%)) (V – Shaped Recovery)
Figure 50. North America Hospital Bed Market by Application, 2022-2032 (USD Mn, AGR (%)) (W – Shaped Recovery)
Figure 51. North America Hospital Bed Market by Application, 2022-2032 (USD Mn, AGR (%)) (U – Shaped Recovery)
Figure 52. North America Hospital Bed Market by Application, 2022-2032 (USD Mn, AGR (%)) (L – Shaped Recovery)
Figure 53. North America Hospital Bed Market Type, 2022-2032 (USD Mn, AGR (%)) (L – Shaped Recovery)
Figure 54. North America Hospital Bed Market Type, 2022-2032 (USD Mn, AGR (%)) (V – Shaped Recovery)
Figure 55. North America Hospital Bed Market Type, 2022-2032 (USD Mn, AGR (%)) (W – Shaped Recovery)
Figure 56. North America Hospital Bed Market Type, 2022-2032 (USD Mn, AGR (%)) (U – Shaped Recovery)
Figure 57. North America Hospital Bed Market Type, 2022-2032 (USD Mn, AGR (%)) (L – Shaped Recovery)
Figure 58. North America Hospital Bed Market Hospital Type, 2022-2032 (USD Mn, AGR (%))
Figure 59. North America Hospital Bed Market Hospital Type, 2022-2032 (USD Mn, AGR (%)) (V – Shaped Recovery)
Figure 60. North America Hospital Bed Market Hospital Type, 2022-2032 (USD Mn, AGR (%)) (W – Shaped Recovery)
Figure 61. North America Hospital Bed Market Hospital Type, 2022-2032 (USD Mn, AGR (%)) (U – Shaped Recovery)
Figure 62. North America Hospital Bed Market Hospital Type, 2022-2032 (USD Mn, AGR (%)) (L – Shaped Recovery)
Figure 63. North America Hospital Bed Market Type of Care, 2022-2032 (USD Mn, AGR (%))
Figure 64. North America Hospital Bed Market Type of Care, 2022-2032 (USD Mn, AGR (%)) (V – Shaped Recovery)
Figure 65. North America Hospital Bed Market Type of Care, 2022-2032 (USD Mn, AGR (%)) (W – Shaped Recovery)
Figure 66. North America Hospital Bed Market Type of Care, 2022-2032 (USD Mn, AGR (%)) (U – Shaped Recovery)
Figure 67. North America Hospital Bed Market Type of Care, 2022-2032 (USD Mn, AGR (%)) (L – Shaped Recovery)
Figure 68. North America Hospital Bed Market End User, 2022-2032 (USD Mn, AGR (%))
Figure 69. North America Hospital Bed Market End User. 2022-2032 (USD Mn, AGR (%)) (V – Shaped Recovery)
Figure 70. North America Hospital Bed Market End User, 2022-2032 (USD Mn, AGR (%)) (W – Shaped Recovery)
Figure 71. North America Hospital Bed Market End User, 2022-2032 (USD Mn, AGR (%)) (U – Shaped Recovery)
Figure 72. North America Hospital Bed Market End User, 2022-2032 (USD Mn, AGR (%)) (L – Shaped Recovery)
Figure 73. North America Hospital Bed Market by Value, 2022-2032 (USD Mn, AGR (%))
Figure 74. US Hospital Bed Market by Value, 2022-2032 (USD Mn, AGR (%)) (V – Shaped Recovery)
Figure 75. US Hospital Bed Market by Value, 2022-2032 (USD Mn, AGR (%)) (W – Shaped Recovery)
Figure 76. US Hospital Bed Market by Value, 2022-2032 (USD Mn, AGR (%)) (U – Shaped Recovery)
Figure 77. US Hospital Bed Market by Value, 2022-2032 (USD Mn, AGR (%)) (L – Shaped Recovery)
Figure 78. Canada Hospital Bed Market by Value, 2022-2032 (USD Mn, AGR (%))
Figure 79. Canada Hospital Bed Market by Value, 2022-2032 (USD Mn, AGR (%)) (V – Shaped Recovery)
Figure 80. Canada Hospital Bed Market by Value, 2022-2032 (USD Mn, AGR (%)) (W – Shaped Recovery)
Figure 81. Canada Hospital Bed Market by Value, 2022-2032 (USD Mn, AGR (%)) (U – Shaped Recovery)
Figure 82. Canada Hospital Bed Market by Value, 2022-2032 (USD Mn, AGR (%)) (L – Shaped Recovery)
Figure 83. Mexico Hospital Bed Market by Value, 2022-2032 (USD Mn, AGR (%))
Figure 84. Mexico Hospital Bed Market by Value, 2022-2032 (USD Mn, AGR (%)) (V – Shaped Recovery)
Figure 85. Mexico Hospital Bed Market by Value, 2022-2032 (USD Mn, AGR (%)) (W – Shaped Recovery)
Figure 86. Mexico Hospital Bed Market by Value, 2022-2032 (USD Mn, AGR (%)) (U – Shaped Recovery)
Figure 87. Mexico Hospital Bed Market by Value, 2022-2032 (USD Mn, AGR (%)) (L – Shaped Recovery)
Figure 88. Europe Hospital Bed Market by Value, 2022-2032 (USD Mn, AGR (%))
Figure 89. Europe Hospital Bed Market by Value, 2022-2032 (USD Mn, AGR (%)) (V – Shaped Recovery)
Figure 90. Europe Hospital Bed Market by Value, 2022-2032 (USD Mn, AGR (%)) (W – Shaped Recovery)
Figure 91. Europe Hospital Bed Market by Value, 2022-2032 (USD Mn, AGR (%)) (U – Shaped Recovery)
Figure 92. Europe Hospital Bed Market by Value, 2022-2032 (USD Mn, AGR (%)) (L – Shaped Recovery)
Figure 93. Europe Hospital Bed Market by Country, 2022-2032 (USD Mn, AGR (%))
Figure 94. Europe Hospital Bed Market by Country, 2022-2032 (USD Mn, AGR (%)) (V – Shaped Recovery)
Figure 95. Europe Hospital Bed Market by Country, 2022-2032 (USD Mn, AGR (%)) (W – Shaped Recovery)
Figure 96. Europe Hospital Bed Market by Country, 2022-2032 (USD Mn, AGR (%)) (U – Shaped Recovery)
Figure 97. Europe Hospital Bed Market by Country, 2022-2032 (USD Mn, AGR (%)) (L – Shaped Recovery)
Figure 98. Europe Hospital Bed Market by Application, 2022-2032 (USD Mn, AGR (%))
Figure 99. Europe Hospital Bed Market by Application, 2022-2032 (USD Mn, AGR (%)) (V – Shaped Recovery)
Figure 100. Europe Hospital Bed Market by Application, 2022-2032 (USD Mn, AGR (%)) (W – Shaped Recovery)
Figure 101. Europe Hospital Bed Market by Application, 2022-2032 (USD Mn, AGR (%)) (U – Shaped Recovery)
Figure 102. Europe Hospital Bed Market by Application, 2022-2032 (USD Mn, AGR (%)) (L – Shaped Recovery)
Figure 103. Europe Hospital Bed Market Type, 2022-2032 (USD Mn, AGR (%)) (L – Shaped Recovery)
Figure 104. Europe Hospital Bed Market Type, 2022-2032 (USD Mn, AGR (%)) (V – Shaped Recovery)
Figure 105. Europe Hospital Bed Market Type, 2022-2032 (USD Mn, AGR (%)) (W – Shaped Recovery)
Figure 106. Europe Hospital Bed Market Type, 2022-2032 (USD Mn, AGR (%)) (U – Shaped Recovery)
Figure 107. Europe Hospital Bed Market Type, 2022-2032 (USD Mn, AGR (%)) (L – Shaped Recovery)
Figure 108. Europe Hospital Bed Market Hospital Type, 2022-2032 (USD Mn, AGR (%))
Figure 109. Europe Hospital Bed Market Hospital Type, 2022-2032 (USD Mn, AGR (%)) (V – Shaped Recovery)
Figure 110. Europe Hospital Bed Market Hospital Type, 2022-2032 (USD Mn, AGR (%)) (W – Shaped Recovery)
Figure 111. Europe Hospital Bed Market Hospital Type, 2022-2032 (USD Mn, AGR (%)) (U – Shaped Recovery)
Figure 112. Europe Hospital Bed Market Hospital Type, 2022-2032 (USD Mn, AGR (%)) (L – Shaped Recovery)
Figure 113. Europe Hospital Bed Market Type of Care, 2022-2032 (USD Mn, AGR (%))
Figure 114. Europe Hospital Bed Market Type of Care, 2022-2032 (USD Mn, AGR (%)) (V – Shaped Recovery)
Figure 115. Europe Hospital Bed Market Type of Care, 2022-2032 (USD Mn, AGR (%)) (W – Shaped Recovery)
Figure 116. Europe Hospital Bed Market Type of Care, 2022-2032 (USD Mn, AGR (%)) (U – Shaped Recovery)
Figure 117. Europe Hospital Bed Market Type of Care, 2022-2032 (USD Mn, AGR (%)) (L – Shaped Recovery)
Figure 118. Europe Hospital Bed Market by End User, 2022-2032 (USD Mn, AGR (%))
Figure 119. Europe Hospital Bed Market by End User, 2022-2032 (USD Mn, AGR (%)) (V – Shaped Recovery)
Figure 120. Europe Hospital Bed Market by End User, 2022-2032 (USD Mn, AGR (%)) (W – Shaped Recovery)
Figure 121. Europe Hospital Bed Market by End User, 2022-2032 (USD Mn, AGR (%)) (U – Shaped Recovery)
Figure 122. Europe Hospital Bed Market by End User, 2022-2032 (USD Mn, AGR (%)) (L – Shaped Recovery)
Figure 123. Germany Hospital Bed Market by Value, 2022-2032 (USD Mn, AGR (%), CAGR (%))
Figure 124. Germany Hospital Bed Market by Value, 2022-2032 (USD Mn, AGR (%), CAGR (%)) (V – Shaped Recovery)
Figure 125. Germany Hospital Bed Market by Value, 2022-2032 (USD Mn, AGR (%), CAGR (%)) (W – Shaped Recovery)
Figure 126. Germany Hospital Bed Market by Value, 2022-2032 (USD Mn, AGR (%), CAGR (%)) (U – Shaped Recovery)
Figure 127. Germany Hospital Bed Market by Value, 2022-2032 (USD Mn, AGR (%), CAGR (%)) (L – Shaped Recovery)
Figure 128. UK Hospital Bed Market by Value, 2022-2032 (USD Mn, AGR (%))
Figure 129. UK Hospital Bed Market by Value, 2022-2032 (USD Mn, AGR (%)) (V – Shaped Recovery)
Figure 130. UK Hospital Bed Market by Value, 2022-2032 (USD Mn, AGR (%)) (W – Shaped Recovery)
Figure 131. UK Hospital Bed Market by Value, 2022-2032 (USD Mn, AGR (%)) (U – Shaped Recovery)
Figure 132. UK Hospital Bed Market by Value, 2022-2032 (USD Mn, AGR (%)) (L – Shaped Recovery)
Figure 133. France Hospital Bed Market by Value, 2022-2032 (USD Mn, AGR (%))
Figure 134. France Hospital Bed Market by Value, 2022-2032 (USD Mn, AGR (%)) (V – Shaped Recovery)
Figure 135. France Hospital Bed Market by Value, 2022-2032 (USD Mn, AGR (%)) (W – Shaped Recovery)
Figure 136. France Hospital Bed Market by Value, 2022-2032 (USD Mn, AGR (%)) (U – Shaped Recovery)
Figure 137. France Hospital Bed Market by Value, 2022-2032 (USD Mn, AGR (%)) (L – Shaped Recovery)
Figure 138. Italy Hospital Bed Market by Value, 2022-2032 (USD Mn, AGR (%))
Figure 139. Italy Hospital Bed Market by Value, 2022-2032 (USD Mn, AGR (%)) (V – Shaped Recovery)
Figure 140. Italy Hospital Bed Market by Value, 2022-2032 (USD Mn, AGR (%)) (W – Shaped Recovery)
Figure 141. Italy Hospital Bed Market by Value, 2022-2032 (USD Mn, AGR (%)) (U – Shaped Recovery)
Figure 142. Italy Hospital Bed Market by Value, 2022-2032 (USD Mn, AGR (%)) (L – Shaped Recovery)
Figure 143. Spain Hospital Bed Market by Value, 2022-2032 (USD Mn, AGR (%))
Figure 144. Spain Hospital Bed Market by Value, 2022-2032 (USD Mn, AGR (%)) (V – Shaped Recovery)
Figure 145. Spain Hospital Bed Market by Value, 2022-2032 (USD Mn, AGR (%)) (W – Shaped Recovery)
Figure 146. Spain Hospital Bed Market by Value, 2022-2032 (USD Mn, AGR (%)) (U – Shaped Recovery)
Figure 147. Spain Hospital Bed Market by Value, 2022-2032 (USD Mn, AGR (%)) (L – Shaped Recovery)
Figure 148. Rest of Europe Hospital Bed Market by Value, 2022-2032 (USD Mn, AGR (%))
Figure 149. Rest of Europe Hospital Bed Market by Value, 2022-2032 (USD Mn, AGR (%)) (V – Shaped Recovery)
Figure 150. Rest of Europe Hospital Bed Market by Value, 2022-2032 (USD Mn, AGR (%)) (W – Shaped Recovery)
Figure 151. Rest of Europe Hospital Bed Market by Value, 2022-2032 (USD Mn, AGR (%)) (U – Shaped Recovery)
Figure 152. Rest of Europe Hospital Bed Market by Value, 2022-2032 (USD Mn, AGR (%), CAGR (%)) (L – Shaped Recovery)
Figure 153. Asia-Pacific Hospital Bed Market by Value, 2022-2032 (USD Mn, AGR (%))(V – Shaped Recovery)
Figure 154. Asia-Pacific Hospital Bed Market by Value, 2022-2032 (USD Mn, AGR (%)) (V – Shaped Recovery)
Figure 155. Asia-Pacific Hospital Bed Market by Value, 2022-2032 (USD Mn, AGR (%)) (W – Shaped Recovery)
Figure 156. Asia-Pacific Hospital Bed Market by Value, 2022-2032 (USD Mn, AGR (%)) (U – Shaped Recovery)
Figure 157. Asia-Pacific Hospital Bed Market by Value, 2022-2032 (USD Mn, AGR (%)) (L – Shaped Recovery)
Figure 158. Asia-Pacific Hospital Bed Market by Country, 2022-2032 (USD Mn, AGR (%))
Figure 159. Asia-Pacific Hospital Bed Market by Country, 2022-2032 (USD Mn, AGR (%), CAGR(%)) (V – Shaped Recovery)
Figure 160. Asia-Pacific Hospital Bed Market by Country, 2022-2032 (USD Mn, AGR (%), CAGR(%)) (W – Shaped Recovery)
Figure 161. Asia-Pacific Hospital Bed Market by Country, 2022-2032 (USD Mn, AGR (%), CAGR(%)) (U – Shaped Recovery)
Figure 162. Asia-Pacific Hospital Bed Market by Country, 2022-2032 (USD Mn, AGR (%), CAGR(%)) (L – Shaped Recovery)
Figure 163. Asia-Pacific Hospital Bed Market by Application, 2022-2032 (USD Mn, AGR (%))
Figure 164. Asia-Pacific Hospital Bed Market by Application, 2022-2032 (USD Mn, AGR (%)) (V – Shaped Recovery)
Figure 165. Asia-Pacific Hospital Bed Market by Application, 2022-2032 (USD Mn, AGR (%)) (W – Shaped Recovery)
Figure 166. Asia-Pacific Hospital Bed Market by Application, 2022-2032 (USD Mn, AGR (%)) (U – Shaped Recovery)
Figure 167. Asia-Pacific Hospital Bed Market by Application, 2022-2032 (USD Mn, AGR (%)) (L – Shaped Recovery)
Figure 168. Asia-Pacific Hospital Bed Market Type, 2022-2032 (USD Mn, AGR (%)) (L – Shaped Recovery)
Figure 169. Asia-Pacific Hospital Bed Market Type, 2022-2032 (USD Mn, AGR (%)) (V – Shaped Recovery)
Figure 170. Asia-Pacific Hospital Bed Market Type, 2022-2032 (USD Mn, AGR (%)) (W – Shaped Recovery)
Figure 171. Asia-Pacific Hospital Bed Market Type, 2022-2032 (USD Mn, AGR (%)) (U – Shaped Recovery)
Figure 172. Asia-Pacific Hospital Bed Market Type, 2022-2032 (USD Mn, AGR (%)) (L – Shaped Recovery)
Figure 173. Asia-Pacific Hospital Bed Market Hospital Type, 2022-2032 (USD Mn, AGR (%))
Figure 174. Asia-Pacific Hospital Bed Market Hospital Type, 2022-2032 (USD Mn, AGR (%)) (V – Shaped Recovery)
Figure 175. Asia-Pacific Hospital Bed Market Hospital Type, 2022-2032 (USD Mn, AGR (%)) (W – Shaped Recovery)
Figure 176. Asia-Pacific Hospital Bed Market Hospital Type, 2022-2032 (USD Mn, AGR (%)) (U – Shaped Recovery)
Figure 177. Asia-Pacific Hospital Bed Market Hospital Type, 2022-2032 (USD Mn, AGR (%)) (L – Shaped Recovery)
Figure 178. Asia-Pacific Hospital Bed Market Type of Care, 2022-2032 (USD Mn, AGR (%))
Figure 179. Asia-Pacific Hospital Bed Market Type of Care, 2022-2032 (USD Mn, AGR (%)) (V – Shaped Recovery)
Figure 180. Asia-Pacific Hospital Bed Market Type of Care, 2022-2032 (USD Mn, AGR (%)) (W – Shaped Recovery)
Figure 181. Asia-Pacific Hospital Bed Market Type of Care, 2022-2032 (USD Mn, AGR (%)) (U – Shaped Recovery)
Figure 182. Asia-Pacific Hospital Bed Market Type of Care, 2022-2032 (USD Mn, AGR (%)) (L – Shaped Recovery)
Figure 183. Asia-Pacific Hospital Bed Market End User, 2022-2032 (USD Mn, AGR (%))
Figure 184. Asia-Pacific Hospital Bed Market End User, 2022-2032 (USD Mn, AGR (%)) (V – Shaped Recovery)
Figure 185. Asia-Pacific Hospital Bed Market End User, 2022-2032 (USD Mn, AGR (%)) (W – Shaped Recovery)
Figure 186. Asia-Pacific Hospital Bed Market End User, 2022-2032 (USD Mn, AGR (%)) (U – Shaped Recovery)
Figure 187. Asia-Pacific Hospital Bed Market End User, 2022-2032 (USD Mn, AGR (%)) (L – Shaped Recovery)
Figure 188. China Asia-Pacific Hospital Bed Market by Value, 2022-2032 (USD Mn, AGR (%))
Figure 189. China Hospital Bed Market by Value, 2022-2032 (USD Mn, AGR (%)) (V – Shaped Recovery)
Figure 190. China Hospital Bed Market by Value, 2022-2032 (USD Mn, AGR (%)) (W – Shaped Recovery)
Figure 191. China Hospital Bed Market by Value, 2022-2032 (USD Mn, AGR (%)) (U – Shaped Recovery)
Figure 192. China Hospital Bed Market by Value, 2022-2032 (USD Mn, AGR (%)) (L – Shaped Recovery)
Figure 193. India Asia-Pacific Hospital Bed Market by Value, 2022-2032 (USD Mn, AGR (%))
Figure 194. India Hospital Bed Market by Value, 2022-2032 (USD Mn, AGR (%)) (V – Shaped Recovery)
Figure 195. India Hospital Bed Market by Value, 2022-2032 (USD Mn, AGR (%)) (W – Shaped Recovery)
Figure 196. India Hospital Bed Market by Value, 2022-2032 (USD Mn, AGR (%)) (U – Shaped Recovery)
Figure 197. India Hospital Bed Market by Value, 2022-2032 (USD Mn, AGR (%)) (L – Shaped Recovery)
Figure 198. Japan Hospital Bed Market by Value, 2022-2032 (USD Mn, AGR (%))
Figure 199. Japan Hospital Bed Market by Value, 2022-2032 (USD Mn, AGR (%)) (V – Shaped Recovery)
Figure 200. Japan Hospital Bed Market by Value, 2022-2032 (USD Mn, AGR (%)) (W – Shaped Recovery)
Figure 201. Japan Hospital Bed Market by Value, 2022-2032 (USD Mn, AGR (%)) (U – Shaped Recovery)
Figure 202. Japan Hospital Bed Market by Value, 2022-2032 (USD Mn, AGR (%)) (L – Shaped Recovery)
Figure 203. South Korea Hospital Bed Market by Value, 2022-2032 (USD Mn, AGR (%))
Figure 204. South Korea Hospital Bed Market by Value, 2022-2032 (USD Mn, AGR (%)) (V – Shaped Recovery)
Figure 205. South Korea Hospital Bed Market by Value, 2022-2032 (USD Mn, AGR (%)) (W – Shaped Recovery)
Figure 206. South Korea Hospital Bed Market by Value, 2022-2032 (USD Mn, AGR (%)) (U – Shaped Recovery)
Figure 207. South Korea Hospital Bed Market by Value, 2022-2032 (USD Mn, AGR (%)) (L – Shaped Recovery)
Figure 208. Australia Hospital Bed Market by Value, 2022-2032 (USD Mn, AGR (%))
Figure 209. Australia Hospital Bed Market by Value, 2022-2032 (USD Mn, AGR (%)) (V – Shaped Recovery)
Figure 210. Australia Hospital Bed Market by Value, 2022-2032 (USD Mn, AGR (%)) (W – Shaped Recovery)
Figure 211. Australia Hospital Bed Market by Value, 2022-2032 (USD Mn, AGR (%)) (U – Shaped Recovery)
Figure 212. Australia Hospital Bed Market by Value, 2022-2032 (USD Mn, AGR (%)) (L – Shaped Recovery)
Figure 213. Rest of Asia-Pacific Hospital Bed Market by Value, 2022-2032 (USD Mn, AGR (%))
Figure 214. Rest of Asia-Pacific Hospital Bed Market by Value, 2022-2032 (USD Mn, AGR (%)) (V – Shaped Recovery)
Figure 215. Rest of Asia-Pacific Hospital Bed Market by Value, 2022-2032 (USD Mn, AGR (%)) (W – Shaped Recovery)
Figure 216. Rest of Asia-Pacific Hospital Bed Market by Value, 2022-2032 (USD Mn, AGR (%)) (U – Shaped Recovery)
Figure 217. Rest of Asia-Pacific Hospital Bed Market by Value, 2022-2032 (USD Mn, AGR (%)) (L – Shaped Recovery)
Figure 218. LAMEA Hospital Bed Market by Value, 2022-2032 (USD Mn, AGR (%))
Figure 219. LAMEA Hospital Bed Market by Value, 2022-2032 (USD Mn, AGR (%)) (V – Shaped Recovery)
Figure 220. LAMEA Hospital Bed Market by Value, 2022-2032 (USD Mn, AGR (%)) (W – Shaped Recovery)
Figure 221. LAMEA Hospital Bed Market by Value, 2022-2032 (USD Mn, AGR (%)) (U – Shaped Recovery)
Figure 222. LAMEA Hospital Bed Market by Value, 2022-2032 (USD Mn, AGR (%)) (L – Shaped Recovery)
Figure 223. LAMEA Hospital Bed Market by Country, 2022-2032 (USD Mn, AGR (%))
Figure 224. LAMEA Hospital Bed Market by Country, 2022-2032 (USD Mn, AGR (%), CAGR(%)) (V – Shaped Recovery)
Figure 225. LAMEA Hospital Bed Market by Country, 2022-2032 (USD Mn, AGR (%), CAGR(%)) (W – Shaped Recovery)
Figure 226. LAMEA Hospital Bed Market by Country, 2022-2032 (USD Mn, AGR (%), CAGR(%)) (U – Shaped Recovery)
Figure 227. LAMEA Hospital Bed Market by Country, 2022-2032 (USD Mn, AGR (%), CAGR(%)) (L – Shaped Recovery)
Figure 228. LAMEA Hospital Bed Market by Application, 2022-2032 (USD Mn, AGR (%))
Figure 229. LAMEA Hospital Bed Market by Application, 2022-2032 (USD Mn, AGR (%)) (V – Shaped Recovery)
Figure 230. LAMEA Hospital Bed Market by Application, 2022-2032 (USD Mn, AGR (%)) (W – Shaped Recovery)
Figure 231. LAMEA Hospital Bed Market by Application, 2022-2032 (USD Mn, AGR (%)) (U – Shaped Recovery)
Figure 232. LAMEA Hospital Bed Market by Application, 2022-2032 (USD Mn, AGR (%)) (L – Shaped Recovery)
Figure 233. LAMEA Hospital Bed Market Type, 2022-2032 (USD Mn, AGR (%))
Figure 234. LAMEA Hospital Bed Market Type, 2022-2032 (USD Mn, AGR (%)) (V – Shaped Recovery)
Figure 235. LAMEA Hospital Bed Market Type, 2022-2032 (USD Mn, AGR (%)) (W – Shaped Recovery)
Figure 236. LAMEA Hospital Bed Market Type, 2022-2032 (USD Mn, AGR (%)) (U – Shaped Recovery)
Figure 237. LAMEA Hospital Bed Market Type, 2022-2032 (USD Mn, AGR (%)) (L – Shaped Recovery)
Figure 238. LAMEA Hospital Bed Market Hospital Type, 2022-2032 (USD Mn, AGR (%))
Figure 239. LAMEA Hospital Bed Market Hospital Type, 2022-2032 (USD Mn, AGR (%)) (V – Shaped Recovery)
Figure 240. LAMEA Hospital Bed Market Hospital Type, 2022-2032 (USD Mn, AGR (%)) (W – Shaped Recovery)
Figure 241. LAMEA Hospital Bed Market Hospital Type, 2022-2032 (USD Mn, AGR (%)) (U – Shaped Recovery)
Figure 242. LAMEA Hospital Bed Market Hospital Type, 2022-2032 (USD Mn, AGR (%)) (L – Shaped Recovery)
Figure 243. LAMEA Hospital Bed Market Type of Care, 2022-2032 (USD Mn, AGR (%))
Figure 244. LAMEA Hospital Bed Market Type of Care, 2022-2032 (USD Mn, AGR (%)) (V – Shaped Recovery)
Figure 245. LAMEA Hospital Bed Market Type of Care, 2022-2032 (USD Mn, AGR (%)) (W – Shaped Recovery)
Figure 246. LAMEA Hospital Bed Market Type of Care, 2022-2032 (USD Mn, AGR (%)) (U – Shaped Recovery)
Figure 247. LAMEA Hospital Bed Market Type of Care, 2022-2032 (USD Mn, AGR (%)) (L – Shaped Recovery)
Figure 248. LAMEA Hospital Bed Market End User, 2022-2032 (USD Mn, AGR (%))
Figure 249. LAMEA Hospital Bed Market End User, 2022-2032 (USD Mn, AGR (%)) (V – Shaped Recovery)
Figure 250. LAMEA Hospital Bed Market End User 2022-2032 (USD Mn, AGR (%)) (W – Shaped Recovery)
Figure 251. LAMEA Hospital Bed Market End User, 2022-2032 (USD Mn, AGR (%)) (U – Shaped Recovery)
Figure 252. LAMEA Hospital Bed Market End User, 2022-2032 (USD Mn, AGR (%)) (L – Shaped Recovery)
Figure 253. LAMEA Hospital Bed Market by Value, 2022-2032 (USD Mn, AGR (%))
Figure 254. Brazil Hospital Bed Market by Value, 2022-2032 (USD Mn, AGR (%)) (V – Shaped Recovery)
Figure 255. Brazil Hospital Bed Market by Value, 2022-2032 (USD Mn, AGR (%)) (W – Shaped Recovery)
Figure 256. Brazil Hospital Bed Market by Value, 2022-2032 (USD Mn, AGR (%)) (U – Shaped Recovery)
Figure 257. Brazil Hospital Bed Market by Value, 2022-2032 (USD Mn, AGR (%)) (L – Shaped Recovery)
Figure 258. South Africa Hospital Bed Market by Value, 2022-2032 (USD Mn, AGR (%))
Figure 259. South Africa Hospital Bed Market by Value, 2022-2032 (USD Mn, AGR (%)) (V – Shaped Recovery)
Figure 260. South Africa Hospital Bed Market by Value, 2022-2032 (USD Mn, AGR (%)) (W – Shaped Recovery)
Figure 261. South Africa Hospital Bed Market by Value, 2022-2032 (USD Mn, AGR (%)) (U – Shaped Recovery)
Figure 262. South Africa Hospital Bed Market by Value, 2022-2032 (USD Mn, AGR (%)) (L – Shaped Recovery)
Figure 263. Saudi Arabia Hospital Bed Market by Value, 2022-2032 (USD Mn, AGR (%))
Figure 264. Saudi Arabia Hospital Bed Market by Value, 2022-2032 (USD Mn, AGR (%)) (V – Shaped Recovery)
Figure 265. Saudi Arabia Hospital Bed Market by Value, 2022-2032 (USD Mn, AGR (%)) (W – Shaped Recovery)
Figure 266. Saudi Arabia Hospital Bed Market by Value, 2022-2032 (USD Mn, AGR (%)) (U – Shaped Recovery)
Figure 267. Saudi Arabia Hospital Bed Market by Value, 2022-2032 (USD Mn, AGR (%)) (L – Shaped Recovery)
Figure 268. Turkey Hospital Bed Market by Value, 2022-2032 (USD Mn, AGR (%))
Figure 269. Turkey Hospital Bed Market by Value, 2022-2032 (USD Mn, AGR (%)) (V – Shaped Recovery)
Figure 270. Turkey Hospital Bed Market by Value, 2022-2032 (USD Mn, AGR (%)) (W – Shaped Recovery)
Figure 271. Turkey Hospital Bed Market by Value, 2022-2032 (USD Mn, AGR (%)) (U – Shaped Recovery)
Figure 272. Turkey Hospital Bed Market by Value, 2022-2032 (USD Mn, AGR (%)) (L – Shaped Recovery)
Figure 273. UAE Hospital Bed Market by Value, 2022-2032 (USD Mn, AGR (%))
Figure 274. UAE Hospital Bed Market by Value, 2022-2032 (USD Mn, AGR (%)) (V – Shaped Recovery)
Figure 275. UAE Hospital Bed Market by Value, 2022-2032 (USD Mn, AGR (%)) (W – Shaped Recovery)
Figure 276. UAE Hospital Bed Market by Value, 2022-2032 (USD Mn, AGR (%)) (U – Shaped Recovery)
Figure 277. UAE Hospital Bed Market by Value, 2022-2032 (USD Mn, AGR (%)) (L – Shaped Recovery)
Figure 278. Rest of LAMEA Hospital Bed Market by Value, 2022-2032 (USD Mn, AGR (%))
Figure 279. Rest of LAMEA Hospital Bed Market by Value, 2022-2032 (USD Mn, AGR (%)) (V – Shaped Recovery)
Figure 280. Rest of LAMEA Hospital Bed Market by Value, 2022-2032 (USD Mn, AGR (%)) (W – Shaped Recovery)
Figure 281. Rest of LAMEA Hospital Bed Market by Value, 2022-2032 (USD Mn, AGR (%)) (U – Shaped Recovery)
Figure 282. Rest of LAMEA Hospital Bed Market by Value, 2022-2032 (USD Mn, AGR (%)) (L – Shaped Recovery)
Figure 283. GF Health Products: Company Revenue 2016-2020 (US$ Mn, AGR %)
Figure 284. GF Health Products: Company Operating Income 2016-2020 (US$ Mn, AGR %)
Figure 285. GF Health Products: Company Net Income 2016-2020 (US$ Mn, AGR %)
Figure 286. GF Health Products: Company EBITDA 2016-2020 (US$Mn, AGR %)
Figure 287. Getinge AB: Company Revenue 2016-2020 (US$Mn, AGR %)
Figure 288. Getinge AB: Company Operating Income 2016-2020 (US$Mn, AGR %)
Figure 289. Getinge AB: Company Net Income 2016-2020 (US$Mn, AGR %)
Figure 290. Getinge AB: Company EBITDA 2016-2020 US$Mn, AGR %)
Figure 291. Hillrom Holdings Inc.: Company Revenue 2016-2020 (US$Mn, AGR %)
Figure 292. Hillrom Holdings Inc.: Company Operating Income 2016-2020 (US$Mn, AGR %)
Figure 293. Hillrom Holdings Inc.: Company Net Income 2016-2020 (US$Mn, AGR %)
Figure 294. Hillrom Holdings Inc.: Company EBITDA 2016-2020 (US$Mn, AGR %)
Figure 295. Invacare Corporation: Company Revenue 2016-2020 (US$Mn, AGR %)
Figure 296. Invacare Corporation: Company Operating Income 2016-2020 (US$Mn, AGR %)
Figure 297. Invacare Corporation: Company Net Income 2016-2020 (US$Mn, AGR %)
Figure 298. Invacare Corporation: Company EBITDA 2016-2020 (US$Mn, AGR %)
Figure 299. Stryker Corporation: Company Revenue 2016-2020 (US$Mn, AGR %)
Figure 300. Stryker Corporation: Company Operating Income 2016-2020 (US$Mn, AGR %)
Figure 301. Stryker Corporation: Company Net Income 2016-2020 (US$Mn, AGR %)
Figure 302. Stryker Corporation: Company EBITDA 2016-2020 (US$Mn, AGR %)
Figure 303. Savaria Corporation: Company Revenue 2016-2020 (US$Mn, AGR %)
Figure 304. Savaria Corporation: Company Operating Income 2016-2020 (US$Mn, AGR %)
Figure 305. Savaria Corporation: Company Net Income 2016-2020 (US$Mn, AGR %)
Figure 306. Savaria Corporation: Company EBITDA 2016-2020 (US$Mn, AGR %)
Figure 307. Paramount Bed Holdings Co. Ltd: Company Revenue 2016-2020 (US$Mn, AGR %)
Figure 308. Paramount Bed Holdings Co. Ltd: Company Operating Income 2016-2020 (US$Mn, AGR %)
Figure 309. Paramount Bed Holdings Co. Ltd: Company Net Income 2016-2020 (US$Mn, AGR %)
Figure 310. Paramount Bed Holdings Co. Ltd: Company EBITDA 2016-2020 (US$Mn, AGR %)
List of Companies Profiled in the report
Amico Corporation
Antano Group
Famed Zywiec Sp Zo. O
Gendron Inc.
Getinge AB
GF Health Products, Inc.
Hard Manufacturing Co, Inc.
Hill-Rom Holdings, Inc.
Invacare Corporation
LINET Spol S.R.O
Malvestio S.P.A
Medline Industries
Merivaara Corporation
Midmark Corporation
Paramount Bed Holdings Co. Ltd.
Savaria Corporation
Savion Industries
Stiegelmeyer GmbH & Co.
Stryker Corporation
Umano Medical Inc.
List of Other Companies Mentioned in the report
Advance Solutions USA
AF-PPE
Alchemy Mfg.
Alliant Healthcare Products
American National Manufacturing, Inc.
American Screening Corporation
Amico Corp.
Angelus Medical & Optical Equipment
Blue Leaf Hospitality, Inc.
DiaMedical USA Equipment LLC
Dimar Manufacturing Corp
Disc-O-Bed LP
Duobed, LLC
Electropedic Beds
EMS Innovations, Inc
Essex Weld Solutions
Flaghouse
Flush Metal Partition Corporation
Foam N' More, Inc.
GF Health Products, Inc.
International Product Fulfillment
Jameson Medical
Lodging Kit Company
Made Rite Acquisitions, LLC
Medical Supply Professionals LLC
Medics Mobility, Inc.
Medline Industries, Inc.
Med-Mizer, Inc.
Millennial Healthcare Solutions
MJM International Corporation
Osborne Industries, Inc.
Precision Metal Products INC.
PureTec
SCM True Air Technologies, Inc.
Somedreams Corp, LLC
Sun Medical Supplies
Sunset Valley Metalcraft
Synergi, LLC
The Alternative Source Medical
The Gilman Brothers Company
TJ International Supply
Torontech
Tower Medical Systems
Transfer Master Products, Inc.
Unination Inc.
US Health and Hospital Supply Corp.
Wolfdog Medical Supplier, LLC.
Wound Systems, LLC
List of Associations Mentioned in the Report
American Academy of Allergy, Asthma and Immunology (AAAAI)
American Lung Association
British Society for Allergy & Clinical Immunology (BSACI)
International Nurses Group In Immunodeficiencies
Japanese Ministry of Health, Labour and Welfare
Les Entreprises Du Médicament (Leem)
National Development and Reform Commission (NDRC)
National Pharmaceutical Pricing Authority (NPPA)
The Australasian Society of Clinical Immunology and Allergy (ASCIA)
The Pharmaceutical Research and Manufacturers of America (PhRMA)
The Thoracic Society of Australia and New Zealand (TSANZ)
The UK Health and Social Care Information Centre
US Food and Drug Administration (FDA)
World Allergy Organisation
World Health Organisation (WHO)