The Green Data Centre Market Report 2023-2033: This report will prove invaluable to leading firms striving for new revenue pockets if they wish to better understand the industry and its underlying dynamics. It will be useful for companies that would like to expand into different industries or to expand their existing operations in a new region.
The Demand for Data Storage and Processing Is Skyrocketing
As digital technologies continue to transform the way we live and work, the demand for data storage and processing is skyrocketing. However, this growing demand also comes with significant environmental costs, as data centres are notorious for their high energy consumption and carbon emissions. As a result, the green data centre market has emerged as a key solution for reducing the environmental impact of data centres while maintaining their operational efficiency.
Green data centres are designed to minimise the environmental impact of data centre operations, primarily through the use of energy-efficient technologies and renewable energy sources. These data centres prioritise sustainability, energy efficiency, and carbon neutrality, making them a popular choice for organisations that want to reduce their carbon footprint while still meeting their data storage and processing needs.
The green data centre market is being driven by several factors, including increased awareness of the environmental impact of data centres, rising energy costs, and government regulations aimed at reducing carbon emissions. The global shift towards renewable energy sources is also playing a significant role in the growth of the green data centre market. As renewable energy becomes more affordable and accessible, data centres are increasingly turning to wind, solar, and other renewable sources to power their operations.
What Questions Should You Ask before Buying a Market Research Report?
• How is the green data centre market evolving?
• What is driving and restraining the green data centre market?
• How will each green data centre submarket segment grow over the forecast period and how much revenue will these submarkets account for in 2033?
• How will the market shares for each green data centre submarket develop from 2023 to 2033?
• What will be the main driver for the overall market from 2023 to 2033?
• Will leading green data centre markets broadly follow the macroeconomic dynamics, or will individual national markets outperform others?
• How will the market shares of the national markets change by 2033 and which geographical region will lead the market in 2033?
• Who are the leading players and what are their prospects over the forecast period?
• What are the green data centre projects for these leading companies?
• How will the industry evolve during the period between 2023 and 2033? What are the implications of green data centre projects taking place now and over the next 10 years?
• Is there a greater need for product commercialisation to further scale the green data centre market?
• Where is the green data centre market heading and how can you ensure you are at the forefront of the market?
• What are the best investment options for new product and service lines?
• What are the key prospects for moving companies into a new growth path and C-suite?
You need to discover how this will impact the green data centre market today, and over the next 10 years:
• Our 305-page report provides 147 tables and 187 charts/graphs exclusively to you.
• The report highlights key lucrative areas in the industry so you can target them – NOW.
• It contains in-depth analysis of global, regional and national sales and growth.
• It highlights for you the key successful trends, changes and revenue projections made by your competitors.
This report tells you TODAY how the green data centre market will develop in the next 10 years, and in line with the variations in COVID-19 economic recession and bounce. This market is more critical now than at any point over the last 10 years.
Forecasts to 2033 and other analyses reveal commercial prospects
• In addition to revenue forecasting to 2033, our new study provides you with recent results, growth rates, and market shares.
• You will find original analyses, with business outlooks and developments.
• Discover qualitative analyses (including market dynamics, drivers, opportunities, restraints and challenges), cost structure, impact of rising green data centre prices and recent developments.
This report includes data analysis and invaluable insight into how COVID-19 will affect the industry and your company. Four COVID-19 recovery patterns and their impact, namely, “V”, “L”, “W” and “U” are discussed in this report.
Segments Covered in the Report
Market Segment by Size
• Small and Medium-sized Data centres
• Large Data centres
Market Segment by Component
• Design and Consulting
• Installation and Deployment
• Maintenance and Support
Market Segment by Technology
• Direct Liquid Cooling
• Close‐Coupled Refrigerant Cooling
• Free Cooling/Hardening
• Other Technology
Market Segment by System
• Software Power Management
• Energy‐aware Workload Allocation
• Dynamic Provisioning
• Energy‐aware Networking
• Other Systems
Market Segment by Vertical
• BFSI
• IT and Telecom
• Media and Entertainment
• Healthcare
• Government and Defence
• Other Verticals

In addition to the revenue predictions for the overall world market and segments, you will also find revenue forecasts for four regional and 20 leading national markets:
North America
• U.S.
• Canada
Europe
• Germany
• Spain
• United Kingdom
• France
• Italy
• Rest of Europe
Asia Pacific
• China
• Singapore
• Hong Kong
• Japan
• India
• Rest of Asia-Pacific
Latin America
• Brazil
• Mexico
• Rest of Latin America
Middle East & Africa
• GCC
• South Africa
• Rest of Middle East & Africa
Need industry data? Please contact us today.
The report also includes profiles and for some of the leading companies in the Green Data Centre Market, 2023 to 2033, with a focus on this segment of these companies’ operations.
Leading companies and the potential for market growth
• Asetek A/S
• Cisco Systems, Inc.
• Dell Inc.
• Delta Electronics, Inc.
• Green Revolution Cooling
• Hewlett Packard Enterprise Company (HPE)
• Lenovo Group Limited
• Midas Green Technologies
• Nortek Air Solutions, LLC
• Schneider Electric SE
Overall world revenue for Green Data Centre Market, 2023 to 2033 in terms of value the market will surpass US$59.89 billion in 2023, our work calculates. We predict strong revenue growth through to 2033. Our work identifies which organisations hold the greatest potential. Discover their capabilities, progress, and commercial prospects, helping you stay ahead.
How will the Green Data Centre Market, 2023 to 2033 report help you?
In summary, our 300+ page report provides you with the following knowledge:
• Revenue forecasts to 2033 for Green Data Centre Market, 2023 to 2033 Market, with forecasts for size, technology, component, vertical, system and company size, each forecast at a global and regional level – discover the industry’s prospects, finding the most lucrative places for investments and revenues.
• Revenue forecasts to 2033 for four regional and 20 key national markets – See forecasts for the Green Data Centre Market, 2023 to 2033 market in North America, Europe, Asia-Pacific, Latin America and Middle East & Africa. Also forecasted is the market in the US, Canada, Brazil, Germany, France, UK, Italy, China, India, Japan, and Australia among other prominent economies.
• Prospects for established firms and those seeking to enter the market – including company profiles for 10 of the major companies involved in the Green Data Centre Market, 2023 to 2033.
Find quantitative and qualitative analyses with independent predictions. Receive information that only our report contains, staying informed with invaluable business intelligence.
Information found nowhere else
With our new report, you are less likely to fall behind in knowledge or miss out on opportunities. See how our work could benefit your research, analyses, and decisions. Visiongain’s study is for everybody needing commercial analyses for the Green Data Centre Market, 2023 to 2033, market-leading companies. You will find data, trends and predictions.
To access the data contained in this document please email contactus@visiongain.com
Buy our report today Green Data Centre Market Report 2023-2033: Forecasts by Size (Small and Medium-sized Data Centres, Large Data Centres), by Component (Design and Consulting, Installation and Deployment, Maintenance and Support), by Technology (Direct Liquid Cooling, Close-Coupled Refrigerant Cooling, Free Cooling/Hardening, Other), by System (Software Power Management, Energy-aware Workload Allocation, Dynamic Provisioning, Energy-aware Networking, Other), by Vertical (BFSI, IT and Telecom, Media and Entertainment, Healthcare, Government and Defence, Other) AND Regional and Leading National Market Analysis PLUS Analysis of Leading Companies AND COVID-19 Impact and Recovery Pattern Analysis. Avoid missing out by staying informed – order our report now.
Visiongain is a trading partner with the US Federal Government
CCR Ref number: KD4R6
Do you have any custom requirements we can help you with? Any need for a specific country, geo region, market segment or specific company information? Contact us today, we can discuss your needs and see how we can help: contactus@visiongain.com
1 Report Overview
1.1 Objectives of the Study
1.2 Introduction to Green Data Centre Market
1.3 What This Report Delivers
1.4 Why You Should Read This Report
1.5 Key Questions Answered by This Analytical Report
1.6 Who is This Report for?
1.7 Research Methodology
1.7.1 Market Definitions
1.7.2 Market Evaluation & Forecasting Methodology
1.7.3 Data Validation
1.7.3.1 Primary Research
1.7.3.2 Secondary Research
1.8 Frequently Asked Questions (FAQs)
1.9 Associated Visiongain Reports
1.10 About Visiongain
2 Executive Summary
2.1 Segment Analysis
2.1.1 Size Segment: Market Attractiveness Index
2.1.2 Component Segment: Market Attractiveness Index
2.1.3 Technology Segment: Market Attractiveness Index
2.1.4 System Segment: Market Attractiveness Index
2.1.5 Vertical Segment: Market Attractiveness Index
2.1.6 Regional Analysis
3 Industry Overview
3.1 Overview/Structure
3.2 Data Centre Design
3.2.1 Physical Layout
3.3 Power Infrastructure
3.3.1 Cooling Infrastructure
3.4 Recent Trends/ Developments
3.4.1 Data Castle launched to Operate Data Centers in Germany, Starts Constructing First Site in Frankfurt.
3.4.2 Volkswagen AG Aims to Make Data Centers Climate-Neutral by 2027
4 Market Dynamics
4.1 Market Driving Factors
4.1.1 Growing Environmental Concerns Around the World
4.1.2 Managing the Increasing Cost of the Energy
4.1.3 Increasing Number of Environmental Regulations Around the World
4.2 Market Restraining Factors
4.2.1 Security Issues in Green Data Centers
4.2.2 The Challenges in Keeping Data Centres Sustainable
4.2.3 Main Challenges in Building a Green Data Center is the High Initial Cost
4.3 Market Opportunities
4.3.1 Green Data Centers Are Attracting Commercial Real Estate Investment
4.3.2 Green Data Centre Reduced Impact on Environment and Consumed Less Energy
4.3.3 Growing Demand for Cloud Computing
4.4 SWOT Analysis
4.4.1 Market Strengths
4.4.2 Market Weaknesses
4.4.3 Market Opportunities
4.4.4 Market Threats
4.5 COVID-19 Impact Analysis
4.5.1 V-Shaped Recovery Scenario
4.5.2 W-Shaped Recovery Scenario
4.5.3 U-Shaped Recovery Scenario
4.5.4 L-Shaped Recovery Scenario
4.6 PESTLE Analysis
4.6.1 Political Factors
4.6.2 Economic Factors
4.6.3 Social Factors
4.6.4 Technology Factors
4.6.5 Environmental Factors
4.6.6 Legal Factors
4.7 Porter’s Five Forces Analysis
4.7.1 Threat of New Entrants
4.7.2 Bargaining Power of Suppliers
4.7.3 Bargaining Power of Buyers
4.7.4 Threat of Substitutes
4.7.5 Competitive Rivalry
5 Green Data Centre Market Analysis by Size
5.1 Key Findings
5.1.1 Size Segment: Market Attractiveness Index
5.1.2 Green Data Centre Market by Size
5.2 Small and Medium-sized Data Centers
5.2.1 Market by Region, 2023-2033 (US$ Bn)
5.3 Large Data Centers
5.3.1 Market by Region, 2023-2033 (US$ Bn)
6 Green Data Centre Market Analysis by Component
6.1 Key Findings
6.2 Component Segment: Market Attractiveness Index
6.2.1 Green Data Centre Market by Component
6.3 Design and Consulting
6.3.1 Market by Region, 2023-2033 (US$ Bn)
6.4 Installation and Deployment
6.4.1 Market by Region, 2023-2033 (US$ Bn)
6.5 Maintenance and Support
6.5.1 Market by Region, 2023-2033 (US$ Bn)
7 Green Data Centre Market Analysis by Technology
7.1 Key Findings
7.2 Technology Segment: Market Attractiveness Index
7.2.1 Green Data Center Market by Technology
7.3 Direct Liquid Cooling
7.3.1 Market by Region, 2023-2033 (US$ Bn)
7.4 Close‐Coupled Refrigerant Cooling
7.4.1 Market by Region, 2023-2033 (US$ Bn)
7.5 Free Cooling/Hardening
7.5.1 Market by Region, 2023-2033 (US$ Bn)
7.6 Other Technology
7.6.1 Market by Region, 2023-2033 (US$ Bn)
8 Green Data Centre Market Analysis by System
8.1 Key Findings
8.1.1 System Segment: Market Attractiveness Index
8.1.2 Green Data Center Market by System
8.2 Software Power Management
8.2.1 Market by Region, 2023-2033 (US$ Bn)
8.3 Energy‐aware Workload Allocation
8.3.1 Market by Region, 2023-2033 (US$ Bn)
8.4 Dynamic Provisioning
8.4.1 Market by Region, 2023-2033 (US$ Bn)
8.5 Energy‐aware Networking
8.5.1 Market by Region, 2023-2033 (US$ Bn)
8.6 Other Systems
8.6.1 Wireless Data Centres
8.6.2 Memory Type Optimisation
8.6.3 Market by Region, 2023-2033 (US$ Bn)
9 Green Data Centre Market Analysis by Vertical
9.1 Key Findings
9.1.1 Vertical Segment: Market Attractiveness Index
9.1.2 Green Data Center Market by Vertical
9.2 BFSI
9.2.1 Market by Region, 2023-2033 (US$ Bn)
9.3 IT and Telecom
9.3.1 Market by Region, 2023-2033 (US$ Bn)
9.4 Media and Entertainment
9.4.1 Market by Region, 2023-2033 (US$ Bn)
9.5 Healthcare
9.5.1 Market by Region, 2023-2033 (US$ Bn)
9.6 Government and Defence
9.6.1 Market by Region, 2023-2033 (US$ Bn)
9.7 Other Verticals
9.7.1 Market by Region, 2023-2033 (US$ Bn)
10 Green Data Centre Market Analysis by Region
10.1 Key Findings
11 North America Green Data Centre Market Analysis
11.1 Region Overview
11.2 North America Green Data Centre Market Attractiveness Index
11.3 North America Green Data Center Market by Value
11.4 North America Green Data Center Market by Country
11.5 North America Green Data Center Market by Size
11.6 North America Green Data Center Market by Component
11.7 North America Green Data Center Market by Technology
11.8 North America Green Data Center Market by System
11.9 North America Green Data Center Market by Vertical
11.10 U.S. Green Data Centre Market Analysis
11.10.1 The Cleanest and Dirtiest Data Centers in the U.S.
11.11 Canada Green Data Centre Market Analysis
11.11.1 Vantage Announces CAD$900 Million Expansion in Canada
12 Europe Green Data Centre Market Analysis
12.1 Region Overview
12.2 Europe Green Data Centre Market Attractiveness Index
12.3 Europe Green Data Center Market by Value
12.4 Europe Green Data Center Market by Country
12.5 Europe Green Data Center Market by Size
12.6 Europe Green Data Center Market by Component
12.7 Europe Green Data Center Market by Technology
12.8 Europe Green Data Center Market by System
12.9 Europe Green Data Center Market by Vertical
12.10 Germany Green Data Centre Market Analysis
12.11 UK Green Data Centre Market Analysis
12.12 France Green Data Centre Market Analysis
12.13 Italy Green Data Centre Market Analysis
12.14 Spain Green Data Centre Market Analysis
12.14.1 LEED Gold for Spain´s First “Green” Data Centre
12.15 Rest of Europe Green Data Centre Market Analysis
12.15.1 AQ Compute and CBRE Open Green Data Centre in Barcelona To Kick-Start New Agreement
13 Asia-Pacific Green Data Centre Market Analysis
13.1 Region Overview
13.2 Asia-Pacific Green Data Centre Market Attractiveness Index
13.3 Asia-Pacific Green Data Center Market by Value
13.4 Asia-Pacific Green Data Center Market by Country
13.5 Asia-Pacific Green Data Center Market by Size
13.6 Asia-Pacific Green Data Center Market by Component
13.7 Asia-Pacific Green Data Center Market by Technology
13.8 Asia-Pacific Green Data Center Market by System
13.9 Asia-Pacific Green Data Center Market by Vertical
13.10 China Green Data Centre Market Analysis
13.10.1 Towards a Greener China
13.11 Singapore Green Data Centre Market Analysis
13.12 Hong Kong Green Data Centre Market Analysis
13.13 Japan Green Data Centre Market Analysis
13.14 India Green Data Centre Market Analysis
13.14.1 PhonePe Launches Green Data Center in India with Dell Technologies, NTT
13.15 Rest of Asia-Pacific Green Data Centre Market Analysis
14 Middle East & Africa Green Data Centre Market Analysis
14.1 Region Overview
14.2 Middle East & Africa Green Data Centre Market Attractiveness Index
14.3 Middle East & Africa Green Data Center Market by Value
14.4 Middle East & Africa Green Data Center Market by Country
14.5 Middle East & Africa Green Data Center Market by Size
14.6 Middle East & Africa Green Data Center Market by Component
14.7 Middle East & Africa Green Data Center Market by Technology
14.8 Middle East & Africa Green Data Center Market by System
14.9 Middle East & Africa Green Data Center Market by Vertical
14.10 GCC Green Data Center Market Analysis
14.10.1 Neom Forms Joint Venture with FAS Energy to Develop Data Centers in Saudi Arabia
14.10.2 UAE Green Data Center Market Analysis
14.11 South Africa Green Data Center Market Analysis
14.12 Rest of Middle East & Africa Green Data Center Market Analysis
15 Latin America Green Data Centre Market Analysis
15.1 Region Overview
15.2 Latin America Green Data Centre Market Attractiveness Index
15.3 Latin America Green Data Center Market by Value
15.4 Latin America Green Data Center Market by Country
15.5 Latin America Green Data Center Market by Size
15.6 Latin America Green Data Center Market by Component
15.7 Latin America Green Data Center Market by Technology
15.8 Latin America Green Data Center Market by System
15.9 Latin America Green Data Center Market by Vertical
15.10 Brazil Green Data Center Market Analysis
15.10.1 Brazil’s Scala Launches New Data Center in São Paulo
15.11 Mexico Green Data Center Market Analysis
15.11.1 Odata Launches Mexico Data center in Querétaro
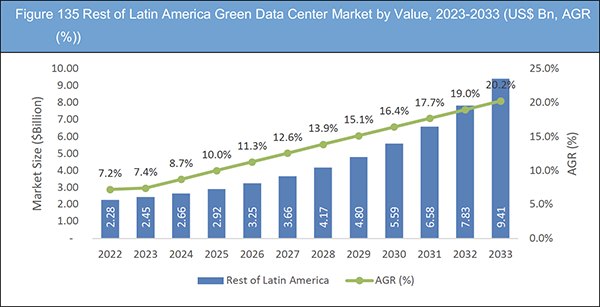
15.12 Rest of Latin America Green Data Center Market Analysis
15.12.1 Data Centre Operator Acquires Latin American Hyperscale Platform
16 Company Profiles
16.1 Competitive Landscape, 2022
16.2 Strategic Outlook
16.2.1 Partnership as Key Business Strategy
16.2.2 Collaboration as Key Business Strategy
16.2.3 New Product Launch as Key Business Strategy
16.2.4 Expansion as Key Business Strategy
16.2.5 Contract as Key Business Strategy
16.2.6 Agreement as Key Business Strategy
16.3 Schneider Electric SE
16.3.1 Company Snapshot
16.3.2 Company Overview
16.3.3 Financial Analysis
16.3.3.1 Net Revenue, 2018-2022
16.3.3.2 Gross Profit, 2018-2022
16.3.3.3 R&D, 2018-2022
16.3.4 Product Benchmarking
16.3.5 Strategic Outlook
16.4 Hewlett Packard Enterprise Company (HPE)
16.4.1 Company Snapshot
16.4.2 Company Overview
16.4.3 Financial Analysis
16.4.3.1 Net Revenue, 2018-2022
16.4.3.2 Gross Profit, 2018-2022
16.4.3.3 R&D, 2018-2022
16.4.4 Product Benchmarking
16.4.5 Strategic Outlook
16.5 Green Revolution Cooling
16.5.1 Company Snapshot
16.5.2 Company Overview
16.5.3 Product Benchmarking
16.5.4 Strategic Outlook
16.6 Midas Green Technologies
16.6.1 Company Snapshot
16.6.2 Company Overview
16.6.3 Product Benchmarking
16.6.4 Strategic Outlook
16.7 Cisco Systems, Inc.
16.7.1 Company Snapshot
16.7.2 Company Overview
16.7.3 Financial Analysis
16.7.3.1 Net Revenue, 2018-2022
16.7.3.2 Gross Profit, 2018-2022
16.7.3.3 R&D, 2018-2022
16.7.4 Product Benchmarking
16.7.5 Strategic Outlook
16.8 Delta Electronics
16.8.1 Company Snapshot
16.8.2 Company Overview
16.8.3 Product Benchmarking
16.8.4 Strategic Outlook
16.9 Nortek Air Solutions, LLC
16.9.1 Company Snapshot
16.9.2 Company Overview
16.9.3 Product Benchmarking
16.9.4 Strategic Outlook
16.10 Dell Inc.
16.10.1 Company Snapshot
16.10.2 Company Overview
16.10.3 Financial Analysis
16.10.3.1 Net Revenue, 2018-2022
16.10.3.2 Gross Profit, 2018-2022
16.10.3.3 R&D, 2018-2022
16.10.4 Product Benchmarking
16.10.5 Strategic Outlook
16.11 Asetek A/S
16.11.1 Company Snapshot
16.11.2 Company Overview
16.11.3 Product Benchmarking
16.11.4 Strategic Outlook
16.12 Lenovo Group Limited
16.12.1 Company Snapshot
16.12.2 Company Overview
16.12.3 Financial Analysis
16.12.3.1 Net Revenue, 2018-2022
16.12.3.2 Gross Profit, 2018-2022
16.12.3.3 R&D, 2018-2022
16.12.4 Product Benchmarking
16.12.5 Strategic Outlook
17 Conclusion and Recommendations
17.1 Concluding Remarks from Visiongain
17.2 Recommendations for Market Players
List of Tables
Table 1 Green Data Centre Market Snapshot, 2023 & 2033 (US$ billion, CAGR %)
Table 2 Green Data Center Market by Region, 2023-2033 (US$ Bn, AGR (%), CAGR (%)) (V-Shaped Recovery Scenario)
Table 3 Green Data Center Market by Region, 2023-2033 (US$ Bn, AGR (%), CAGR (%)) (W-Shaped Recovery Scenario)
Table 4 Green Data Center Market by Region, 2023-2033 (US$ Bn, AGR (%), CAGR (%)) (U-Shaped Recovery Scenario)
Table 5 Green Data Center Market by Region, 2023-2033 (US$ Bn, AGR (%), CAGR (%)) (L-Shaped Recovery Scenario)
Table 6 Green Data Center Market by Size, 2023-2033 (US$ Bn, AGR (%), CAGR (%))
Table 7 Small and Medium-sized Data Centers Market by Region, 2023-2033 (US$ Bn, AGR (%), CAGR (%))
Table 8 Large Data Centers Market by Region, 2023-2033 (US$ Bn, AGR (%), CAGR (%))
Table 9 Green Data Center Market by Component, 2023-2033 (US$ Bn, AGR (%), CAGR (%))
Table 10 Design and Consulting Market by Region, 2023-2033 (US$ Bn, AGR (%), CAGR (%))
Table 11 Installation and Deployment Market by Region, 2023-2033 (US$ Bn, AGR (%), CAGR (%))
Table 12 Maintenance and Support Market by Region, 2023-2033 (US$ Bn, AGR (%), CAGR (%))
Table 13 Green Data Center Market by Technology, 2023-2033 (US$ Bn, AGR (%), CAGR (%))
Table 14 Direct Liquid Cooling Market by Region, 2023-2033 (US$ Bn, AGR (%), CAGR (%))
Table 15 Close‐Coupled Refrigerant Cooling Market by Region, 2023-2033 (US$ Bn, AGR (%), CAGR (%))
Table 16 Free Cooling/Hardening Market by Region, 2023-2033 (US$ Bn, AGR (%), CAGR (%))
Table 17 Other Technology Market by Region, 2023-2033 (US$ Bn, AGR (%), CAGR (%))
Table 18 Green Data Center Market by System, 2023-2033 (US$ Bn, AGR (%), CAGR (%))
Table 19 Software Power Management Market by Region, 2023-2033 (US$ Bn, AGR (%), CAGR (%))
Table 20 Energy‐aware Workload Allocation Market by Region, 2023-2033 (US$ Bn, AGR (%), CAGR (%))
Table 21 Dynamic Provisioning Market by Region, 2023-2033 (US$ Bn, AGR (%), CAGR (%))
Table 22 Energy‐aware Networking Market by Region, 2023-2033 (US$ Bn, AGR (%), CAGR (%))
Table 23 Other Systems Market by Region, 2023-2033 (US$ Bn, AGR (%), CAGR (%))
Table 24 Green Data Center Market by Vertical, 2023-2033 (US$ Bn, AGR (%), CAGR (%))
Table 25 BFSI Market by Region, 2023-2033 (US$ Bn, AGR (%), CAGR (%))
Table 26 IT and Telecom Market by Region, 2023-2033 (US$ Bn, AGR (%), CAGR (%))
Table 27 Media and Entertainment Market by Region, 2023-2033 (US$ Bn, AGR (%), CAGR (%))
Table 28 Healthcare Market by Region, 2023-2033 (US$ Bn, AGR (%), CAGR (%))
Table 29 Government and Defence Market by Region, 2023-2033 (US$ Bn, AGR (%), CAGR (%))
Table 30 Other Verticals Market by Region, 2023-2033 (US$ Bn, AGR (%), CAGR (%))
Table 31 Green Data Center Market by Region, 2023-2033 (US$ Bn, AGR (%), CAGR (%))
Table 32 North America Green Data Center Market by Value, 2023-2033 (US$ Bn, AGR (%), CAGR (%))
Table 33 North America Green Data Center Market by Country, 2023-2033 (US$ Bn, AGR (%), CAGR (%))
Table 34 North America Green Data Center Market by Size, 2023-2033 (US$ Bn, AGR (%), CAGR (%))
Table 35 North America Green Data Center Market by Component, 2023-2033 (US$ Bn, AGR (%), CAGR (%))
Table 36 North America Green Data Center Market by Technology, 2023-2033 (US$ Bn, AGR (%), CAGR (%))
Table 37 North America Green Data Center Market by System, 2023-2033 (US$ Bn, AGR (%), CAGR (%))
Table 38 North America Green Data Center Market by Vertical, 2023-2033 (US$ Bn, AGR (%), CAGR (%))
Table 39 US Green Data Center Market by Value, 2023-2033 (US$ Bn, AGR (%), CAGR (%))
Table 40 Canada Green Data Center Market by Value, 2023-2033 (US$ Bn, AGR (%), CAGR (%))
Table 41 Europe Green Data Center Market by Value, 2023-2033 (US$ Bn, AGR (%), CAGR (%))
Table 42 Europe Green Data Center Market by Country, 2023-2033 (US$ Bn, AGR (%), CAGR (%))
Table 43 Europe Green Data Center Market by Size, 2023-2033 (US$ Bn, AGR (%), CAGR (%))
Table 44 Europe Green Data Center Market by Component, 2023-2033 (US$ Bn, AGR (%), CAGR (%))
Table 45 Europe Green Data Center Market by Technology, 2023-2033 (US$ Bn, AGR (%), CAGR (%))
Table 46 Europe Green Data Center Market by System, 2023-2033 (US$ Bn, AGR (%), CAGR (%))
Table 47 Europe Green Data Center Market by Vertical, 2023-2033 (US$ Bn, AGR (%), CAGR (%))
Table 48 Germany Green Data Center Market by Value, 2023-2033 (US$ Bn, AGR (%), CAGR (%))
Table 49 UK Green Data Center Market by Value, 2023-2033 (US$ Bn, AGR (%), CAGR (%))
Table 50 France Green Data Center Market by Value, 2023-2033 (US$ Bn, AGR (%), CAGR (%))
Table 51 Italy Green Data Center Market by Value, 2023-2033 (US$ Bn, AGR (%), CAGR (%))
Table 52 Spain Green Data Center Market by Value, 2023-2033 (US$ Bn, AGR (%), CAGR (%))
Table 53 Rest of Europe Green Data Center Market by Value, 2023-2033 (US$ Bn, AGR (%), CAGR (%))
Table 54 Asia-Pacific Green Data Center Market by Value, 2023-2033 (US$ Bn, AGR (%), CAGR (%))
Table 55 Asia-Pacific Green Data Center Market by Country, 2023-2033 (US$ Bn, AGR (%), CAGR (%))
Table 56 Asia-Pacific Green Data Center Market by Size, 2023-2033 (US$ Bn, AGR (%), CAGR (%))
Table 57 Asia-Pacific Green Data Center Market by Component, 2023-2033 (US$ Bn, AGR (%), CAGR (%))
Table 58 Asia-Pacific Green Data Center Market by Technology, 2023-2033 (US$ Bn, AGR (%), CAGR (%))
Table 59 Asia-Pacific Green Data Center Market by System, 2023-2033 (US$ Bn, AGR (%), CAGR (%))
Table 60 Asia-Pacific Green Data Center Market by Vertical, 2023-2033 (US$ Bn, AGR (%), CAGR (%))
Table 61 China Green Data Center Market by Value, 2023-2033 (US$ Bn, AGR (%), CAGR (%))
Table 62 Singapore Green Data Center Market by Value, 2023-2033 (US$ Bn, AGR (%), CAGR (%))
Table 63 Hong Kong Green Data Center Market by Value, 2023-2033 (US$ Bn, AGR (%), CAGR (%))
Table 64 Japan Green Data Center Market by Value, 2023-2033 (US$ Bn, AGR (%), CAGR (%))
Table 65 India Green Data Center Market by Value, 2023-2033 (US$ Bn, AGR (%), CAGR (%))
Table 66 Rest of Asia-Pacific Green Data Center Market by Value, 2023-2033 (US$ Bn, AGR (%), CAGR (%))
Table 67 Middle East & Africa Green Data Center Market by Value, 2023-2033 (US$ Bn, AGR (%), CAGR (%))
Table 68 Middle East & Africa Green Data Center Market by Country, 2023-2033 (US$ Bn, AGR (%), CAGR (%))
Table 69 Middle East & Africa Green Data Center Market by Size, 2023-2033 (US$ Bn, AGR (%), CAGR (%))
Table 70 Middle East & Africa Green Data Center Market by Component, 2023-2033 (US$ Bn, AGR (%), CAGR (%))
Table 71 Middle East & Africa Green Data Center Market by Technology, 2023-2033 (US$ Bn, AGR (%), CAGR (%))
Table 72 Middle East & Africa Green Data Center Market by System, 2023-2033 (US$ Bn, AGR (%), CAGR (%))
Table 73 Middle East & Africa Green Data Center Market by Vertical, 2023-2033 (US$ Bn, AGR (%), CAGR (%))
Table 74 GCC Green Data Center Market by Value, 2023-2033 (US$ Bn, AGR (%), CAGR (%))
Table 75 South Africa Green Data Center Market by Value, 2023-2033 (US$ Bn, AGR (%), CAGR (%))
Table 76 Rest of Middle East & Africa Green Data Center Market by Value, 2023-2033 (US$ Bn, AGR (%), CAGR (%))
Table 77 Latin America Green Data Center Market by Value, 2023-2033 (US$ Bn, AGR (%), CAGR (%))
Table 78 Latin America Green Data Center Market by Country, 2023-2033 (US$ Bn, AGR (%), CAGR (%))
Table 79 Latin America Green Data Center Market by Size, 2023-2033 (US$ Bn, AGR (%), CAGR (%))
Table 80 Latin America Green Data Center Market by Component, 2023-2033 (US$ Bn, AGR (%), CAGR (%))
Table 81 Latin America Green Data Center Market by Technology, 2023-2033 (US$ Bn, AGR (%), CAGR (%))
Table 82 Latin America Green Data Center Market by System, 2023-2033 (US$ Bn, AGR (%), CAGR (%))
Table 83 Latin America Green Data Center Market by Vertical, 2023-2033 (US$ Bn, AGR (%), CAGR (%))
Table 84 Brazil Green Data Center Market by Value, 2023-2033 (US$ Bn, AGR (%), CAGR (%))
Table 85 Mexico Green Data Center Market by Value, 2023-2033 (US$ Bn, AGR (%), CAGR (%))
Table 86 Rest of Latin America Green Data Center Market by Value, 2023-2033 (US$ Bn, AGR (%), CAGR (%))
Table 87 Schneider Electric SE: Key Details, (CEO, HQ, Revenue, Founded, No. of Employees, Company Type, Website, Business Segment)
Table 88 Schneider Electric SE: Product Benchmarking
Table 89 Schneider Electric SE: Strategic Outlook
Table 90 Hewlett Packard Enterprise Company (HPE): Key Details, (CEO, HQ, Revenue, Founded, No. of Employees, Company Type, Website, Business Segment)
Table 91 Hewlett Packard Enterprise Company (HPE): Product Benchmarking
Table 92 Hewlett Packard Enterprise Company (HPE): Strategic Outlook
Table 93 Green Revolution Cooling: Key Details, (CEO, HQ, Revenue, Founded, No. of Employees, Company Type, Website, Business Segment)
Table 94 Green Revolution Cooling: Product Benchmarking
Table 95 Green Revolution Cooling: Strategic Outlook
Table 96 Midas Green Technologies: Key Details, (CEO, HQ, Revenue, Founded, No. of Employees, Company Type, Website, Business Segment)
Table 97 Midas Green Technologies: Product Benchmarking
Table 98 Midas Green Technologies: Strategic Outlook
Table 99 Cisco Systems, Inc: Key Details, (CEO, HQ, Revenue, Founded, No. of Employees, Company Type, Website, Business Segment)
Table 100 Cisco Systems, Inc: Product Benchmarking
Table 101 Cisco Systems, Inc: Strategic Outlook
Table 102 Delta Electronics: Key Details, (CEO, HQ, Revenue, Founded, No. of Employees, Company Type, Website, Business Segment)
Table 103 Delta Electronics: Product Benchmarking
Table 104 Delta Electronics: Strategic Outlook
Table 105 Nortek Air Solutions, LLC: Key Details, (CEO, HQ, Revenue, Founded, No. of Employees, Company Type, Website, Business Segment)
Table 106 Nortek Air Solutions, LLC: Product Benchmarking
Table 107 Nortek Air Solutions, LLC: Strategic Outlook
Table 108 Dell Inc.: Key Details, (CEO, HQ, Revenue, Founded, No. of Employees, Company Type, Website, Business Segment)
Table 109 Dell Inc.: Product Benchmarking
Table 110 Dell Inc.: Strategic Outlook
Table 111 Asetek A/S: Key Details, (CEO, HQ, Revenue, Founded, No. of Employees, Company Type, Website, Business Segment)
Table 112 Asetek A/S: Product Benchmarking
Table 113 Asetek A/S: Strategic Outlook
Table 114 Lenovo Group Limited: Key Details, (CEO, HQ, Revenue, Founded, No. of Employees, Company Type, Website, Business Segment)
Table 115 Lenovo Group Limited: Product Benchmarking
Table 116 Lenovo Group Limited: Strategic Outlook
List of Figures
Figure 1 Green Data Centre Market Segmentation
Figure 2 Green Data Center Market by Size: Market Attractiveness Index
Figure 3 Green Data Center Market by Component: Market Attractiveness Index
Figure 4 Green Data Center Market by Technology: Market Attractiveness Index
Figure 5 Green Data Center Market by System: Market Attractiveness Index
Figure 6 Green Data Center Market by Vertical: Market Attractiveness Index
Figure 7 Green Data Center Market by Region: Market Attractiveness Index
Figure 8 Green Data Centre Market: Market Dynamics
Figure 9 Green Data Center Market Share Forecast by COVID, 2023-2033 (%)
Figure 10 Green Data Center Market by Region, 2023-2033 (US$ Bn, AGR (%)) (V-Shaped Recovery Scenario)
Figure 11 Green Data Center Market by Region, 2023-2033 (US$ Bn, AGR (%)) (W-Shaped Recovery Scenario)
Figure 12 Green Data Center Market by Region, 2023-2033 (US$ Bn, AGR (%)) (U-Shaped Recovery Scenario)
Figure 13 Green Data Center Market by Region, 2023-2033 (US$ Bn, AGR (%)) (L-Shaped Recovery Scenario)
Figure 14 Green Data Centre Market: Porter’s Five Forces Analysis
Figure 15 Green Data Centre Market by Size: Market Attractiveness Index
Figure 16 Green Data Center Market by Size, 2023-2033 (US$ Bn, AGR (%))
Figure 17 Small and Medium-sized Data Centers Market by Region, 2023-2033 (US$ Bn, AGR (%))
Figure 18 Large Data Centers Market by Region, 2023-2033 (US$ Bn, AGR (%))
Figure 19 Green Data Centre Market by Size: Market Attractiveness Index
Figure 20 Green Data Center Market by Component, 2023-2033 (US$ Bn, AGR (%))
Figure 21 Design and Consulting Market by Region, 2023-2033 (US$ Bn, AGR (%))
Figure 22 Installation and Deployment Market by Region, 2023-2033 (US$ Bn, AGR (%))
Figure 23 Maintenance and Support Market by Region, 2023-2033 (US$ Bn, AGR (%))
Figure 24 Green Data Centre Market by Technology: Market Attractiveness Index
Figure 25 Green Data Center Market by Technology, 2023-2033 (US$ Bn, AGR (%))
Figure 26 Direct Liquid Cooling Market by Region, 2023-2033 (US$ Bn, AGR (%))
Figure 27 Close‐Coupled Refrigerant Cooling Market by Region, 2023-2033 (US$ Bn, AGR (%))
Figure 28 Free Cooling/Hardening Market by Region, 2023-2033 (US$ Bn, AGR (%))
Figure 29 Other Technology Market by Region, 2023-2033 (US$ Bn, AGR (%))
Figure 30 Green Data Centre Market by System: Market Attractiveness Index
Figure 31 Green Data Center Market by System, 2023-2033 (US$ Bn, AGR (%))
Figure 32 Software Power Management Market by Region, 2023-2033 (US$ Bn, AGR (%))
Figure 33 Energy‐aware Workload Allocation Market by Region, 2023-2033 (US$ Bn, AGR (%))
Figure 34 Dynamic Provisioning Market by Region, 2023-2033 (US$ Bn, AGR (%))
Figure 35 Energy‐aware Networking Market by Region, 2023-2033 (US$ Bn, AGR (%))
Figure 36 Other Systems Market by Region, 2023-2033 (US$ Bn, AGR (%))
Figure 37 Green Data Centre Market by Vertical: Market Attractiveness Index
Figure 38 Green Data Center Market by Vertical, 2023-2033 (US$ Bn, AGR (%))
Figure 39 BFSI Market by Region, 2023-2033 (US$ Bn, AGR (%))
Figure 40 IT and Telecom Market by Region, 2023-2033 (US$ Bn, AGR (%))
Figure 41 Media and Entertainment Market by Region, 2023-2033 (US$ Bn, AGR (%))
Figure 42 Healthcare Market by Region, 2023-2033 (US$ Bn, AGR (%))
Figure 43 Government and Defence Market by Region, 2023-2033 (US$ Bn, AGR (%))
Figure 44 Other Verticals Market by Region, 2023-2033 (US$ Bn, AGR (%))
Figure 45 Green Data Center Market by Region, 2023-2033 (US$ Bn, AGR (%))
Figure 46 North America Green Data Centre Market Attractiveness Index
Figure 47 North America Green Data Center Market by Value, 2023-2033 (US$ Bn, AGR (%))
Figure 48 North America Green Data Center Market by Country, 2023-2033 (US$ Bn, AGR (%))
Figure 49 North America Green Data Center Market Share Forecast by Country, 2023-2033 (%)
Figure 50 North America Green Data Center Market by Size, 2023-2033 (US$ Bn, AGR (%))
Figure 51 North America Green Data Center Market Share Forecast by Size, 2023-2033 (%)
Figure 52 North America Green Data Center Market by Component, 2023-2033 (US$ Bn, AGR (%))
Figure 53 North America Green Data Center Market Share Forecast by Components, 2023-2033 (%)
Figure 54 North America Green Data Center Market by Technology, 2023-2033 (US$ Bn, AGR (%))
Figure 55 North America Green Data Center Market Share Forecast by Technology, 2023-2033 (%)
Figure 56 North America Green Data Center Market by System, 2023-2033 (US$ Bn, AGR (%))
Figure 57 North America Green Data Center Market Share Forecast by System, 2023-2033 (%)
Figure 58 North America Green Data Center Market by Vertical, 2023-2033 (US$ Bn, AGR (%))
Figure 59 North America Green Data Center Market Share Forecast by Vertical, 2023-2033 (%)
Figure 60 US Green Data Center Market by Value, 2023-2033 (US$ Bn, AGR (%))
Figure 61 Canada Green Data Center Market by Value, 2023-2033 (US$ Bn, AGR (%))
Figure 62 Europe Green Data Centre Market Attractiveness Index
Figure 63 Europe Green Data Center Market by Value, 2023-2033 (US$ Bn, AGR (%))
Figure 64 Europe Green Data Center Market by Country, 2023-2033 (US$ Bn, AGR (%))
Figure 65 Europe Green Data Center Market Share Forecast by Country, 2023-2033 (%)
Figure 66 Europe Green Data Center Market by Size, 2023-2033 (US$ Bn, AGR (%))
Figure 67 Europe Green Data Center Market Share Forecast by Size, 2023-2033 (%)
Figure 68 Europe Green Data Center Market by Component, 2023-2033 (US$ Bn, AGR (%))
Figure 69 Europe Green Data Center Market Share Forecast by Components, 2023-2033 (%)
Figure 70 Europe Green Data Center Market by Technology, 2023-2033 (US$ Bn, AGR (%))
Figure 71 Europe Green Data Center Market Share Forecast by Technology, 2023-2033 (%)
Figure 72 Europe Green Data Center Market by System, 2023-2033 (US$ Bn, AGR (%))
Figure 73 Europe Green Data Center Market Share Forecast by System, 2023-2033 (%)
Figure 74 Europe Green Data Center Market by Vertical, 2023-2033 (US$ Bn, AGR (%))
Figure 75 Europe Green Data Center Market Share Forecast by Vertical, 2023-2033 (%)
Figure 76 Germany Green Data Center Market by Value, 2023-2033 (US$ Bn, AGR (%))
Figure 77 UK Green Data Center Market by Value, 2023-2033 (US$ Bn, AGR (%))
Figure 78 France Green Data Center Market by Value, 2023-2033 (US$ Bn, AGR (%))
Figure 79 Italy Green Data Center Market by Value, 2023-2033 (US$ Bn, AGR (%))
Figure 80 Spain Green Data Center Market by Value, 2023-2033 (US$ Bn, AGR (%))
Figure 81 Rest of Europe Green Data Center Market by Value, 2023-2033 (US$ Bn, AGR (%))
Figure 82 Asia-Pacific Green Data Centre Market Attractiveness Index
Figure 83 Asia-Pacific Green Data Center Market by Value, 2023-2033 (US$ Bn, AGR (%))
Figure 84 Asia-Pacific Green Data Center Market by Country, 2023-2033 (US$ Bn, AGR (%))
Figure 85 Asia-Pacific Green Data Center Market Share Forecast by Country, 2023-2033 (%)
Figure 86 Asia-Pacific Green Data Center Market by Size, 2023-2033 (US$ Bn, AGR (%))
Figure 87 Asia-Pacific Green Data Center Market Share Forecast by Size, 2023-2033 (%)
Figure 88 Asia-Pacific Green Data Center Market by Component, 2023-2033 (US$ Bn, AGR (%))
Figure 89 Asia-Pacific Green Data Center Market Share Forecast by Components, 2023-2033 (%)
Figure 90 Asia-Pacific Green Data Center Market by Technology, 2023-2033 (US$ Bn, AGR (%))
Figure 91 Asia-Pacific Green Data Center Market Share Forecast by Technology, 2023-2033 (%)
Figure 92 Asia-Pacific Green Data Center Market by System, 2023-2033 (US$ Bn, AGR (%))
Figure 93 Asia-Pacific Green Data Center Market Share Forecast by System, 2023-2033 (%)
Figure 94 Asia-Pacific Green Data Center Market by Vertical, 2023-2033 (US$ Bn, AGR (%))
Figure 95 Asia-Pacific Green Data Center Market Share Forecast by Vertical, 2023-2033 (%)
Figure 96 China Green Data Center Market by Value, 2023-2033 (US$ Bn, AGR (%))
Figure 97 Singapore Green Data Center Market by Value, 2023-2033 (US$ Bn, AGR (%))
Figure 98 Hong Kong Green Data Center Market by Value, 2023-2033 (US$ Bn, AGR (%))
Figure 99 Japan Green Data Center Market by Value, 2023-2033 (US$ Bn, AGR (%))
Figure 100 India Green Data Center Market by Value, 2023-2033 (US$ Bn, AGR (%))
Figure 101 Rest of Asia-Pacific Green Data Center Market by Value, 2023-2033 (US$ Bn, AGR (%))
Figure 102 Middle East & Africa Green Data Centre Market Attractiveness Index
Figure 103 Middle East & Africa Green Data Center Market by Value, 2023-2033 (US$ Bn, AGR (%))
Figure 104 Middle East & Africa Green Data Center Market by Country, 2023-2033 (US$ Bn, AGR (%))
Figure 105 Middle East & Africa Green Data Center Market Share Forecast by Country, 2023-2033 (%)
Figure 106 Middle East & Africa Green Data Center Market by Size, 2023-2033 (US$ Bn, AGR (%))
Figure 107 Middle East & Africa Green Data Center Market Share Forecast by Size, 2023-2033 (%)
Figure 108 Middle East & Africa Green Data Center Market by Component, 2023-2033 (US$ Bn, AGR (%))
Figure 109 Middle East & Africa Green Data Center Market Share Forecast by Components, 2023-2033 (%)
Figure 110 Middle East & Africa Green Data Center Market by Technology, 2023-2033 (US$ Bn, AGR (%))
Figure 111 Middle East & Africa Green Data Center Market Share Forecast by Technology, 2023-2033 (%)
Figure 112 Middle East & Africa Green Data Center Market by System, 2023-2033 (US$ Bn, AGR (%))
Figure 113 Middle East & Africa Green Data Center Market Share Forecast by System, 2023-2033 (%)
Figure 114 Middle East & Africa Green Data Center Market by Vertical, 2023-2033 (US$ Bn, AGR (%))
Figure 115 Middle East & Africa Green Data Center Market Share Forecast by Vertical, 2023-2033 (%)
Figure 116 GCC Green Data Center Market by Value, 2023-2033 (US$ Bn, AGR (%))
Figure 117 South Africa Green Data Center Market by Value, 2023-2033 (US$ Bn, AGR (%))
Figure 118 Rest of Middle East & Africa Green Data Center Market by Value, 2023-2033 (US$ Bn, AGR (%))
Figure 119 Latin America Green Data Centre Market Attractiveness Index
Figure 120 Latin America Green Data Center Market by Value, 2023-2033 (US$ Bn, AGR (%))
Figure 121 Latin America Green Data Center Market by Country, 2023-2033 (US$ Bn, AGR (%))
Figure 122 Latin America Green Data Center Market Share Forecast by Country, 2023-2033 (%)
Figure 123 Latin America Green Data Center Market by Size, 2023-2033 (US$ Bn, AGR (%))
Figure 124 Latin America Green Data Center Market Share Forecast by Size, 2023-2033 (%)
Figure 125 Latin America Green Data Center Market by Component, 2023-2033 (US$ Bn, AGR (%))
Figure 126 Latin America Green Data Center Market Share Forecast by Components, 2023-2033 (%)
Figure 127 Latin America Green Data Center Market by Technology, 2023-2033 (US$ Bn, AGR (%))
Figure 128 Latin America Green Data Center Market Share Forecast by Technology, 2023-2033 (%)
Figure 129 Latin America Green Data Center Market by System, 2023-2033 (US$ Bn, AGR (%))
Figure 130 Latin America Green Data Center Market Share Forecast by System, 2023-2033 (%)
Figure 131 Latin America Green Data Center Market by Vertical, 2023-2033 (US$ Bn, AGR (%))
Figure 132 Latin America Green Data Center Market Share Forecast by Vertical, 2023-2033 (%)
Figure 133 Brazil Green Data Center Market by Value, 2023-2033 (US$ Bn, AGR (%))
Figure 134 Mexico Green Data Center Market by Value, 2023-2033 (US$ Bn, AGR (%))
Figure 135 Rest of Latin America Green Data Center Market by Value, 2023-2033 (US$ Bn, AGR (%))
Figure 136 Green Data Centre Market: Company Share/Ranking, 2022
Figure 137 Schneider Electric SE: Net Revenue, 2018-2022 (US$ million, AGR%)
Figure 138 Schneider Electric SE: Gross Profit, 2018-2022 (US$ million, AGR%)
Figure 139 Schneider Electric SE: R&D, 2018-2022 (US$ million, AGR%)
Figure 140 Hewlett Packard Enterprise Company (HPE): Net Revenue, 2018-2022 (US$ million, AGR%)
Figure 141 Hewlett Packard Enterprise Company (HPE): Gross Profit, 2018-2022 (US$ million, AGR%)
Figure 142 Hewlett Packard Enterprise Company (HPE): R&D, 2018-2022 (US$ million, AGR%)
Figure 143 Cisco Systems, Inc: Net Revenue, 2018-2022 (US$ million, AGR%)
Figure 144 Cisco Systems, Inc: Gross Profit, 2018-2022 (US$ million, AGR%)
Figure 145 Cisco Systems, Inc: R&D, 2018-2022 (US$ million, AGR%)
Figure 146 Dell Inc.: Net Revenue, 2018-2022 (US$ million, AGR%)
Figure 147 Dell Inc.: Gross Profit, 2018-2022 (US$ million, AGR%)
Figure 148 Dell Inc.: R&D, 2018-2022 (US$ million, AGR%)
Figure 149 Lenovo Group Limited: Net Revenue, 2018-2022 (US$ million, AGR%)
Figure 150 Lenovo Group Limited: Gross Profit, 2018-2022 (US$ million, AGR%)
Figure 151 Lenovo Group Limited: R&D, 2018-2022 (US$ million, AGR%)
List of Companies Profiled in the report
Asetek A/S
Cisco Systems, Inc.
Dell Inc.
Delta Electronics, Inc.
Green Revolution Cooling
Hewlett Packard Enterprise Company (HPE)
Lenovo Group Limited
Midas Green Technologies
Nortek Air Solutions, LLC
Schneider Electric SE
List of Other Companies Mentioned in the report
21Vianet
ABB
AECOM
Amazon Web Services
Bloom Energy
China Telecom Global
Cisco
Cologix
CyrusOne
Dell
Digital Realty
DigitalOcean
Eaton
Equinix
Fujitsu
GDS Holdings
Google
Green House Data
H5 Data Centers
Hewlett Packard Enterprise
Hostway
Huawei
IBM
Infomart Data Centers
Intel
Interxion
iomart
Iron Mountain
IronOrbit
Johnson Controls
Joyent
Lenovo
Liquid Web
Microsoft
Netwise Hosting
NTT Communications
OVHcloud
QTS Data Centers
Rittal
Schneider Electric
ServerFarm
Siemens
SingleHop
Stack Infrastructure
Supermicro
Switch
Vertiv
vXchnge
Zayo Group
Zenlayer
List of Associations Mentioned in the Report
The Alliance for Telecommunications Industry Solutions
The Climate Group
The Cloud Native Computing Foundation
The Data Center Alliance
The Data Centre Alliance
The Digital Energy and Sustainability Solutions Campaign
The Digital Infrastructure Industry Coalition
The Energy Efficient High Performance Computing Working Group
The Environmental Defence Fund
The European Data Centre Association
The Green Grid
The Green IT Council
The International Association of Cloud and Managed Service Providers
The International Association of Computer Science and Information Technology
The International Association of Information Technology Asset Managers
The International Data Centre Group
The Open Compute Project Foundation
The Renewable Energy Buyers Alliance
The Sustainable Digital Infrastructure Alliance
U.S. Green Building Council