Industries > Pharma > Global Rheumatoid Arthritis Drugs Market Forecast 2020-2030
Global Rheumatoid Arthritis Drugs Market Forecast 2020-2030
Biologics, Non-Biologics, NSAIDs, sDMARDs and Others
The global Rheumatoid Arthritis market is estimated to have reached $58bn in 2018 and is expected to grow at a CAGR of 0.6% in the second half of the forecast period. In 2018, the biologics submarket held 85% of the global Rheumatoid Arthritis market.
How this report will benefit you
Read on to discover how you can exploit the future business opportunities emerging in this sector.
In this brand new 236-page report you will receive 180 tables and 121 figures– all unavailable elsewhere.
The 236-page report provides clear detailed insight into the rheumatoid arthritis market. Discover the key drivers and challenges affecting the market.
By ordering and reading our brand-new report today you stay better informed and ready to act.
Report Scope
• Global Rheumatoid Arthritis Market forecast from 2020-2030
• Revenue forecasts for the Rheumatoid Arthritis Market by Drug Class from 2020-2030:
• Biologics
• Non-Biologics: NSAIDs, sDMARDs, Others
• Revenue forecasts for the Rheumatoid Arthritis Market by Drugs from 2020-2030:
• Humira
• Enbrel
• Remicade
• Rituxan/MabThera
• Simponi/Simponi Aria
• Orencia
• Actemra/Roactemra
• Cimzia
• Celebrex
• Xeljanz
• Arcoxia
• Others
• Revenue forecasts for the Rheumatoid Arthritis Market by Region from 2020-2029:
• North America: U.S., Canada
• Europe: Germany, UK, France, Italy, Spain, Russia, Rest of Europe
• Asia-Pacific: Japan, China, India, Rest of Asia-Pacific
• Latin America: Brazil, Mexico, Rest of Latin America
• Middle East & Africa: Saudi Arabia, South Africa, Rest of MEA
• Profiles of these selected leading companies:
• AbbVie
• Amgen, Inc.
• Bristol-Myers Squibb
• Eli Lilly and Company
• F. Hoffmann-La Roche Ltd
• Johnson & Johnson
• Merck & Co.
• Novartis AG
• Pfizer
• Sanofi S.A.
• UCB
• Analysis of the Drivers, Restraints, Opportunities and Threats of the global rheumatoid arthritis drugs market
• The report also includes SWOT Analysis of the Global rheumatoid arthritis drugs market
• Key questions answered by this report:
• How is the Rheumatoid Arthritis drugs market evolving?
• What is driving and restraining the Rheumatoid Arthritis drugs market?
• What are the market shares of each segment of the overall Rheumatoid Arthritis drugs market in 2018?
• How will each Rheumatoid Arthritis drugs submarket segment grow over the forecast period and how much revenue will these submarkets account for in 2030?
• How will the market shares for each Rheumatoid Arthritis drugs submarket develop from 2020 to 2030?
• Which individual therapies will prevail and how will these shifts be responded to?
• What will be the main driver for the overall market from 2020 to 2030?
• How will the market shares of the national markets change by 2030 and which geographical region will lead the market in 2030?
• Who are the leading players and what are their prospects over the forecast period?
• How will the industry evolve during the period between 2020 and 2030?
Visiongain’s study is intended for anyone requiring commercial analyses for the Global Rheumatoid Arthritis Drugs Market. You find data, trends and predictions.
Buy our report today Rheumatoid Arthritis Drugs Market : Prospects for Biologics, Non-Biologics (NSAIDs, sDMARDs and Others).
Visiongain is a trading partner with the US Federal Government
CCR Ref number: KD4R6
Do you have any custom requirements we can help you with? Any need for specific country, geo region, market segment or specific company information? Contact us today, we can discuss your needs and see how we can help: sara.peerun@visiongain.com
1. Report Overview
1.1 Global Rheumatoid Arthritis Drugs Market Overview
1.2 Overview of Findings
1.3 Structure of the Report
1.4 Global Rheumatoid Arthritis Drugs Market Segmentation
1.5 Why You Should Read This Report
1.6 How This Report Delivers
1.7 Key Questions Answered by This Analytical Report
1.8. Who is This Report For?
1.9 Methodology
1.10 Associated Visiongain Reports
1.11 About Visiongain
2. Introduction to Rheumatoid Arthritis Drugs
2.1 What is Rheumatoid Arthritis?
2.2 What Causes Rheumatoid Arthritis?
2.3. How Does the Disease Develop?
2.4. How Can It Be Monitored?
2.5. Can RA Be Cured?
2.6. Performance Criteria Used in Clinical Trials
2.6.1. ACR Criteria for Drug Efficacy
2.6.2. HAQ-DI Measures Daily Activities
2.6.3. mSS Assesses Disease on X-Ray
2.6.4. DAS28 For Disease Severity
2.7. How is RA Treated?
2.7.1 Biologic DMARDs Are the Dominant Source of Revenue
2.7.2 Synthetic DMARDs are the Mainstay of Treatment
2.7.3 Others
2.7.3.1 Non-Steroidal Anti-Inflammatory Drugs (NSAIDs)
2.7.3.2 Corticosteroids for Rapid Anti-Inflammatory Effect
2.7.3.3 Analgesics for Rapid Pain Relief
2.8 Comorbid Conditions Associated with RA
2.9 Prevalence and Incidence Rates of Rheumatoid Arthritis
3. Rheumatoid Arthritis Drugs Market, 2020-2030
3.1 The Global Rheumatoid Arthritis Drugs Market: Market Overview
3.2 Global Rheumatoid Arthritis Drugs Market: Revenue Forecast 2020-2030
3.3 Global Rheumatoid Arthritis Drugs Market: Market Forecast 2020-2030
3.4 Changing Market Shares by Segment 2020-2030
3.5 Non-Biologics for RA
3.5.1 NSAIDs: Revenue Forecast, 2020-2030
3.5.2 Synthetic DMARDs (sDMARDs): Revenue Forecast, 2018-2030
3.5.3 Others: Revenue Forecast, 2018-2030
4. Leading Drugs in the Rheumatoid Arthritis Market 2020-2030
4.1 The Main Drugs in the Rheumatoid Arthritis Market, 2018
4.2 Humira: A Major Source of Revenue for AbbVie
4.2.1 Adalimumab Biosimilars
4.2.2 Humira: Sales Forecast 2020-2030
4.3 Enbrel: Amgen’s Revenue Protected Until 2030
4.3.1 Etanercept Biosimilars
4.3.2 Enbrel: Revenue Forecast 2020-2030
4.4 Remicade: Facing Significant Competition from Biosimilars
4.4.1 Infliximab Biosimilars
4.4.2 Remicade: Revenue Forecast 2018-2030
4.5 Rituxan: Facing Declining Market Share
4.5.1 Rituximab Biosimilars
4.5.2 Rituxan: Revenue Forecast 2018-2030
4.6 Simponi (golimumab): Market Share Remaining Stable
4.6.1 Simponi/Simponi Aria: Revenue Forecast 2018-2030
4.7 Orencia: Additional Indications Being Explored
4.7.1 Abatacept Biosimilars
4.7.2 Orencia: Revenue Forecast 2018-2030
4.8 Actemra/RoActemra: First IL-6R Inhibitor Approved for RA
4.8.1 Tocilizumab Biosimilars
4.8.2 Actemra/RoActemra: Revenue Forecast 2018-2030
4.9 Cimzia: Reliable Source of Income for UCB
4.9.1 Certolizumab Biosimilars
4.9.2 Cimzia: Revenue Forecast 2018-2030
4.10 Celebrex: Facing Generic Competition
4.10.1 Celebrex: Revenue Forecast 2018-2030
4.11 Xeljanz: Good Opportunity for Revenue Growth
4.11.1 Xeljanz: Revenue Forecast 2018-2030
4.12 Arcoxia: Sales Revenue Already Declining
4.12.1 Arcoxia: Revenue Forecast 2018-2030
5. Leading National Markets 2020-2030
5.1. Geographical Breakdown of the World Rheumatoid Arthritis Drugs Market
5.2 World Rheumatoid Arthritis Drugs Market: Regional Forecast 2020-2030
5.2.1 How Will Regional Market Shares Change to 2030?
6. North America Rheumatoid Arthritis Drugs Market, 2020-2030
6.1. US Rheumatoid Arthritis Drugs Market: Market Forecast 2020-2030
6.2. Canada Rheumatoid Arthritis Drugs Market: Trends and Developments
7. Europe Rheumatoid Arthritis Drugs Market 2020-2030
7.1 Europe Markets: Changing Market Shares by Country, 2020-2030
7.2. Germany Rheumatoid Arthritis Drugs Market: Market Forecast 2020-2030
7.3. France Rheumatoid Arthritis Drugs Market: Trends and Developments
7.4. U.K. Rheumatoid Arthritis Drugs Market: Market Forecast 2020-2030
7.5. Italy Rheumatoid Arthritis Drugs Market: Trends and Developments
7.6. Spain Rheumatoid Arthritis Drugs Market: Market Forecast 2020-2030
7.7. Russia Rheumatoid Arthritis Drugs Market: Trends and Developments
7.8. Rest of Europe Rheumatoid Arthritis Drugs Market: Market Forecast 2020-2030
8. Asia-Pacific Rheumatoid Arthritis Drugs Market 2020-2030
8.1. Japan Rheumatoid Arthritis Drugs Market: Market Forecast 2020-2030
8.2. China Rheumatoid Arthritis Drugs Market: Trends and Developments
8.3. India Rheumatoid Arthritis Drugs Market: Market Forecast 2020-2030
8.4. Rest of Asia Pacific Rheumatoid Arthritis Drugs Market: Trends and Developments
9. Latin America Rheumatoid Arthritis Drugs Market, 2020-2030
9.1. Brazil Rheumatoid Arthritis Drugs Market: Market Forecast 2020-2030
9.2. Mexico Rheumatoid Arthritis Drugs Market: Trends and Developments
9.3. Rest of Latin America Rheumatoid Arthritis Drugs Market: Trends and Developments
10. Middle East & Africa Rheumatoid Arthritis Drugs Market, 2020-2030
10.1. Saudi Arabia Rheumatoid Arthritis Drugs Market: Market Forecast 2020-2030
10.2. South Africa Rheumatoid Arthritis Drugs Market: Trends and Developments
10.3. Rest of Middle East & Africa Rheumatoid Arthritis Drugs Market: Trends and Developments
11. Rheumatoid Arthritis R&D Pipeline 2019
12. Leading Companies in the Rheumatoid Arthritis Drugs Market, 2019
12.1 Introduction to the Leading Companies
12.2 AbbVie: Secured Multiple Patents for Humira
12.2.1 Overview
12.2.2 AbbVie: Rheumatoid Arthritis Drugs Product Portfolio
11.2.3 AbbVie: Financial Overview
12.2.4 AbbVie: Recent Transactions Summary
12.3 F. Hoffmann-La Roche Ltd (Roche)
12.3.1 Overview
12.3.2 Roche: Financial Overview
12.3.3 Recent Transactions Summary
12.4 Johnson & Johnson
12.4.1 Overview
12.4.2 Johnson & Johnson: Financial Overview
12.4.3 Johnson & Johnson: Recent Transactions Summary
11.5. Amgen, Inc.
12.5.1 Overview
12.5.2 Amgen Inc.: Financial Overview
12.5.3. Amgen Inc.: Recent Transactions Summary
12.6. Pfizer: Actively Developing Biosimilars
12.6.1 Overview
12.6.2 Pfizer, Inc.: Financial Overview
12.6.3 Pfizer, Inc.: Recent Transactions Summary
12.7 Merck & Co., Inc.: Remicade Sales in Decline
12.7.1. Overview
12.7.2 Merck & Co., Inc.: Financial Overview
12.7.3 Merck & Co., Inc.: Recent Transactions Summary
12.8. Bristol-Myers Squibb (BMS): Exploring Additional Indications for Orencia
12.8.1. Overview
12.8.2 Bristol-Myers Squibb: Financial Overview
12.8.3 Bristol-Myers Squibb: Recent Developments
12.9. UCB: Reliant on Cimzia Revenue
12.9.1 Overview
12.9.2 UCB: Financial Overview
12.9.3 UCB: Recent Developments
12.10. Eli Lilly and Company
12.10.1 Eli Lilly and Company: Rheumatoid Arthritis Drugs Portfolio
12.10.2 Eli Lilly and Company: Financial Overview
12.10.3 Eli Lilly and Company: Recent Transactions Summary
12.11. Novartis AG
12.11.1 Novartis AG: Rheumatoid Arthritis Drugs Portfolio
12.11.2 Novartis AG: Financial Overview
12.11.3 Novartis AG: Recent Transactions Summary
12.12. Sanofi S.A. (Sanofi)
12.12.1 Sanofi S.A.: Rheumatoid Arthritis Drugs Portfolio
12.12.2 Sanofi: Financial Overview
12.12.3 Sanofi S.A.: Recent Transactions Summary
13. Qualitative Analysis of the Rheumatoid Arthritis Market
13.1 Strengths and Weaknesses of the Rheumatoid Arthritis Market
13.1.1 Strengths
13.1.1.1 Number of Elderly Patients Expected to Rise
13.1.1.2 Biologics Already Recognised as a Valuable Part of Treatment
13.1.1.3 Biologics Used in RA Often Have Multiple Indications
13.1.2 Weaknesses
13.1.2.1 Some Patients Have an Inadequate Treatment Response
13.1.2.2. Efficacy of Drugs Can Diminish Over Time
13.1.3. Opportunities
13.1.3.1 Need for Effective Drugs with Better Safety Profiles
13.1.3.2 Need for Less Invasive Route of Administration
13.1.4. Threats
13.1.4.1 High Number of Products Will Saturate Market
13.1.4.2 Competition from Biosimilars Will Increase
13.2 Social, Technological, Economic and Political Factors Affecting the Rheumatoid Arthritis Market (STEP Analysis)
13.2.1 Social Factors Influencing the Rheumatoid Arthritis Market
13.2.2 Technological Factors Influencing the Rheumatoid Arthritis Market
13.2.3 Economic Factors Influencing the Rheumatoid Arthritis Market
13.2.4 Political Factors Influencing the Rheumatoid Arthritis Market
13.2.4.1 Government Pressure to Control Costs
13.2.4.2 Inter-country Variability in Biosimilar Approval Process
14. Conclusions
14.1 Overview of Current Market Conditions and Market Forecast
14.2 Biologics Will Remain Dominant Drug Class but their Market Share Will Drop More than 20%
14.3 Enbrel Will Overtake Humira as the Leading Drug
14.4 Leading Regions in the Rheumatoid Arthritis Market in 2018
14.5 Trends in the RA Drugs Market
Appendices
Associated Visiongain Reports
Visiongain Report Sales Order Form
About Visiongain
Visiongain Report Evaluation Form
List of Table
Table 2.1 Biologic Agents and Mechanism of Action
Table 2.2 Comorbidities Associated with RA in Different Organs
Table 2.3 Prevalence rate of RA in Different Countries
Table 3.1 Rheumatoid Arthritis Drugs Market by Submarket, 2018
Table 3.2 The Global Rheumatoid Arthritis Drugs Market: Revenue ($m) and Market Shares (%) by Type, 2018 and 2019
Table 3.3 Global Rheumatoid Arthritis Drugs Market Forecast: Revenues ($m), AGR (%), CAGR (%), 2018-2030
Table 3.4 Global Rheumatoid Arthritis Drugs Market Forecast: Revenues ($m), AGR (%),
CAGR (%), 2018-2030
Table 3.5 Global Rheumatoid Arthritis Drugs Market by Drugs Class: CAGR (%), 2020-
2024, 2024-2030, 2020-2030
Table 3.6 Non-Biologics for Rheumatoid Arthritis Market Forecast: Revenues ($m), AGR
(%), CAGR (%), 2018-2030
Table 3.7 NSAIDs for Rheumatoid Arthritis Market Forecasts: Revenue ($m), AGR (%)
and CAGR (%), 2018-2030
Table 3.8 sDMARDs for Rheumatoid Arthritis Market Forecasts: Revenue ($m), AGR (%)
and CAGR (%), 2018-2030
Table 3.9 Others for Rheumatoid Arthritis Forecasts: Revenue ($m), AGR (%) and CAGR
(%), 2018-2030
Table 4.1 Global Rheumatoid Arthritis Market by Drugs Classs: Revenue ($m), and
Market Share (%), 2018
Table 4.2 The Main Drugs in the Rheumatoid Arthritis Market Forecasts: Revenue
($m), AGR (%) and CAGR (%), 2018-2030
Table 4.3 The Main Drugs in the Rheumatoid Arthritis Market Forecasts: Revenue ($m), AGR (%) and CAGR (%), 2018-2030
Table 4.4 The Main Drugs in the Rheumatoid Arthritis Market Forecasts: Revenue ($m), AGR (%) and CAGR (%), 2018-2030
Table 4.5 Humira: Key Facts
Table 4.6 Adalimumab Biosimilars: Current Status, 2019
Table 4.7 Global Humira Market Forecast: Revenues ($m) AGR (%), CAGR (%), 2018-2030
Table 4.8 Enbrel: Key Facts
Table 4.9 Etanercept Biosimilars: Current Status, 2019
Table 4.10 Global Enbrel Market Forecast: Revenues ($m) AGR (%), CAGR (%), 2018-
2030
Table 4.11 Remicade: Key Facts
Table 4.12 Infliximab Biosimilars: Current Status, 2019
Table 4.13 Global Remicade Market Forecast: Revenues ($m) AGR (%), CAGR (%), 2018-2030
Table 4.14 Rituxan: Key Facts
Table 4.15 Rituximab Biosimilars: Current Status, 2019
Table 4.16 Global Rituxan Market Forecast: Revenues ($m) AGR (%), CAGR (%), 2018-2030
Table 4.17 Simponi: Key Facts
Table 4.18 Global Simponi/Simponi Aria Market Forecast: Revenues ($m) AGR (%), CAGR (%), 2018-2030
Table 4.19 Orencia: Key Facts
Table 4.20 Global Orencia Market Forecast: Revenues ($m) AGR (%), CAGR (%), 2018-2030
Table 4.21 Actemra/RoActemra: Key Facts
Table 4.22 Global Actemra/RoActemra Market Forecast: Revenues ($m) AGR (%), CAGR (%), 2018-2030
Table 4.23 Cimzia: Key Facts
Table 4.24 Global Cimzia Market Forecast: Revenues ($m) AGR (%), CAGR (%), 2018-2030
Table 4.25 Celebrex: Key Facts
Table 4.26 Global Celebrex Market Forecast: Revenues ($m) AGR (%), CAGR (%), 2018-2030
Table 4.27 Xeljanz: Key Facts
Table 4.28 Global Xeljanz Market Forecast: Revenues ($m) AGR (%), CAGR (%), 2018-2030
Table 4.29 Arcoxia: Key Facts
Table 4.30 Global Arcoxia Market Forecast: Revenues ($m) AGR (%), CAGR (%), 2018-2030
Table 5.1 Global Rheumatoid Arthritis Drugs Market by Region: Revenue ($ m), 2018 and
2019
Table 5.2 Global Rheumatoid Arthritis Drugs Market Forecast: Revenues ($ m), AGR (%),
CAGR (%), 2018-2030
Table 5.3 Global Rheumatoid Arthritis Drugs Market by Region: CAGR (%), 2020-2024,
2024-2030, 2020-2030
Table 5.4 Global Rheumatoid Arthritis Drugs Market by Region: Market Share (%), 2019, 2024, 2030
Table 6.1 North America Rheumatoid Arthritis Drugs Market Forecast by Class: Revenues
($m), AGR (%), CAGR (%), 2018-2030
Table 6.2 North America Rheumatoid Arthritis Drugs (Non-Biologics) Market Forecast by
Segment: Revenues ($m), AGR (%), CAGR (%), 2018-2030
Table 6.3 North America Rheumatoid Arthritis Drugs Market Forecast by Class: Revenues
($ m), AGR (%), CAGR (%), 2018-2030
Table 6.4 U.S.Rheumatoid Arthritis Drugs Market Forecast: Revenues ($m), AGR (%),
CAGR (%), 2018-2030
Table 6.5 Canada Rheumatoid Arthritis Drugs Market Forecast: Revenues ($m), AGR
(%), CAGR (%), 2018-2030
Table 7.1 Europe Rheumatoid Arthritis Drugs Market by Country/Sub-region: Revenue
($m) and Market Share (%), 2018
Table 7.2 Europe Rheumatoid Arthritis Drugs Market Forecast by Class: Revenues ($m),
AGR (%), CAGR (%), 2018-2030
Table 7.3 Europe Rheumatoid Arthritis Drugs (Non-Biologics) Market Forecast by
Segment: Revenues ($m), AGR (%), CAGR (%), 2018-2030
Table 7.4 Global Rheumatoid Arthritis Drugs Market Forecast: Revenues ($m), AGR (%),
CAGR (%), 2018-2030
Table 7.5 Europe Rheumatoid Arthritis Drugs Market Forecast by Class: Revenues ($m),
AGR (%), CAGR (%), 2018-2030
Table 7.6 Global Rheumatoid Arthritis Drugs Market by Region: CAGR (%), 2020-2024,
2024-2030, and 2020-2030
Table 7.7 Germany Rheumatoid Arthritis Drugs Market Forecast by Country: Revenues ($
m), AGR (%), CAGR (%), 2018-2030
Table 7.8 France Rheumatoid Arthritis Drugs Market Forecast: Revenues ($m), AGR (%),
CAGR (%), 2018-2030
Table 7.9 U.K.Rheumatoid Arthritis Drugs Market Forecast by Country: Revenues ($m),
AGR (%), CAGR (%), 2018-2030
Table 7.10 Italy Rheumatoid Arthritis Drugs Market Forecast: Revenues ($m), AGR (%),
CAGR (%), 2018-2030
Table 7.11 Spain Rheumatoid Arthritis Drugs Market Forecast by Country: Revenues
($m), AGR (%), CAGR (%), 2018-2030
Table 7.12 Russia Rheumatoid Arthritis Drugs Market Forecast: Revenues ($m), AGR
(%), CAGR (%), 2018-2030
Table 7.13 Rest of Europe Rheumatoid Arthritis Drugs Market Forecast by Country:
Revenues ($ m), AGR (%), CAGR (%), 2018-2030
Table 8.1 Global Rheumatoid Arthritis Drugs Market by Country/Sub-region: Revenue ($
m) and Market Share (%), 2018
Table 8.2 Asia Pacific Rheumatoid Arthritis Drugs Market Forecast by Class: Revenues
($m), AGR (%), CAGR (%), 2018-2030
Table 8.3 Asia Pacific Rheumatoid Arthritis Drugs (Non-Biologics) Market Forecast by
Segment: Revenues ($m), AGR (%), CAGR (%), 2018-2030
Table 8.4 Asia-Pacific Rheumatoid Arthritis Drugs Market Forecast by Country: Revenues
($m), AGR (%), CAGR (%), 2018-2030
Table 8.5 Japan Rheumatoid Arthritis Drugs Market Forecast by Country: Revenues ($m),
AGR (%), CAGR (%), 2018-2030
Table 8.6 China Rheumatoid Arthritis Drugs Market Forecast: Revenues ($m), AGR (%),
CAGR (%), 2018-2030
Table 8.7 India Rheumatoid Arthritis Drugs Market Forecast: Revenues ($m), AGR (%),
CAGR (%), 2018-2030
Table 8.8 Rest of Asia Pacific Rheumatoid Arthritis Drugs Market Forecast: Revenues
($m), AGR (%), CAGR (%), 2018-2030
Table 9.1 Latin America Rheumatoid Arthritis Drugs Market by Country/Sub-region:
Revenue ($m) and Market Share (%), 2018
Table 9.2 Latin America Rheumatoid Arthritis Drugs Market Forecast by Class: Revenues
($m), AGR (%), CAGR (%), 2018-2030
Table 9.3 Latin America Rheumatoid Arthritis Drugs (Non-Biologics) Market Forecast by
Segment: Revenues ($m), AGR (%), CAGR (%), 2018-2030
Table 9.4 Latin America Rheumatoid Arthritis Drugs Market Forecast by Country:
Revenues ($m), AGR (%), CAGR (%), 2018-2030
Table 9.5 Brazil Rheumatoid Arthritis Drugs Market Forecast, By Country: Revenues
($m), AGR (%), CAGR (%), 2018-2030
Table 9.6 Mexico Rheumatoid Arthritis Drugs Market Forecast: Revenues ($m), AGR (%),
CAGR (%), 2018-2030
Table 9.7 Rest of Latin America Rheumatoid Arthritis Drugs Market Forecast: Revenues
($m), AGR (%), CAGR (%), 2018-2030
Table 10.1 Middle East & Africa Rheumatoid Arthritis Drugs Market by Country/Sub-
region: Revenue ($ m) and Market Share (%), 2018
Table 10.2 Middle East & Africa Rheumatoid Arthritis Drugs Market Forecast by Class:
Revenues ($ m), AGR (%), CAGR (%), 2018-2030
Table 10.3 Middle East & Africa Rheumatoid Arthritis Drugs (Non-Biologics) Market
Forecast by Segment: Revenues ($ m), AGR (%), CAGR (%), 2018-2030
Table 10.4 Middle East & Africa Rheumatoid Arthritis Drugs Market Forecast by Country:
Revenues ($m), AGR (%), CAGR (%), 2018-2030
Table 10.5 Saudi Arabia Rheumatoid Arthritis Drugs Market Forecast by Country:
Revenues ($m), AGR (%), CAGR (%), 2018-2030
Table 10.6 South Africa Rheumatoid Arthritis Drugs Market Forecast: Revenues ($ m),
AGR (%), CAGR (%), 2018-2030
Table 10.7 Rest of Middle East & Africa Rheumatoid Arthritis Drugs Market Forecast:
Revenues ($m), AGR (%), CAGR (%), 2018-2030
Table 11.1 Pipeline R&D Products, 2019
Table 11.2 Other RA Pipeline R&D Products, 2019
Table 12.1 Leading Companies in the RA Drug Market: Revenue ($m) and Market Share
(%), 2018
Table 12.2 AbbVie: Breakdown of Revenue ($m,%) by RA Drug, 2018
Table 12.3 AbbVie: Overview, 2019
Table 12.4 AbbVie: Revenue ($m), AGR (%), 2014-2018
Table 12.5 F.Hoffmann-La Roche AG:: Breakdown of Revenue ($m,%) by RA Drug, 2018
Table 12.6. Roche: Overview, 2019
Table 12.7 Roche: Revenue ($m), AGR (%), 2014-2018
Table 12.8 Johnson & Johnson: Breakdown of Revenue ($m,%) by RA Drug, 2018
Table 12.9. Johnson & Johnson: Overview, 2019
Table 12.10 Johnson & Johnson: Revenue ($m), AGR (%), 2014-2018
Table 12.11 Amgen: Breakdown of Revenue ($m,%) by RA Drug, 2018
Table 12.12 Amgen, Inc.: Overview, 2019
Table 12.13 Amgen Inc.: Revenue ($m), AGR (%), 2014-2018
Table 12.14 Pfizer: Breakdown of Revenue ($m,%) by RA Drug, 2018
Table 12.15 Pfizer, Inc.: Overview, 2019
Table 12.16 Pfizer, Inc.: Revenue ($m), AGR (%), 2014-2018
Table 12.17 Merck & Co., Inc.: Breakdown of Revenue ($m,%) by RA Drug, 2018
Table 12.18 Merck & Co., Inc.: Overview, 2019
Table 12.19 Merck & Co., Inc.: Revenue ($m), AGR (%), 2014-2018
Table 12.20 Bristol-Myers Squibb: Breakdown of Revenue ($m,%) by RA Drug, 2018
Table 12.21 Bristol-Myers Squibb: Overview, 2019
Table 12.22 Bristol-Myers Squibb: Revenue ($m), AGR (%), 2014-2018
Table 12.23 UCB: Breakdown of Revenue ($m,%) by RA Drug, 2018
Table 12.24 UCB: Overview, 2019
Table 12.25 UCB: Revenue ($m), AGR (%), 2014-2018
Table 12.26 Eli Lilly and Company: Overview, 2019
Table 12.27 Eli Lilly and Company: Revenue ($m), AGR (%), 2014-2018
Table 12.28 Novartis AG: Overview, 2019
Table 12.29 Novartis AG: Revenue ($m), AGR (%), 2014-2018
Table 12.30 Sanofi S.A.: Overview, 2019
Table 12.31 Sanofi: Revenue ($m), AGR (%), 2014-2018
Table 13.1 SWOT Analysis of the Global Rheumatoid Arthritis Market, 2020-2030
Table 13.2 Social, Technological, Economic and Political Factors Influencing the RA
Market, 2018-2030
Table 14.1 Global Rheumatoid Arthritis Market Forecast: Revenue ($m), and CAGR (%),
2018, 2024 and 2030
Table 14.2 Global Rheumatoid Arthritis Market by Drugs Class: CAGR (%), 2018, 2024,
2030
Table 14.3 Global Rheumatoid Arthritis Market by Region: CAGR (%), 2018, 2024, 2030
List of Figure
Figure 1.1 Global Rheumatoid Arthritis Drugs Market Segmentation Overview
Figure 3.1 Rheumatoid Arthritis Drugs Market: Market Share (%) by Indication, 2018
Figure 3.2 Rheumatoid Arthritis Drugs Market: Market Share (%) by Class, 2018
Figure 3.3 Global Rheumatoid Arthritis Drugs Market Forecast: Revenue ($ m), AGR (%), 2018-2030
Figure 3.4 The Global Rheumatoid Arthritis Drugs Market Forecast by Drugs Class, 2018
Figure 3.5 The Global Rheumatoid Arthritis Drugs Market Forecast by Drugs Class, 2019
Figure 3.6 The Global Rheumatoid Arthritis Drugs Market Forecast by Drugs Class: CAGR (%), 2020-2030
Figure 3.7 The Rheumatoid Arthritis Drugs Market Segments: Revenue ($m) Forecast, 2018-2030
Figure 3.8 Global Rheumatoid Arthritis Drugs Market by Drugs Class: Market Share (%), 2018
Figure 3.9 Global Rheumatoid Arthritis Drugs Market by Drugs Class: Market Share (%), 2024
Figure 3.10 Global Rheumatoid Arthritis Drugs Market by Drugs Class: Market Share (%), 2030
Figure 3.11 Non-Biologics for Rheumatoid Arthritis: Revenue ($m) Forecasts by Segment, 2018-2030
Figure 3.12 Non-Biologics for Rheumatoid Arthritis: Market Share (%), 2018
Figure 3.13 Non-Biologics for Rheumatoid Arthritis: Market Share (%), 2024
Figure 3.14 Non-Biologics for Rheumatoid Arthritis: Market Share (%), 2030
Figure 3.15 Global NSAIDs Rheumatoid Arthritis Drugs Market Forecast: Revenue ($ m), AGR (%), 2018-2030
Figure 3.16 sDMARDs for Rheumatoid Arthritis Market Forecasts: Revenue ($ m), AGR (%), 2018-2030
Figure 3.17 Others Drugs Market Forecast: Revenue ($ m), AGR (%), 2018-2030
Figure 4.1 The Main Drugs in the Rheumatoid Arthritis Market: Market Shares (%), 2018
Figure 4.2 Global Humira Market Forecast: Revenue ($m) AGR (%), 2018-2030
Figure 4.3 Global Enbrel Market Forecast: Revenue ($m) AGR (%), 2018-2030
Figure 4.4 Global Remicade Market Forecast: Revenue ($m) AGR (%), 2018-2030
Figure 4.5 Global Rituxan Market Forecast: Revenue ($m) AGR (%), 2018-2030
Figure 4.6 Global Simponi/Simponi Aria Market Forecast: Revenue ($m) AGR (%), 2018-2030
Figure 4.7 Global Orencia Market Forecast: Revenue ($m) AGR (%), 2018-2030
Figure 4.8 Global Actemra/RoActemra Market Forecast: Revenue ($m) AGR (%), 2018-2030
Figure 4.9 Global Cimzia Market Forecast: Revenue ($m) AGR (%), 2018-2030
Figure 4.10 Global Celebrex Market Forecast: Revenue ($m) AGR (%), 2018-2030
Figure 4.11 Global Xeljanz Market Forecast: Revenue ($m) AGR (%), 2018-2030
Figure 4.12 Global Arcoxia Market Forecast: Revenue ($m) AGR (%), 2018-2030
Figure 5.1 World Rheumatoid Arthritis Drugs Market: Revenues ($ m) by Region, 2018
Figure 5.2 World Rheumatoid Arthritis Drugs Market: Revenues ($m) by Region, 2019
Figure 5.3 Global Rheumatoid Arthritis Drugs Market Forecast: Revenue ($ m), AGR (%), 2018-2030
Figure 5.4 World Rheumatoid Arthritis Drugs Market: Market Shares (%) by Regional Market, 2019
Figure 5.5 World Rheumatoid Arthritis Drugs Market: Market Shares (%) by Regional Market, 2024
Figure 5.6 World Rheumatoid Arthritis Drugs Market: Market Shares (%) by Regional Market, 2030
Figure 6.1 North America Rheumatoid Arthritis Drugs Market Forecast: Revenue ($m), AGR (%), 2018-2030
Figure 6.2 North America Rheumatoid Arthritis Drugs Market: Market Shares (%) by Regional Market, 2019
Figure 6.3 North America Rheumatoid Arthritis Drugs Market: Market Shares (%) by Regional Market, 2024
Figure 6.4 North America Rheumatoid Arthritis Drugs Market: Market Shares (%) by Regional Market, 2030
Figure 6.5 U.S. Rheumatoid Arthritis Drugs Market Forecast: Revenues ($m), AGR (%), 2018-2030
Figure 6.6 Canada Rheumatoid Arthritis Drugs Market Forecast: Revenues($m), AGR (%), 2018-2030
Figure 7.1 Europe Rheumatoid Arthritis Drugs Market: Revenues ($m) by
Country/Sub-region, 2018
Figure 7.2 Europe Rheumatoid Arthritis Drugs Market Forecast: Revenue ($m), AGR (%), 2018-2030
Figure 7.3 Europe Rheumatoid Arthritis Drugs Market: Market Shares (%) by Country, 2018
Figure 7.4 Europe Rheumatoid Arthritis Drugs Market: Market Shares (%) by Country, 2024
Figure 7.5 Europe Rheumatoid Arthritis Drugs Market: Market Shares (%) by Country, 2030
Figure 7.6 Germany Rheumatoid Arthritis Drugs Market Forecast: Revenues ($m), AGR (%), 2018-2030
Figure 7.7 France Rheumatoid Arthritis Drugs Market Forecast: Revenues ($m), AGR (%), 2018-2030
Figure 7.8 U.K. Rheumatoid Arthritis Drugs Market Forecast: Revenues ($m), AGR (%), 2018-2030
Figure 7.9 Italy Rheumatoid Arthritis Drugs Market Forecast: Revenues ($m), AGR (%), 2018-2030
Figure 7.10 Spain Rheumatoid Arthritis Drugs Market Forecast: Revenues ($m), AGR (%), 2018-2030
Figure 7.11 Russia Rheumatoid Arthritis Drugs Market Forecast: Revenues ($m), AGR (%), 2018-2030
Figure 7.12 Rest of Europe Rheumatoid Arthritis Drugs Market Forecast: Revenues ($m), AGR (%), 2018-2030
Figure 8.1 Asia Pacific Rheumatoid Arthritis Drugs Market: Revenues ($m) by
Country/Sub-region, 2018
Figure 8.2 Asia Pacific Rheumatoid Arthritis Drugs Market Forecast: Revenue ($ m), AGR (%), 2018-2030
Figure 8.3 Asia Pacific Rheumatoid Arthritis Drugs Market: Market Shares (%) by Country, 2018
Figure 8.4 Asia Pacific Rheumatoid Arthritis Drugs Market: Market Shares (%) by Country, 2024
Figure 8.5 Asia Pacific Rheumatoid Arthritis Drugs Market: Market Shares (%) by Country, 2030
Figure 8.6 Japan Rheumatoid Arthritis Drugs Market Forecast: Revenues ($m), AGR (%), 2018-2030
Figure 8.7 China Rheumatoid Arthritis Drugs Market Forecast: Revenues ($m), AGR (%), 2018-2030
Figure 8.8 India Rheumatoid Arthritis Drugs Market Forecast: Revenues ($m), AGR (%), 2018-2030
Figure 8.9 Rest of Asia Pacific Rheumatoid Arthritis Drugs Market Forecast: Revenues ($m), AGR (%), 2018-2030
Figure 9.1 Latin America Rheumatoid Arthritis Drugs Market: Revenues ($m) by Country/Sub-region, 2018
Figure 9.2 Latin America Rheumatoid Arthritis Drugs Market Forecast: Revenue ($m), AGR (%), 2018-2030
Figure 9.3 Latin America Rheumatoid Arthritis Drugs Market: Market Shares (%) by Country, 2018
Figure 9.4 Latin America Rheumatoid Arthritis Drugs Market: Market Shares (%) by Country, 2024
Figure 9.5 Latin America Rheumatoid Arthritis Drugs Market: Market Shares (%) by Country, 2030
Figure 9.6 Brazil Rheumatoid Arthritis Drugs Market Forecast: Revenues ($m), AGR (%), 2018-2030
Figure 9.7 Mexico Rheumatoid Arthritis Drugs Market Forecast: Revenues ($m), AGR (%), 2018-2030
Figure 9.6 Rest of Latin America Rheumatoid Arthritis Drugs Market Forecast: Revenues ($m), AGR (%), 2018-2030
Figure 10.1 Middle East & Africa (MEA) Rheumatoid Arthritis Drugs Market: Revenues ($m) by Country/Sub-region, 2018
Figure 10.2 Middle East & Africa Rheumatoid Arthritis Drugs Market Forecast: Revenue ($m), AGR (%), 2018-2030
Figure 10.3 Middle East & Africa Rheumatoid Arthritis Drugs Market: Market Shares (%) by Country, 2018
Figure 10.4 Middle East & Africa Rheumatoid Arthritis Drugs Market: Market Shares (%) by Country, 2024
Figure 10.5 Middle East & Africa Rheumatoid Arthritis Drugs Market: Market Shares (%) by Country, 2030
Figure 10.6 Saudi Arabia Rheumatoid Arthritis Drugs Market Forecast: Revenues ($m), AGR (%), 2018-2030
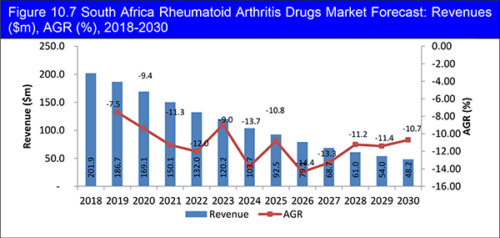
Figure 10.7 South Africa Rheumatoid Arthritis Drugs Market Forecast: Revenues ($m), AGR (%), 2018-2030
Figure 10.8 Rest of Middle East & Africa Rheumatoid Arthritis Drugs Market Forecast: Revenues ($m), AGR (%), 2018-2030
Figure 12.1 AbbVie: Revenue ($m), AGR (%), 2014-2018
Figure 12.2 AbbVie: Business Segment Revenue Share (%), 2018
Figure 12.3 AbbVie: Region Revenue Share (%), 2018
Figure 12.4 Roche: Revenue ($m), AGR (%), 2014-2018
Figure 12.5 Roche: Business Segment Revenue Share (%), 2018
Figure 12.6 Roche: Breakdown of Revenue (%) by Pharmaceuticals Drug, 2018
Figure 12.7 Johnson & Johnson: Revenue ($m), AGR (%), 2014-2018
Figure 12.8 Johnson & Johnson: by Business Segments Revenue Share (%), 2018
Figure 12.9 Johnson & Johnson: by Region Revenue Share (%), 2018
Figure 12.10 Amgen Inc.: Revenue ($m), AGR (%), 2014-2018
Figure 12.11 Amgen Inc.: Business Segment Revenue Share (%), 2018
Figure 12.12 Amgen Inc.: Region Revenue Share (%), 2018
Figure 12.13 Pfizer, Inc.: Revenue ($m), AGR (%), 2014-2018
Figure 12.14 Pfizer, Inc.: Business Segment Revenue Share (%), 2018
Figure 12.15 Pfizer, Inc: Region Revenue Share (%), 2018
Figure 12.16 Merck & Co., Inc.: Revenue ($m), AGR (%), 2014-2018
Figure 12.17 Merck & Co., Inc.: Business Segment Revenue Share (%), 2018
Figure 12.18 Merck & Co., Inc.: by Region Revenue Share (%), 2018
Figure 12.19 Bristol-Myers Squibb: Revenue ($m), AGR (%), 2014-2018
Figure 12.20 Bristol-Myers Squibb: Business Segment Revenue Share (%), 2018
Figure 12.21 Bristol-Myers Squibb: by Region Revenue Share (%), 2018
Figure 12.22 UCB: Revenue ($m), AGR (%), 2014-2018
Figure 12.23 UCB: Business Segment Revenue Share (%), 2018
Figure 12.24 UCB: by Region Revenue Share (%), 2018
Figure 12.25 Eli Lilly and Company: Revenue ($m), AGR (%), 2014-2018
Figure 12.26 Eli Lilly and Company: Business Segment Revenue Share (%), 2018
Figure 12.27 Eli Lilly and Company: by Region Revenue Share (%), 2018
Figure 12.28 Novartis AG: Revenue ($m), AGR (%), 2014-2018
Figure 12.29 Novartis AG: Business Segment Revenue Share (%), 2018
Figure 12.30 Novartis AG: by Region Revenue Share (%), 2018
Figure 12.31 Sanofi: Revenue ($m), AGR (%), 2014-2018
Figure 12.32 Sanofi: Business Segment Revenue Share (%), 2018
Figure 12.33 Sanofi: by Region Revenue Share (%), 2018
Figure 14.1 RA Drugs Market: Comparison of Revenue ($m Forecasts for Total Market and Market for RA Indication, 2018-2030
Figure 14.2 Global Rheumatoid Arthritis Market Forecast: Revenue ($m) 2018, 2024, 2030
Figure 14.3 Global Rheumatoid Arthritis Drugs Market by Drugs Class: Market Share (%), 2018
Figure 14.4 Global Rheumatoid Arthritis Drugs Market by Drugs Class: Market Share (%), 2024
Figure 14.5 Global Rheumatoid Arthritis Drugs Market by Drugs Class: Market Share (%), 2030
Figure 14.6 The Leading Drugs in the RA Market: Revenue ($m) Forecasts, 2018, 2024, 2030
Figure 14.7 The Global Rheumatoid Arthritis Market Forecast by Region: Revenue ($m), 2018, 2024, 2030
4SC
AbbVie
Abivax
Ablynx NV Sanofi
Adheron Therapeutics, Inc.
Akari Therapeutics Plc
Alder Biopharmaceuticals
Amgen
Anacor
Araim Pharmaceuticals, Inc.
argenx
Artax Biopharma, Inc.
Astellas Pharma Inc
Baxalta Incorporated
Biocon Ltd.
Biogen
Bioxpress Therapeutics
Boehringer Ingelheim
Bristol-Myers Squibb
Cadila Healthcare
Cambridge Biotechnology Ltd.
CASI Pharmaceuticals
Catabasis Pharmaceuticals
Celltex Therapeutics Corp.
Celltrion, Inc.
ChemoCentryx
Chugai Pharmaceutical Co., Ltd.
Coherus BioSciences Inc
Covagen AG
Cyclacel Pharmaceuticals
Cyxone AB
Daiichi Sankyo
DePuy Synthes
Dr Reddy’s Laboratories
Eli Lilly
Epirus Biopharmaceuticals
Five Prime Therapeutics
Fresenius Kabi
Fujifilm Corporation
Galapagos NV
Galderma
Genentech
Gerresheimer
Giaconda Ltd.
Gilead Sciences, Inc.
GlaxoSmithKline plc
Glenmark Pharmaceuticals Ltd.
Hanmi Pharmaceutical Co Ltd.
Hospira
Immunomedics
Incyte Corporation
Innate Pharma - IPO Pending
Intas
Italfarmaco SpA
Izana Bioscience Ltd.
Janssen Biologics
Johnson & Johnson
Kadmon Holdings
Kyowa Hakko Kirin Co Ltd
Lycera Corporation
Medigene
Merck & Co.
Mesoblast
Mitsubishi Tanabe Pharma
Momenta
Morphosys
Mycenax Biotech
Mylan NV
Neovacs SA
NeuBase Therapeutics, Inc.
Novo Nordisk
Onyx Pharmaceuticals, Inc.
OphthaliX, Inc. Can-Fite BioPharma Ltd
Outlook Therapeutics, Inc.
Padlock
Pfizer
Philogen SpA
Principia Biopharma, Inc.
Protalex, Inc.
Protalix BioTherapeutics
Ra Pharmaceuticals Inc.
Regeneron Pharmaceuticals, Inc.
Roche
Samsung Bioepis
Sanofi
Shanghai CP Guojian Pharmaceuticals
Spirig Pharma A.G.
Takeda Pharmaceuticals
Theravance Biopharma, Inc.
TiGenix NV Takeda Pharmaceutical
UCB
Vitaeris Inc,
Xencor
XOMA
Zynerba Pharmaceuticals
Other Organisations Mentioned in the Report
American College of Rheumatology
Nurses Health
WHO
National Rheumatoid Arthritis Society
United Nations
US Patent Office
European Commission
U.S. Food and Drug Administration (FDA)
Committee for Medicinal Products for Human Use (CHMP)
Centers for Disease Control and Prevention (CDC)
World Bank
Arthritis Foundation
Canadian Arthritis Society
World Arthritis Day
National Rheumatoid Arthritis Society
Servizio Sanitario Nazionale (SSN)
Ministry of Health
National Institute on Aging
National Center for Biotechnology Information
Unified Health System
ANVISA (Agência Nacional de Vigilância Sanitária)
African League of Associations in Rheumatology
International League of Associations for Rheumatology
Government of Abu Dhabi
Johns Hopkins
Bumrungrad
Cleveland Clinic
Vamed
Emirates Arthritis Foundation
National Treasury of Republic of South Africa
European Medicines Agency
National Institute for Health Research (NIHR)
National Institute for Health and Care Excellence (NICE)
Institute for Quality and Efficiency in Healthcare
Institut fϋr Qualität und Wirtschaftlichkeit im Gesundheitswesen - IQWiG
Download sample pages
Complete the form below to download your free sample pages for Global Rheumatoid Arthritis Drugs Market Forecast 2020-2030
Related reports
-

Global Biosimilars and Follow-On Biologics Market 2019-2029
The global biosimilars and follow-on biologics market is estimated to have reached $10.7bn in 2018 and expected to grow at...
Full DetailsPublished: 21 March 2019 -

Generic Drugs Market Report 2020-2030
Reduction in healthcare expenditure by generic medicines has been acknowledged for a long time. Multiple studies have proven that substituting...
Full DetailsPublished: 03 July 2020 -

Global Pharma Contract Sales Market Forecast 2020-2030
The global pharma contract sales market is expected to grow at a CAGR of 7.9% in the first half of...
Full DetailsPublished: 26 February 2020 -
Next-Generation Biologics Market Forecast to 2029
The global next-generation biologics market is estimated to have reached $3.2bn in 2018. The market is expected to grow at...Full DetailsPublished: 29 November 2019 -
Pharma Wholesale and Distribution Market Forecasts 2020-2030
The pharma wholesale and distribution market is estimated to grow at a CAGR of 5% in the first half of...Full DetailsPublished: 30 September 2019 -
Translational Regenerative Medicine Market Forecast 2020-2030
The Global Translational Regenerative Medicine market is estimated to grow at a CAGR of 24% in the first half of...
Full DetailsPublished: 31 January 2020 -
Cell Therapy Technologies Market Forecast 2020-2030
Visiongain estimates that the global cell therapy technologies market will grow at a CAGR of 15% in the first half...
Full DetailsPublished: 19 February 2020 -
Global Contract Research Organisations (CROs) Market Report Forecasts 2020-2030
Visiongain assesses that the clinical research organizations (CROs) market will generate revenues of $38.0 billion in 2020.
...Full DetailsPublished: 12 February 2020 -
Transplant Diagnostics Market Forecast 2020-2030
The increasing demand for diagnostic treatment used before the procedure is a major driver of organ transplants. Transplant production was...Full DetailsPublished: 01 January 1970 -

Global Bioreactors Market 2020-2030
The global bioreactors market is expected to grow at a CAGR of 7.5% in the second half of the forecast...
Full DetailsPublished: 10 January 2020
Download sample pages
Complete the form below to download your free sample pages for Global Rheumatoid Arthritis Drugs Market Forecast 2020-2030
Do you have any custom requirements we can help you with?
Any specific country, geo region, market segment or specific company information?
Email us today, we can discuss your needs and see how we can help: jamie.roberts@visiongain.com
Would you like a free report overview of the report of your choice?
If so, please drop an email to Jamie Roberts stating your chosen report title to jamie.roberts@visiongain.com
Visiongain’s reports are based on comprehensive primary and secondary research. Those studies provide global market forecasts (sales by drug and class, with sub-markets and leading nations covered) and analyses of market drivers and restraints (including SWOT analysis) and current pipeline developments. To find out more about our reports methodology, please email jamie.roberts@visiongain.com
“Thank you for this Gene Therapy R&D Market report and for how easy the process was. Your colleague was very helpful and the report is just right for my purpose. This is the 2nd good report from Visiongain and a good price.”
Dr Luz Chapa Azuella, Mexico
American Association of Colleges of Pharmacy
American College of Clinical Pharmacy
American Pharmacists Association
American Society for Pharmacy Law
American Society of Consultant Pharmacists
American Society of Health-System Pharmacists
Association of Special Pharmaceutical Manufacturers
Australian College of Pharmacy
Biotechnology Industry Organization
Canadian Pharmacists Association
Canadian Society of Hospital Pharmacists
Chinese Pharmaceutical Association
College of Psychiatric and Neurologic Pharmacists
Danish Association of Pharmaconomists
European Association of Employed Community Pharmacists in Europe
European Medicines Agency
Federal Drugs Agency
General Medical Council
Head of Medicines Agency
International Federation of Pharmaceutical Manufacturers & Associations
International Pharmaceutical Federation
International Pharmaceutical Students’ Federation
Medicines and Healthcare Products Regulatory Agency
National Pharmacy Association
Norwegian Pharmacy Association
Ontario Pharmacists Association
Pakistan Pharmacists Association
Pharmaceutical Association of Mauritius
Pharmaceutical Group of the European Union
Pharmaceutical Society of Australia
Pharmaceutical Society of Ireland
Pharmaceutical Society Of New Zealand
Pharmaceutical Society of Northern Ireland
Professional Compounding Centers of America
Royal Pharmaceutical Society
The American Association of Pharmaceutical Scientists
The BioIndustry Association
The Controlled Release Society
The European Federation of Pharmaceutical Industries and Associations
The European Personalised Medicine Association
The Institute of Clinical Research
The International Society for Pharmaceutical Engineering
The Pharmaceutical Association of Israel
The Pharmaceutical Research and Manufacturers of America
The Pharmacy Guild of Australia
The Society of Hospital Pharmacists of Australia
Latest Pharma news
Visiongain Publishes Cell Therapy Technologies Market Report 2024-2034
The cell therapy technologies market is estimated at US$7,041.3 million in 2024 and is projected to grow at a CAGR of 10.7% during the forecast period 2024-2034.
18 April 2024
Visiongain Publishes Automation in Biopharma Industry Market Report 2024-2034
The global Automation in Biopharma Industry market is estimated at US$1,954.3 million in 2024 and is projected to grow at a CAGR of 7% during the forecast period 2024-2034.
17 April 2024
Visiongain Publishes Anti-obesity Drugs Market Report 2024-2034
The global Anti-obesity Drugs market is estimated at US$11,540.2 million in 2024 and is expected to register a CAGR of 21.2% from 2024 to 2034.
12 April 2024
Visiongain Publishes Inflammatory Bowel Diseases (IBD) Drugs Market Report 2024-2034
The global Inflammatory Bowel Diseases (IBD) Drugs market was valued at US$27.53 billion in 2023 and is projected to grow at a CAGR of 6.2% during the forecast period 2024-2034.
11 April 2024
