The global pharmacovigilance market is expected to grow at a CAGR of 4.8% in the first half of the forecast period. The pharmacovigilance market is estimated to reach $ 11.5bn in 2023.
How this report will benefit you
Read on to discover how you can exploit the future business opportunities emerging in this sector.
In this brand new 150-page report you will receive 47 tables and 61 figures– all unavailable elsewhere.
The 150-page report provides clear detailed insight into the global pharmacovigilance market. Discover the key drivers and challenges affecting the market.
By ordering and reading our brand-new report today you stay better informed and ready to act.
Report Scope
• Global Pharmaceutical R&D Spending forecasts from 2017-2028
• Global Pharmacovigilance market forecasts from 2017-2028
• This report provides individual revenue forecasts to 2027 for these regional and national markets:
– US
– Japan
– EU: Germany, France, the UK, Italy, Spain, Others
– BRIC: Brazil, Russia, India, China
– South Korea
– Others
• This report provides a SWOT and STEP Analysis of the pharmacovigilance market. This report also discusses the Drivers and Restraints of the pharmacovigilance market.
• Our study discusses the selected leading companies that are the major players in the pharmacovigilance market:
– Accenture PLC
– Cognizant Technology Solutions Corporation
– Tata Consultancy Services (TCS)
– Capgemini SE
– Tech Mahindra Limited
– Infosys Limited (Infosys)
– Wipro Limited (Wipro)
– Oracle Corporation (Oracle)
– Bristol-Myers Squibb Company
– HCL Technologies Ltd.
– Olympus Corporation
• Moreover, this report discusses the following:
– Reporting systems for adverse drug reactions (ADRs) – their present and future, including data on reported and recorded events by year and region
– Safety monitoring using reporting from social media
– Improvements in data collection and communication leading to more-flexible drug approval processes – changing routes of marketing authorization
– Policies of national and international bodies, and regulators’ roles in present and future pharmacovigilance plans
– Collaboration between the FDA and EMA, and application of pharmacogenomics and biomarkers
– Use of electronic health record (EHR) systems – a live model for drug safety, applying information systems.
Visiongain’s study is intended for anyone requiring commercial analyses for the global pharmacovigilance market. You find data, trends and predictions.
Buy our report today Global Pharmacovigilance Market Forecast 2018-2028: US, Japan, Germany, the UK, France, Italy, Spain, Brazil, Russia, India, China, South Korea, National Pharmacovigilance Systems, Leading Companies, Trends.
Visiongain is a trading partner with the US Federal Government
CCR Ref number: KD4R6
1. Report Overview
1.1 Introduction to This New Study
1.2 Why You Should Read This Report
1.3 Key Questions Answered by This Analytical Report
1.4 Who is This Report For?
1.5 Methodology
1.6 Frequently Asked Questions (FAQ)
1.7 Associated Visiongain Reports
1.8 About Visiongain
2. Introduction to Pharmacovigilance
2.1 Adverse Drug Reactions
2.1.1 ADRs are Not Side Effects
2.1.2 Terminology in the US and EU
2.2 Never Events
2.3 Safety Signals, What They Mean and How to Identify Them
2.4 Pharmacovigilance, a Historical Perspective
2.4.1 Thalidomide
2.4.2 Eraldin
2.4.3 Vioxx
2.4.4 Avandia
2.5 Drug Safety Monitoring in Clinical Trials
2.5.1 Phase I Clinical Trials
2.5.2 Phase II Clinical Trials
2.5.3 Phase III Clinical Trials
2.5.3.1 Limitations of Phase I-III Trials
2.6 Phase IV – Post-Marketing Studies
2.7 Pharmacovigilance in the Pharmaceutical Industry
2.8 The Pharmacovigilance Practices of the Leading Pharmaceutical Companies
2.8.1 Pfizer
2.8.2 Johnson & Johnson
2.8.3 GlaxoSmithKline
2.8.4 Sanofi
2.8.5 Novartis
2.8.6 AstraZeneca
2.8.7 Roche
2.8.8 Abbott Laboratories
2.8.9 Eli Lilly
2.8.10 Bristol-Myers Squibb
3. Pharmacovigilance: World Market 2018-2028
3.1 The WHO Programme for International Drug Monitoring
3.1.1 Data Collection at the Uppsala Monitoring Centre
3.1.2 VigiBase – The Global Drug Safety Repository
3.2 Pharmacovigilance in Research and Development: Forecast 2018-2028
3.3 Pharmacovigilance Market: Drivers and Restraints 2018-2028
3.3.1 Volume of ADRs Set to Rise
3.3.2 Reduced Pre-Market Safety Data – Focus Shifts to Post-Approval Monitoring
3.3.3 New EU Regulations Will Demand a Revamp of Entire Pharmacovigilance Protocols
3.3.4 Active Drug Safety Monitoring Set to Increase
3.3.5 Lack of Harmonisation Leads to Cross Border Difficulties
3.3.6 Transparency is Crucial in the Future of Pharmacovigilance
3.3.7 Direct Consumer Reports Lack Quality to Detect Causal Safety Signals
3.3.8 Merged Companies Spend Less on Pharmacovigilance
4. Leading National and Regional Markets, 2018-2028
4.1 Regional Breakdown of the World Pharmacovigilance Market, 2017
4.2 World Pharmacovigilance Market: Regional Forecast 2018-2028
4.2.1 How Will Regional Market Shares Change to Between 2018 and 2028?
4.3 The US Pharmacovigilance Market, 2018-2028
4.3.1 Criticism of the FDA
4.3.2 Periodic and Spontaneous Safety Reports
4.3.3 ADR Metrics for the US Market
4.3.4 US Market Forecast, 2018-2028
4.4 The European Pharmacovigilance Market, 2018-2028
4.4.1 New EU Regulations Making the Biggest Impact for Twenty Years
4.4.2 Quality at the Heart of Safety Monitoring
4.4.3 Pharmacovigilance System Master File – Added Complexity in the Short Term
4.4.4 ADR Reporting and Safety Signal Detection
4.4.5 EU Market Forecast, 2018-2028
4.4.6 ADR Metrics for the European Union, 2012
4.5 The German Pharmacovigilance Market, 2018-2028
4.5.1 German Market Forecast, 2018-2028
4.6 The French Pharmacovigilance Market, 2018-2028
4.6.1 French Market Forecast, 2018-2028
4.7 The UK Pharmacovigilance Market 2018-2028
4.7.1 UK Market Forecast, 2018-2028
4.8 The Italian Pharmacovigilance Market, 2018-2028
4.8.1 Italian Market Forecast, 2018-2028
4.9 The Spanish Pharmacovigilance Market 2018-2028
4.9.1 Spanish Market Forecast, 2018-2028
4.10 Japanese Pharmacovigilance Market 2018-2028
4.10.1 Early Stage Drug Monitoring
4.10.2 Expedited and Periodic Safety Reports
4.10.3 Japanese Market Forecast, 2018-2028
4.11 Pharmacovigilance in the BRIC Nations, 2018-2028
4.12 The Chinese Pharmacovigilance Market, 2018-2028
4.12.1 ADR Metrics for the Chinese Market 2003-2012
4.12.2 Chinese Market Forecast, 2018-2028
4.13 The Brazilian Pharmacovigilance Market, 2018-2028
4.13.1 Brazilian Market Forecast, 2018-2028
4.14 The Russian Pharmacovigilance Market, 2018-2028
4.14.1 Russian Market Forecast, 2018-2028
4.15 The Indian Pharmacovigilance Market, 2018-2028
4.15.1 ADR Metrics for Indian Market
4.15.2 Indian Market Forecast 2018-2028
4.16 The South Korean Pharmacovigilance Market, 2018-2028
4.16.1 ADR Metrics for South Korea
4.16.2 South Korean Market Forecast, 2018-2028
5. Leading Pharmacovigilance Companies, 2018
5.1 Accenture PLC
5.1.1 Accenture PLC: Company Overview
5.1.2 Accenture PLC: Product Portfolio
5.2 Cognizant Technology Solutions Corporation
5.2.1 Cognizant Technology Solutions Corporation: Company Overview
5.2.2 Cognizant Technology Solutions Corporation: Product Portfolio
5.3 Tata Consultancy Services
5.3.1 Tata Consultancy Services: Company Overview
5.4 Capgemini SE
5.4.1 Capgemini SE: Company Overview
5.4.2 Capgemini SE: Product Portfolio
5.5 Tech Mahindra Limited
5.5.1 Tech Mahindra Limited: Company Overview
5.5.2 Tech Mahindra Limited: Recent Developments
5.6 Infosys Limited
5.6.1 Infosys Limited: Company Overview
5.6.2 Infosys Limited: Product Portfolio
5.7 WIPRO LIMITED
5.7.1 Wipro Limited: Company Overview
5.7.2 Wipro Limited: Product Portfolio
5.8 Oracle Corporation
5.8.1 Oracle Corporation: Company Overview
5.8.2 Oracle Corporation: Product Portfolio
5.8.3 Oracle Corporation: Recent Developments
5.9 Bristol-Myers Squibb
5.9.1 Bristol-Myers Squibb: Company Overview
5.9.2 Bristol-Myers Squibb: Product Portfolio
5.10 HCL Technologies Ltd.
5.10.1 HCL Technologies Ltd.: Company Overview
5.10.2 HCL Technologies Ltd.: Product Portfolio
5.11 Olympus Corporation
5.11.1 Olympus Corporation: Company Overview
5.11.2 Olympus Corporation: Product Portfolio
6. Qualitative Analysis of the Pharmacovigilance Market 2018-2028
6.1 SWOT Analysis of the Pharmacovigilance Market
6.2 STEP Analysis of the Pharmacovigilance Market
6.3 Social Forces
6.4 Technological Forces
6.5 Economic Forces
6.6 Political Forces
6.7 Increased Focus on Pharmacovigilance in the Emerging Markets
6.8 Increasingly Complex Nature of Pharmaceutical Vigilance
6.9 Harmonization of International Regulations Can Lead to Cost Reductions
6.10 The Effect of the Internet and Social Media on ADR Reporting
6.11 Collaboration between the FDA and EMA
6.12 The Challenge of Obtaining High-Quality ADR Information
6.13 Linking Pharmacovigilance to Genomics and Biomarkers
6.14 Generics, Globalisation and Drug Safety
7. Conclusions
7.1 International Collaboration Will Increase
7.2 Pharmacogenomics Will Become Important in Drug Approval and Safety Analysis
7.3 Drug Safety Monitoring Will Become Active
7.4 Social Media Will Become a Pharmacovigilance Tool
Appendices
Associated Visiongain Reports
Visiongain Report Sales Order Form
Appendix A
About Visiongain
Appendix B
Visiongain report evaluation form
List of Tables
Table 2.1 Pharmacovigilance Terminology in the EU and US, 2017
Table 2.2 Sample Size Required to Detect ADRs Based on Incidence, 2017
Table 2.3 Number of Phase IV Clinical Trials by Registration Date, 2004-2016
Table 3.1 Full Members of the WHO Program for Drug Safety Monitoring, 2017
Table 3.2 Global Pharmaceutical R&D Spending Forecast: Global Spending on R&D ($bn), Annual Growth (%), CAGR (%), 2017-2028
Table 4.1 Spending on Pharmacovigilance in National and Regional Markets: Market Size ($bn), 2017
Table 4.2 Forecast Spending on Pharmacovigilance in National and Regional Markets: Spending ($bn), Annual Growth (%), CAGR (%), 2018-2028
Table 4.3 Forecast Spending on Pharmacovigilance in National and Regional Markets: Market Shares (%), 2018-2028
Table 4.4 Forecast Spending on Pharmacovigilance in the US: Spending ($bn), Annual Growth (%), CAGR (%), 2018-2028
Table 4.5 Forecast Spending on Pharmacovigilance in the European Union: National Market Sizes ($bn), Annual Growth (%), EU Market Shares (%), CAGRs (%), 2018-2028
Table 4.6 Individual Case Safety Reports Made to the Eudravigilance Database by Nation, 2017
Table 4.7 Forecast Spending on Pharmacovigilance in Germany: Market Size ($bn), Annual Growth (%), CAGR (%), 2018-2028
Table 4.8 Forecast Spending on Pharmacovigilance in France: Market Size ($bn), Annual Growth (%), CAGR (%), 2018-2028
Table 4.9 Forecast Spending on Pharmacovigilance in the UK: Market Size ($bn), Annual Growth (%), CAGR (%), 2018-2028
Table 4.10 Forecast Spending on Pharmacovigilance in Italy: Market Size ($bn), Annual Growth (%), CAGR (%), 2018-2028
Table 4.11 Forecast Spending on Pharmacovigilance in Spain: Market Size ($bn), Annual Growth (%), CAGR (%), 2018-2028
Table 4.12 Drug Re-examination Schedule in Japan, 2017
Table 4.13 Forecast Spending on Pharmacovigilance in Japan: Market Size ($bn), Annual Growth (%), CAGR (%), 2018-2028
Table 4.14 Forecast Spending on Pharmacovigilance in the BRIC Nations: Market Size ($bn), Annual Growth (%), Market Share (%), CAGR (%), 2018-2028
Table 4.15 Forecast Spending on Pharmacovigilance in China: Market Size ($bn), Annual Growth (%), CAGR (%), 2018-2028
Table 4.16 Forecast Spending on Pharmacovigilance in Brazil: Market Size ($bn), Annual Growth (%), CAGR (%), 2018-2028
Table 4.17 Forecast Spending on Pharmacovigilance in Russia: Market Size ($bn), Annual Growth (%), CAGR (%), 2018-2028
Table 4.18 Forecast Spending on Pharmacovigilance in India: Market Size ($bn), Annual Growth (%), CAGR (%), 2018-2028
Table 4.19 Forecast Spending on Pharmacovigilance in South Korea: Market Size ($bn), Annual Growth (%), CAGR (%), 2018-2028
Table 5.1 Accenture PLC: Company Overview
Table 5.2 Accenture PLC: Product Portfolio
Table 5.3 Cognizant Technology Solutions Corporation: Company Overview
Table 5.4 Cognizant Technology Solutions Corporation: Product Portfolio
Table 5.5 Tata Consultancy Services: Company Overview
Table 5.6 Capgemini SE: Company Overview
Table 5.7 Capgemini SE: Product Portfolio
Table 5.8 Tech Mahindra Limited: Company Overview
Table 5.9 Tech Mahindra Limited: Recent Developments
Table 5.10 Infosys Limited: Company Overview
Table 5.11 Infosys Limited: Product Portfolio
Table 5.12 Wipro Limited: Company Overview
Table 5.13 Wipro Limited: Product Portfolio
Table 5.14 Oracle Corporation: Company Overview
Table 5.15 Oracle Corporation: Product Portfolio
Table 5.16 Oracle Corporation: Recent Developments
Table 5.17 Bristol-Myers Squibb: Company Overview
Table 5.18 Bristol-Myers Squibb: Product Portfolio
Table 5.19 HCL Technologies Ltd.: Company Overview
Table 5.20 HCL Technologies Ltd.: Product Portfolio
Table 5.21 Olympus corporation: Company Overview
Table 5.22 Olympus corporation: Product Portfolio
Table 6.1 Social, Technological, Economic, and Political Factors (STEP) Affecting Pharmacovigilance, 2018
List of Figures
Figure 2.1 Lifecycle of Adverse Events for Vioxx, 1999-2004
Figure 2.2 Lifecycle of Adverse Events for Avandia, 1999-2010
Figure 2.3 Number of Phase IV Clinical Trials by Registration Date, 2004-2016
Figure 3.1 Country of Origin of ICSRs on UMC VigiBase: National Percentage of Cumulative ISCR Total (%), 2017
Figure 3.2 Per Capita ISCRs Submitted to VigiBase: Number ICSRs Submitted Per Million Inhabitants Per Year, Yearly Average, 2017
Figure 3.3 Global Pharmaceutical R&D Spending Forecast: Spending ($bn), AGR (%), 2018-2028
Figure 3.4 Pharmacovigilance Market: Drivers and Restraints, 2018-2028
Figure 4.1 Spending on Pharmacovigilance in National and Regional Markets: Market Share (%), 2017
Figure 4.2 Forecast Spending on Pharmacovigilance in National and Regional Markets: Spending ($bn), 2018-2028
Figure 4.3 Forecast Spending on Pharmacovigilance in National and Regional Markets: Market Share (%), 2023
Figure 4.4 Forecast Spending on Pharmacovigilance in National and Regional Markets: Market Share (%), 2028
Figure 4.5 Forecast Spending on Pharmacovigilance in the US: Market Size ($bn), 2018-2028
Figure 4.6 Forecast Spending on Pharmacovigilance in European Union (EU5): National Market Sizes ($bn), 2018-2028
Figure 4.7 Individual Case Safety Reports Made to the Eudravigilance Database by Nation, 2017
Figure 4.8 Forecast Spending on Pharmacovigilance in Germany: Market Size ($bn), 2018-2028
Figure 4.9 Forecast Spending on Pharmacovigilance in France: Market Size ($bn), 2018-2028
Figure 4.10 Forecast Spending on Pharmacovigilance in the UK: Market Size ($bn), 2018-2028
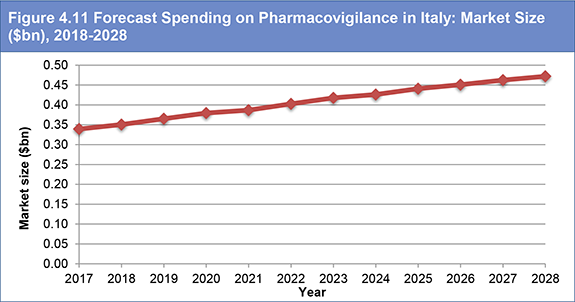
Figure 4.11 Forecast Spending on Pharmacovigilance in Italy: Market Size ($bn), 2018-2028
Figure 4.12 Forecast Spending on Pharmacovigilance in Spain: Market Size ($bn), 2018-2028
Figure 4.13 Forecast Spending on Pharmacovigilance in Japan: Market Size ($bn), 2018-2028
Figure 4.14 Forecast Spending on Pharmacovigilance in BRIC Nations: National Marker Sizes ($bn), 2018-2028
Figure 4.15 Forecast Spending on Pharmacovigilance in China: Market Size ($bn), 2018-2028
Figure 4.16 Forecast Spending on Pharmacovigilance in Brazil: Market Size ($bn), 2018-2028
Figure 4.17 Forecast Spending on Pharmacovigilance in Russia: Market Size ($bn), 2018-2028
Figure 4.18 Forecast Spending on Pharmacovigilance in India: Market Size ($bn), 2018-2028
Figure 4.19 Forecast Spending on Pharmacovigilance in South Korea: Market Size ($bn), 2018-2028
Figure 5.1 Accenture PLC, Revenue, ($million), 2012-2016
Figure 5.2 Accenture PLC, Product Segments Share (%), 2016
Figure 5.3 Accenture PLC, Geography Share (%), 2016
Figure 5.4 Cognizant Technology Solutions Corporation, Revenue, ($million), 2012-2016
Figure 5.5 Cognizant Technology Solutions Corporation, Product Segments Share (%), 2016
Figure 5.6 Cognizant Technology Solutions Corporation, Geographical Presence Share (%), 2016
Figure 5.7 Tata Consultancy Services, Revenue, ($million), 2013-2017
Figure 5.8 Tata Consultancy Services, Product Segments Share (%), 2017
Figure 5.9 Tata Consultancy Services, Geographical Presence Share (%), 2017
Figure 5.10 Capgemini SE, Revenue, ($million), 2012-2016
Figure 5.11 Capgemini SE, Product Segments Share (%), 2016
Figure 5.12 Capgemini SE, Geographical Presence Share (%), 2016
Figure 5.13 Tech Mahindra Limited, Revenue, ($million), 2013-2017
Figure 5.14 Tech Mahindra Limited, Product Segments Share (%), 2017
Figure 5.15 Tech Mahindra Limited, Geographical Presence Share (%), 2017
Figure 5.16 Infosys Limited, Revenue, ($million), 2013-2017
Figure 5.17 Infosys Limited, Product Segments Share (%), 2017
Figure 5.18 Infosys Limited, Geographical Presence Share (%), 2017
Figure 5.19 Wipro Limited, Revenue, ($million), 2013-2017
Figure 5.20 Wipro Limited, Product Segments Share (%), 2016
Figure 5.21 Wipro Limited, Geographical Presence Share (%), 2016
Figure 5.22 Oracle Corporation, Revenue, ($million), 2013-2017
Figure 5.23 Oracle Corporation, Product Segments Share (%), 2017
Figure 5.24 Oracle Corporation, Geographical Presence Share (%), 2017
Figure 5.25 Bristol-Myers Squibb, Revenue, ($million), 2012-2016
Figure 5.26 Bristol-Myers Squibb, Product Segments Share (%), 2016
Figure 5.27 Bristol-Myers Squibb, Geographical Presence Share (%), 2016
Figure 5.28 HCL Technologies Ltd., Revenue, ($million), 2013-2017
Figure 5.29 HCL Technologies Ltd., Product Segments Share (%), 2017
Figure 5.30 HCL Technologies Ltd., Geographical Presence Share (%), 2017
Figure 5.31 Olympus corporation, Revenue, ($million), 2013-2017
Figure 5.32 Olympus corporation, Product Segments Share (%), 2017
Figure 5.33 Olympus corporation, Geographical Presence Share (%), 2017
Figure 6.1 Strengths and Weaknesses Within Pharmacovigilance, 2017
Figure 6.2 Opportunities and Threats Within Pharmacovigilance, 2017


