Industries > Pharma > Global Lab Automation Market Forecast 2018-2028
Global Lab Automation Market Forecast 2018-2028
Modular Automation, Total Lab Automation, Automated Liquid Handling, Microplate Readers, Software & Informatics, Automated Storage & Retrieval Systems, Automated Integrated Workstations, Reagent Dispensers, Microplate Washers, Multi-mode, Single-mode, Laboratory Information Management System, Electronic Laboratory Notebook, Scientific Data Management Systems, Drug Discovery, Others
The global lab automation market is expected to grow at a CAGR of 7.4% in the first half of the forecast period. The market is estimated at $4,378 million in 2017 and is dominated by the Modular Automation submarket.
How this report will benefit you
Read on to discover how you can exploit the future business opportunities emerging in this sector.
In this brand new 209-page report you will receive 98 tables and 108 figures– all unavailable elsewhere.
The 209-page report provides clear detailed insight into the global lab automation market. Discover the key drivers and challenges affecting the market.
By ordering and reading our brand-new report today you stay better informed and ready to act.
Report Scope
• Global Lab Automation Market forecasts from 2018-2028
• Revenue forecasts of global lab automation market, segmented by product type:
– Automated Liquid Handling
– Microplate Readers
– Software & Informatics
– Automate Storage & Retrievals
– Others
• Revenue forecasts of global lab automation market, segmented by automation type:
– Modular Automation
– Total Lab Automation
• Revenue forecasts of global lab automation market, segmented by application:
– Drug Discovery
– Clinical Diagnostics
– Genomics Solutions
– Proteomic Solutions
– Others
• Revenue forecasts of Automated Liquid Handling submarket, segmented by product type:
– Automated Integrated Workstations
– Reagent Dispensers
– Microplate Washers
– Others
This section also discusses the leading products as well as SWOT analysis of this submarket.
• Revenue forecasts of Microplate Readers submarket, segmented by product type:
– Multi-mode
– Single-mode
This section also discusses the leading products as well as SWOT analysis of this submarket.
• Revenue forecasts of Software & Informatics submarket, segmented by product type:
– Laboratory Information Management System (LIMS)
– Electronic Laboratory Notebook
– Scientific Data Management Systems
– Others
This section also discusses the leading products as well as SWOT analysis of this submarket.
• Lab Automation Leading Regional Market forecasts from 2018-2028 covering North America, Europe, Asia-Pacific, Latin America, Middle East and Africa:
– US
– Canada
– UK
– Germany
– France
– Spain
– Italy
– Rest of Europe
– China
– Japan
– India
– Australia
– Rest of Asia-Pacific
– Brazil
– Mexico
– Rest of Latin America
– Saudi Arabia
– South Africa
– Rest of Middle East and Africa
Each regional market is further segmented by automation type, product type, automated liquid handling type, microplate readers type, software & informatics type, application type and country.
• Assessment of selected leading companies that hold major market shares in the lab automation market:
– Danaher Corporation
– Thermo Fisher Scientific, Inc.
– Roche Holding AG
– Siemens Healthineers
– Qiagen N.V.
– PerkinElmer, Inc.
– Agilent Technologies
– Abbott Laboratories
– Tecan Trading AG
– Labcyte, Inc.
Visiongain’s study is intended for anyone requiring commercial analyses for the Lab Automation Market. You find data, trends and predictions.
Buy our report today Global Lab Automation Market Forecast 2018-2028: Modular Automation, Total Lab Automation, Automated Liquid Handling, Microplate Readers, Software & Informatics, Automated Storage & Retrieval Systems, Automated Integrated Workstations, Reagent Dispensers, Microplate Washers, Multi-mode, Single-mode, Laboratory Information Management System, Electronic Laboratory Notebook, Scientific Data Management Systems, Drug Discovery, Clinical Diagnostics, Genomic Solutions, Proteomic Solutions, Others.
Visiongain is a trading partner with the US Federal Government
CCR Ref number: KD4R6
1. Report Overview
1.1 Global Lab Automation Market Overview
1.2 Structure of the Report
1.3 Global Lab Automation Market Segmentation
1.4 Why You Should Read This Report
1.5 How This Report Delivers
1.6 Key Questions Answered by This Analytical Report
1.7 Who is This Report For?
1.8 Methodology
1.9 Associated Visiongain Reports
1.10 About Visiongain
2. Introduction to Lab Automation
2.1 An Introduction to Lab Automation
2.1.1. Automated Liquid Handling
2.1.2. Microplate Readers
2.1.3. Software & Informatics
2.1.4. Automated Storage & Retrieval Systems
2.2. Lab Automation Market: Drivers, Restraints and Opportunities
2.2.1. Drivers
2.2.1.1. Pressures to Automate in the Clinical Lab
2.2.1.2. Benefits of lab automation over traditional laboratory settings
2.2.1.3. Shortage of skilled lab personnel in developed countries
2.2.1.4. Technological advancement and new product launch
2.2.1.5. Increased health care expenditure globally
2.2.2. Restrains
2.2.2.1. Lack of planning for technology development
2.2.2.2. Automation not a priority for small-medium labs
2.2.2.3. Initial costs are relatively high
2.2.3. Opportunities
2.2.3.1. Automation in cancer research for early cancer detection and reduction in cost of cancer
2.3. Regulation of Medical Devices
2.3.1. FDA Regulation
2.3.2. Reimbursement
3. Global Lab Automation Market, 2018-2028
3.1 Global Lab Automation Market Forecast, 2018-2028
3.2 Global Lab Automation Market Forecast 2018-2028
3.3 Global Lab Automation Market, by Automation Type: Sales Forecast 2018-2028
3.3.1 Changing Market Shares by Segment 2018-2028
3.4 Global Lab Automation Market, by Product Type: Sales Forecast 2016-2028
3.4.1 Changing Market Shares by Segment 2018-2028
3.5 Global Lab Automation Market, by Application: Sales Forecast 2018-2028
3.5.1 Changing Market Shares by Segment 2018-2028
4. Global Lab Automation Market, by Product Type, 2018-2028
4.1 Global Lab Automation Market, by Product Type: Sales Forecast 2018-2028
4.2. Market Share of Lab Automation Market by Products Type
4.3 Global Automated Liquid Handling, by Product Type: Sales Forecast 2018-2028
4.3.1 Market Share of Automated Liquid Handling Products by Type
4.3.2. Automated Integrated Workstations: Market Forecast, 2016-2028
4.3.3. Leading Products in the Automated Integrated Workstations Market
4.3.3.1. JANUS G3 Varispan Automated Workstation (PerkinElmer, Inc.)
4.3.3.2. Sciclone G3 NGS Workstation (PerkinElmer, Inc.)
4.3.4. Reagent Dispensers: Market Forecast, 2016-2028
4.3.5. Leading Products in the Reagent Dispensers Market
4.3.5.1. Multidrop Combi Reagent Dispenser (Thermo Fisher Scientific Inc.)
4.3.6. Microplate Washers: Market Forecast, 2016-2028
4.3.7. Leading Products in the Microplate Washer Market
4.3.7.1. Wellwash Microplate Washer (Thermo Fisher Scientific Inc.)
4.3.8. SWOT Analysis of the Automated Liquid Handling Market, 2018-2028
4.3.8.1 Strengths
4.3.8.1.1 Precision and Accuracy While Reducing the Labor Cost
4.3.8.1.2 Wide Range of Application
4.3.8.2. Weaknesses
4.3.8.2.1 High Set-up Cost
4.3.8.2.2 Complex Operability of Latest Liquid Handling Systems
4.3.8.3 Opportunities
4.3.8.3.1 Complete liquid handling system
4.3.8.4 Threat
4.3.8.4.1 The Threat of Emerging Technologies
4.4 Global Microplate Readers, by Product Type: Sales Forecast 2018-2028
4.4.1 Market Share of Microplate Readers Products by Type
4.4.2. Multi-mode: Market Forecast, 2016-2028
4.4.3. Single-Mode: Market Forecast, 2016-2028
4.4.4 Leading Products in the Microplate Readers Market
4.4.4.1. VICTOR X Plate Reader (PerkinElmer Inc.)
4.4.4.2. EnSpire Plate Reader (PerkinElmer Inc.)
4.4.4.3. Synergy Neo2 Multi-Mode Reader (BioTek Instruments, Inc.)
4.4.4.4. Cytation Multi-Mode Reader (BioTek Instruments, Inc.)
4.4.5. SWOT Analysis of the Microplate Readers Market, 2018-2028
4.4.5.1 Strengths
4.4.5.1.1. Combine Multiple Measurement Technologies
4.4.5.1.2. Wide Range of Application
4.4.5.2 Weaknesses
4.4.5.2.1 System Failure
4.4.5.3 Opportunities
4.4.5.3.1 Advanced Systems with minimal system failure
4.4.5.4 Threat
4.4.5.4.1 The Threat of Emerging Technologies
4.5 Global Software & Informatics, by Product Type: Sales Forecast 2018-2028
4.5.1. Changing Market Shares by Segment 2018-2028
4.5.2. Laboratory Information Management System: Market Forecast, 2016-2028
4.5.3. Leading Products in the Laboratory Information Management System Market
4.5.3.1 Lab Information Management System (Thermo Fisher Scientific Inc.)
4.5.3.2. STARLIMS Laboratory Information Management System (LIMS)(Abbott Laboratories)
4.5.4. Electronic Laboratory Notebook: Market Forecast, 2016-2028
4.5.5. Leading Products in the Electronic Laboratory Notebook Market
4.5.5.1 LabWare ELN(LabWare)
4.5.5.2 E-Notebook solutions (PerkinElmer Inc.)
4.5.6. Scientific Data Management Systems: Market Forecast, 2016-2028
4.5.7. Leading Products in the Scientific Data Management Systems Market
4.5.7.1. Data Manager Software (Thermo Fisher Scientific Inc.)
4.5.7.2. STARLIMS Scientific Data Management System (SDMS) (Abbott Laboratories)
4.5.8 SWOT Analysis of the Software & Informatics Market, 2018-2028
4.5.8.1 Strengths
4.5.8.1.1 Gaining Popularity and Replacing Paper Notebooks
4.5.8.1.2 Achieving maximum efficiency and Cost Effective
4.5.8.2 Weaknesses
4.5.8.2.1 Availability of reliable data
4.5.8.3 Opportunities
4.5.8.3.1 More-flexible Analyzers and Automation based on Advanced Technology
4.5.8.3.2. Increasing Need for Automation
4.5.8.4 Threat
4.5.8.4.1 Substitute Product in More Affordable Price
4.6. Automated Storage & Retrieval Systems: Market Forecast, 2016-2028
4.6.1 Leading Products in the Automated Storage & Retrieval Systems Market
4.6.1.1 Automated Storage and Retrieval Systems (ASRS) (Siemens Healthineers)
4.6.2. SWOT Analysis of the Automated Storage & Retrieval Systems Market, 2018-2028
4.6.2.1 Strengths
4.6.2.1.1 Increased Tracking and Inventory Control
4.6.2.1.2 Cost Effective
4.6.2.2 Weaknesses
4.6.2.2.1 Significant Investments
4.6.2.3 Opportunities
4.6.2.3.1 Developing Comprehensive Evaluating and Improving Procedures
4.6.2.4 Threat
4.6.2.4.1 Security and privacy issues
5. Leading National Markets 2018-2028
5.1. Geographical Breakdown of the World Lab Automation Market
5.2 World Lab Automation Market: Regional Forecast 2018-2028
5.2.1 How Will Regional Market Shares Change to 2028?
6. North America Lab Automation Market 2018-2028
6.1. U.S. Lab Automation Market: Trends and Developments
6.2. Canada Lab Automation Market: Trends and Developments
7. Europe Lab Automation Market 2018-2028
7.1. Germany Lab Automation Market Forecast 2018-2028
7.2. France Lab Automation Market Forecast 2018-2028
7.3. U.K. Lab Automation Market Forecast 2018-2028
7.4. Italy Lab Automation Market Forecast 2018-2028
7.5. Spain Lab Automation Market Forecast 2018-2028
7.6. Russia Lab Automation Market Forecast 2018-2028
7.7. Rest of Europe Lab Automation Market Forecast 2018-2028
8. Asia-Pacific Lab Automation Market 2018-2028
8.1. China Lab Automation Market: Trends and Developments
8.2. Japan Lab Automation Market: Trends and Developments
8.3. India Lab Automation Market: Trends and Developments
8.4. Australia & New Zealand Lab Automation Market: Trends and Developments
8.5. Rest of Asia-Pacific Lab Automation Market: Trends and Developments
9. Latin America Lab Automation Market 2018-2028
9.1 Brazil Lab Automation Market: Trends and Developments
9.2. Mexico Lab Automation Market: Trends and Developments
9.3. Rest of Latin America Lab Automation Market: Trends and Developments
10. Middle East & Africa Lab Automation Market 2018-2028
10.1. Saudi Arabia Lab Automation Market Forecast 2018-2028
10.2. South Africa Lab Automation Market Forecast 2018-2028
10.3. Rest of Middle East & Africa Lab Automation Market Forecast 2018-2028
11. Leading Companies in the Lab Automation Market
11.1. Danaher Corporation
11.1.1 Danaher Corporation: Lab Automation Product Portfolio
11.1.2 Financial Overview
11.1.3. Recent Transactions Summary
11.2. Thermo Fisher Scientific, Inc.
11.2.1. Thermo Fisher Scientific, Inc.: Lab Automation Product Portfolio
11.2.2 Financial Overview
11.2.3. Recent Transactions Summary
11.3. F. Hoffmann-La Roche AG
11.3.1 Roche: Lab Automation Product Portfolio
11.3.2 Financial Overview
11.3.3 Recent Transactions Summary
11.4. Siemens Healthineers
11.4.1 Siemens Healthineers: Lab Automation Product Portfolio
11.4.2 Financial Overview
11.4.3 Recent Transactions Summary
11.5. Qiagen N.V.
11.5.1 Qiagen N.V.: Lab Automation Product Portfolio
11.5.2 Financial Overview
11.5.3 Recent Transactions Summary
11.6. Abbott Laboratories
11.6.1 Abbott Laboratories: Lab Automation Product Portfolio
11.6.2 Financial Overview
11.6.3 Recent Transactions Summary
11.7. Agilent Technologies, Inc.
11.7.1 Agilent Technologies, Inc.: Lab Automation Product Portfolio
11.7.2 Financial Overview
11.7.3 Recent Transactions Summary
11.8. Tecan Trading AG
11.8.1 Tecan Trading AG: Lab Automation Product Portfolio
11.8.2 Financial Overview
11.8.3 Recent Transactions Summary
11.9. Labcyte, Inc.,
11.9.1 Labcyte Inc.: Lab Automation Product Portfolio
11.9.2 Recent Transactions Summary
11.10. PerkinElmer, Inc.,
11.10.1 PerkinElmer Inc.: Lab Automation Product Portfolio
11.10.2 Financial Overview
11.10.3 Recent Transactions Summary
12. Conclusions
12.1 The World Lab Automation Market in 2016 and 2017
12.1.1 Current Leading Lab Automation Segments
12.1.2 Leading Regional Markets
12.2 World Lab Automation Market Forecast 2016-2028
12.3 The Future of the Lab Automation Market?
Appendices
Associated Visiongain Reports
Visiongain Report Sales Order Form
About Visiongain
Visiongain Report Evaluation Form
List of Tables
Table 3.1 Global Lab Automation Market by Product Type: Revenue ($m) and Market Share (%), 2016
Table 3.2 Global Lab Automation Market Forecast by Automation Type: Revenues ($m), AGR (%), CAGR (%), 2016-2028
Table 3.3 Global Lab Automation Market Forecast by Product Type: Revenues ($m), AGR (%), CAGR (%), 2016-2028
Table 3.4 Global Lab Automation Market Forecast by Application: Revenues ($m), AGR (%), CAGR (%), 2016-2028
Table 4.1 Global Lab Automation Market by Product Type: Revenue ($m) and Market Share (%), 2016
Table 4.2 Global Lab Automation Market Forecast by Product Type: Revenues ($m), AGR (%), CAGR (%), 2016-2028
Table 4.3 Global Lab Automation Market Forecast by Automated Liquid Handling: Revenues ($m), AGR (%), CAGR (%), 2016-2028
Table 4.4 Global Automated Integrated Workstations Market Forecast: Revenues ($m), AGR (%), CAGR (%), 2016-2028
Table 4.5 Global Reagent Dispensers Market Forecast: Revenues ($m), AGR (%), CAGR (%), 2016-2028
Table 4.6 Global Microplate Washers Market Forecast: Revenues ($m), AGR (%), CAGR (%), 2016-2028
Table 4.7 SWOT Analysis of the Automated Liquid Handling Market, 2018-2028
Table 4.8 Global Lab Automation Market Forecast by Microplate Readers: Revenues ($m), AGR (%), CAGR (%), 2016-2028
Table 4.9 Global Multi-mode Market Forecast: Revenues ($m), AGR (%), CAGR (%), 2016-2028
Table 4.10 Global Single-Mode Market Forecast: Revenues ($m), AGR (%), CAGR (%), 2016-2028
Table 4.11 SWOT Analysis of the Microplate Readers Market, 2018-2028
Table 4.12 Global Software & Informatics Market Forecast by Product Type: Revenues ($m), AGR (%), CAGR (%), 2016-2028
Table 4.13 Global Laboratory Information Management System Market Forecast: Revenues ($m), AGR (%), CAGR (%), 2016-2028
Table 4.14 Global Electronic Laboratory Notebook Market Forecast: Revenues ($m), AGR (%), CAGR (%), 2016-2028
Table 4.15 Global Scientific Data Management Systems Market Forecast: Revenues ($m), AGR (%), CAGR (%), 2016-2028
Table 4.16 SWOT Analysis of the Software & Informatics Market, 2018-2028
Table 4.17 Global Automated Storage & Retrieval Systems Market Forecast: Revenues ($m), AGR (%), CAGR (%), 2016-2028
Table 4.18 SWOT Analysis of the Automated Storage & Retrieval Systems Market, 2018-2028
Table 5.1 Global Lab Automation Market by Region: Revenue ($m), 2016 and 2017
Table 5.2 Global Lab Automation Market Forecast by Region: Revenues ($m), AGR (%), CAGR (%), 2016-2028
Table 6.1 North America Lab Automation Market Forecast by Automation: Revenues ($m), AGR (%), CAGR (%), 2016-2028
Table 6.2 North America Lab Automation Market Forecast by Product Type: Revenues ($m), AGR (%), CAGR (%), 2016-2028
Table 6.3 North America Lab Automation Market Forecast by Automated Liquid Handling: Revenues ($m), AGR (%), CAGR (%), 2016-2028
Table 6.4 North America Lab Automation Market Forecast by Microplate Readers: Revenues ($m), AGR (%), CAGR (%), 2016-2028
Table 6.5 North America Software & Informatics Market Forecast by Product Type: Revenues ($m), AGR (%), CAGR (%), 2016-2028
Table 6.6 North America Lab Automation Market Forecast by Application: Revenues ($m), AGR (%), CAGR (%), 2016-2028
Table 6.7 North America Lab Automation Market Forecast by End User: Revenues ($m), AGR (%), CAGR (%), 2016-2028
Table 6.8 U.S. Lab Automation Market Forecast: Revenues ($m), AGR (%), CAGR (%), 2016-2028
Table 6.9 Canada Lab Automation Market Forecast, By End User: Revenues ($m), AGR (%), CAGR (%), 2016-2028
Table 7.1 Europe Lab Automation Market Forecast by Automation Type: Revenues ($m), AGR (%), CAGR (%), 2016-2028
Table 7.2 Europe Lab Automation Market Forecast by Product Type: Revenues ($m), AGR (%), CAGR (%), 2016-2028
Table 7.3 Europe Lab Automation Market Forecast by Automated Liquid Handling: Revenues ($m), AGR (%), CAGR (%), 2016-2028
Table 7.4 Europe Lab Automation Market Forecast by Microplate Readers: Revenues ($m), AGR (%), CAGR (%), 2016-2028
Table 7.5 Europe Software & Informatics Market Forecast by Product Type: Revenues ($m), AGR (%), CAGR (%), 2016-2028
Table 7.6 Europe Lab Automation Market Forecast by Application: Revenues ($m), AGR (%), CAGR (%), 2016-2028
Table 7.7 Europe Lab Automation Market Forecast by Country: Revenues ($m), AGR (%), CAGR (%), 2016-2028
Table 7.8 Germany Lab Automation Market Forecast, 2016-2028 ($m, AGR %, CAGR %)
Table 7.9 France Lab Automation Market Forecast: Revenues ($m), AGR (%), CAGR (%), 2016-2028
Table 7.10 U.K. Lab Automation Market Forecast, 2016-2028 ($m, AGR %, CAGR %)
Table 7.11 Italy Lab Automation Market Forecast, 2016-2028 ($m, AGR %, CAGR %)
Table 7.12 Spain Lab Automation Market Forecast, 2016-2028 ($m, AGR %, CAGR %)
Table 7.13 Russia Lab Automation Market Forecast, 2016-2028 ($m, AGR %, CAGR %)
Table 7.14 Rest of Europe Lab Automation Market Forecast, 2016-2028 ($m, AGR %, CAGR %)
Table 8.1 Asia-Pacific Lab Automation Market Forecast by Automation Type: Revenues ($m), AGR (%), CAGR (%), 2016-2028
Table 8.2 Asia-Pacific Lab Automation Market Forecast by Product Type: Revenues ($m), AGR (%), CAGR (%), 2016-2028
Table 8.3 Asia-Pacific Lab Automation Market Forecast by Automated Liquid Handling: Revenues ($m), AGR (%), CAGR (%), 2016-2028
Table 8.4 Asia-Pacific Lab Automation Market Forecast by Microplate Readers: Revenues ($m), AGR (%), CAGR (%), 2016-2028
Table 8.5 Asia-Pacific Software & Informatics Market Forecast by Product Type: Revenues ($m), AGR (%), CAGR (%), 2016-2028
Table 8.6 Asia-Pacific Lab Automation Market Forecast by Application: Revenues ($m), AGR (%), CAGR (%), 2016-2028
Table 8.7 Asia-Pacific Lab Automation Market Forecast by Country: Revenues ($m), AGR (%), CAGR (%), 2016-2028
Table 8.8 China Lab Automation Market Forecast, 2016-2028 ($m, AGR %, CAGR %)
Table 8.9 Japan Lab Automation Market Forecast, 2016-2028 ($m, AGR %, CAGR %)
Table 8.10 India Lab Automation Market Forecast, 2016-2028 ($m, AGR %, CAGR %)
Table 8.11 Australia & New Zealand Lab Automation Market Forecast, 2016-2028 ($m, AGR %, CAGR %)
Table 8.12 Rest of Asia-Pacific Lab Automation Market Forecast, 2016-2028 ($m, AGR %, CAGR %)
Table 9.1 Latin America Lab Automation Market Forecast by Automation: Revenues ($m), AGR (%), CAGR (%), 2016-2028
Table 9.2 Latin America Lab Automation Market Forecast by Product Type: Revenues ($m), AGR (%), CAGR (%), 2016-2028
Table 9.3 Latin America Lab Automation Market Forecast by Automated Liquid Handling: Revenues ($m), AGR (%), CAGR (%), 2016-2028
Table 9.4 Latin America Lab Automation Market Forecast by Microplate Readers: Revenues ($m), AGR (%), CAGR (%), 2016-2028
Table 9.5 Latin America Software & Informatics Market Forecast by Product Type: Revenues ($m), AGR (%), CAGR (%), 2016-2028
Table 9.6 Latin America Lab Automation Market Forecast by Application: Revenues ($m), AGR (%), CAGR (%), 2016-2028
Table 9.7 Latin America Lab Automation Market Forecast by Country: Revenues ($m), AGR (%), CAGR (%), 2016-2028
Table 9.8 Brazil Lab Automation Market Forecast, 2016-2028 ($m, AGR %, CAGR %)
Table 9.9 Mexico Lab Automation Market Forecast, 2016-2028 ($m, AGR %, CAGR %)
Table 9.10 Rest of Latin America Lab Automation Market Forecast, 2016-2028 ($m, AGR %, CAGR %)
Table 10.1 Middle East & Africa (MEA) Lab Automation Market Forecast by Automation: Revenues ($m), AGR (%), CAGR (%), 2016-2028
Table 10.2 Middle East & Africa (MEA) Lab Automation Market Forecast by Product Type: Revenues ($m), AGR (%), CAGR (%), 2016-2028
Table 10.3 Middle East & Africa (MEA) Lab Automation Market Forecast by Automated Liquid Handling: Revenues ($m), AGR (%), CAGR (%), 2016-2028
Table 10.4 Middle East & Africa (MEA) Lab Automation Market Forecast by Microplate Readers: Revenues ($m), AGR (%), CAGR (%), 2016-2028
Table 10.5 Middle East & Africa (MEA) Software & Informatics Market Forecast by Product Type: Revenues ($m), AGR (%), CAGR (%), 2016-2028
Table 10.6 Middle East & Africa (MEA) Lab Automation Market Forecast by Application: Revenues ($m), AGR (%), CAGR (%), 2016-2028
Table 10.7 Middle East & Africa (MEA) Lab Automation Market Forecast by Country: Revenues ($m), AGR (%), CAGR (%), 2016-2028
Table 10.8 Saudi Arabia Lab Automation Market Forecast by Country: Revenues ($m), AGR (%), CAGR (%), 2016-2028
Table 10.9 South Africa Lab Automation Market Forecast, 2016-2028 ($m, AGR %, CAGR %)
Table 10.10 Rest of MEA Lab Automation Market Forecast, 2016-2028 ($m, AGR %, CAGR %)
Table 11.1 Danaher Corporation: Overview, 2018
Table 11.2 Danaher Corporation: Revenue ($m), AGR (%), 2012-2016
Table 11.3. Thermo Fisher Scientific, Inc.: Overview, 2017
Table 11.4 Thermo Fisher Scientific, Inc.: Revenue ($m), AGR (%), 2012-2016
Table 11.5 Roche: Overview, 2017
Table 11.6 Roche: Revenue ($m), AGR (%), 2012-2016
Table 11.7 Siemens Healthineers: Overview, 2017
Table 11.8 Siemens Healthineers: Revenue ($m), AGR (%), 2012-2016
Table 11.9 Qiagen N.V.: Overview, 2018
Table 11.10 Qiagen N.V.: Revenue ($m), AGR (%), 2012-2016
Table 11.11 Abbott Laboratories: Overview, 2017
Table 11.12 Abbott Laboratories: Revenue ($m), AGR (%), 2012-2016
Table 11.13 Agilent Technologies, Inc.: Overview, 2017
Table 11.14 Agilent Technologies, Inc.: Revenue ($m), AGR (%), 2013-2017
Table 11.15 Tecan Trading AG: Overview, 2017
Table 11.16 Tecan Trading AG: Revenue ($m), AGR (%), 2012-2016
Table 11.17 Labcyte Inc.: Overview, 2017
Table 11.18 PerkinElmer Inc.: Overview, 2017
Table 11.19 PerkinElmer Inc.: Revenue ($m), AGR (%), 2013-2017
List of Figures
Figure 1.1 Global Lab Automation Market Segmentation Overview
Figure 3.1 Global Lab Automation Market by Product Type: Market Share (%), 2016
Figure 3.2 Global Lab Automation Market Forecast: Revenue ($m), AGR (%), 2016-2028
Figure 3.3 Global Lab Automation Market by Automation Type: Market Share (%), 2016
Figure 3.4 Global Lab Automation Market by Automation Type: Market Share (%), 2022
Figure 3.5 Global Lab Automation Market by Automation Type: Market Share (%), 2028
Figure 3.6 Global Lab Automation Market by Product Type: Market Share (%), 2016
Figure 3.7 Global Lab Automation Market by Product Type: Market Share (%), 2022
Figure 3.8 Global Lab Automation Market by Product Type: Market Share (%), 2028
Figure 3.9 Global Lab Automation Market by Application: Market Share (%), 2016
Figure 3.10 Global Lab Automation Market by Application: Market Share (%), 2022
Figure 3.11 Global Lab Automation Market by Application: Market Share (%), 2028
Figure 4.1 Global Lab Automation Market by Product Type: Market Share (%), 2016
Figure 4.2 Global Lab Automation Market by Product Type: Market Share (%), 2022
Figure 4.3 Global Lab Automation Market by Product Type: Market Share (%), 2028
Figure 4.4 Global Automated Liquid Handling Market Forecast: Revenue ($m), AGR (%), 2016-2028
Figure 4.5 Global Automated Liquid Handling by Product Type: Market Share (%), 2016
Figure 4.6 Global Automated Liquid Handling by Product Type: Market Share (%), 2022
Figure 4.7 Global Automated Liquid Handling by Product Type: Market Share (%), 2028
Figure 4.8 Global Automated Integrated Workstations Market Forecast: Revenue ($m), AGR (%), 2016-2028
Figure 4.9 Global Reagent Dispensers Market Forecast: Revenue ($m), AGR (%), 2016-2028
Figure 4.10 Global Microplate Washers Market Forecast: Revenue ($m), AGR (%), 2016-2028
Figure 4.11 Global Microplate Readers Market Forecast: Revenue ($m), AGR (%), 2016-2028
Figure 4.12 Global Microplate Readers by Product Type: Market Share (%), 2016
Figure 4.13 Global Microplate Readers by Product Type: Market Share (%), 2022
Figure 4.14 Global Microplate Readers by Product Type: Market Share (%), 2028
Figure 4.15 Global Multi-mode Market Forecast: Revenue ($m), AGR (%), 2016-2028
Figure 4.16 Global Single-Mode Market Forecast: Revenue ($m), AGR (%), 2016-2028
Figure 4.17 Global Software & Informatics Market by Product Type: Market Share (%), 2016
Figure 4.18 Global Software & Informatics Market by Product Type: Market Share (%), 2022
Figure 4.19 Global Software & Informatics Market by Product Type: Market Share (%), 2028
Figure 4.20 Global Laboratory Information Management System Market Forecast: Revenue ($m), AGR (%), 2016-2028
Figure 4.21 Global Electronic Laboratory Notebook Market Forecast: Revenue ($m), AGR (%), 2016-2028
Figure 4.22 Global Scientific Data Management Systems Market Forecast: Revenue ($m), AGR (%), 2016-2028
Figure 4.23 Global Automated Storage & Retrieval Systems Market Forecast: Revenue ($m), AGR (%), 2016-2028
Figure 5.1 World Lab Automation Market: Revenues ($m) by Region, 2016
Figure 5.2 World Lab Automation Market: Revenues ($m) by Region, 2017
Figure 5.3 Global Lab Automation Market Forecast: Revenue ($m), AGR (%), 2016-2028
Figure 5.4 World Lab Automation Market: Market Shares (%) by Regional Market, 2016
Figure 5.5 World Lab Automation Market: Market Shares (%) by Regional Market, 2022
Figure 5.6 World Lab Automation Market: Market Shares (%) by Regional Market, 2028
Figure 6.1 North America Lab Automation Market Forecast: Revenues ($m), AGR (%), 2016-2028
Figure 6.2 North America Lab Automation Market: Market Shares (%) by Country Market, 2016
Figure 6.3 North America Lab Automation Market: Market Shares (%) by Country Market, 2022
Figure 6.4 North America Lab Automation Market: Market Shares (%) by Country Market, 2028
Figure 6.5 U.S. Lab Automation Market Forecast: Revenues ($m), AGR (%), 2016-2028
Figure 6.6 Canada Lab Automation Market Forecast: Revenues ($m), AGR (%), 2016-2028
Figure 7.1 Europe Lab Automation Market Forecast: Revenues ($m), AGR (%), 2016-2028
Figure 7.2 Europe Lab Automation Market: Market Shares (%) by Country Market, 2016
Figure 7.3 Europe Lab Automation Market: Market Shares (%) by Country Market, 2022
Figure 7.4 Europe Lab Automation Market: Market Shares (%) by Country Market, 2028
Figure 7.5 Germany Lab Automation Market Forecast: Revenues ($m), AGR (%), 2016-2028
Figure 7.6 France Lab Automation Market Forecast: Revenues ($m), AGR (%), 2016-2028
Figure 7.7 U.K. Lab Automation Market Forecast: Revenues ($m), AGR (%), 2016-2028
Figure 7.8 Italy Lab Automation Market Forecast: Revenues ($m), AGR (%), 2016-2028
Figure 7.9 Spain Lab Automation Market Forecast: Revenues ($m), AGR (%), 2016-2028
Figure 7.10 Russia Lab Automation Market Forecast: Revenues ($m), AGR (%), 2016-2028
Figure 7.11 Rest of Europe Lab Automation Market Forecast: Revenues ($m), AGR (%), 2016-2028
Figure 8.1 Asia-Pacific Lab Automation Market Forecast: Revenues ($m), AGR (%), 2016-2028
Figure 8.2 Asia-Pacific Lab Automation Market: Market Shares (%) by Country Market, 2016
Figure 8.3 Asia-Pacific Lab Automation Market: Market Shares (%) by Country Market, 2022
Figure 8.4 Asia-Pacific Lab Automation Market: Market Shares (%) by Country Market, 2028
Figure 8.5 China Lab Automation Market Forecast: Revenues ($m), AGR (%), 2016-2028
Figure 8.6 Japan Lab Automation Market Forecast: Revenues ($m), AGR (%), 2016-2028
Figure 8.7 India Lab Automation Market Forecast: Revenues ($m), AGR (%), 2016-2028
Figure 8.8 Australia & New Zealand Lab Automation Market Forecast: Revenues ($m), AGR (%), 2016-2028
Figure 8.9 Rest of Asia-Pacific Lab Automation Market Forecast: Revenues ($m), AGR (%), 2016-2028
Figure 9.1 Latin America Lab Automation Market Forecast: Revenues ($m), AGR (%), 2016-2028
Figure 9.2 Latin America Lab Automation Market: Market Shares (%) by Country Market, 2016
Figure 9.3 Latin America Lab Automation Market: Market Shares (%) by Country Market, 2022
Figure 9.4 Latin America Lab Automation Market: Market Shares (%) by Country Market, 2028
Figure 9.5 Brazil Lab Automation Market Forecast: Revenues ($m), AGR (%), 2016-2028
Figure 9.6 Mexico Lab Automation Market Forecast: Revenues ($m), AGR (%), 2016-2028
Figure 9.7 Rest of Latin America Lab Automation Market Forecast: Revenues ($m), AGR (%), 2016-2028
Figure 10.1 Middle East & Africa (MEA) Lab Automation Market Forecast: Revenues ($m), AGR (%), 2016-2028
Figure 10.2 Middle East & Africa Lab Automation Market: Market Shares (%) by Country Market, 2016
Figure 10.3 Middle East & Africa Lab Automation Market: Market Shares (%) by Country Market, 2022
Figure 10.4 Middle East & Africa Lab Automation Market: Market Shares (%) by Country Market, 2028
Figure 10.5 Saudi Arabia Lab Automation Market Forecast: Revenues ($m), AGR (%), 2016-2028
Figure 10.6 South Africa Lab Automation Market Forecast: Revenues ($m), AGR (%), 2016-2028
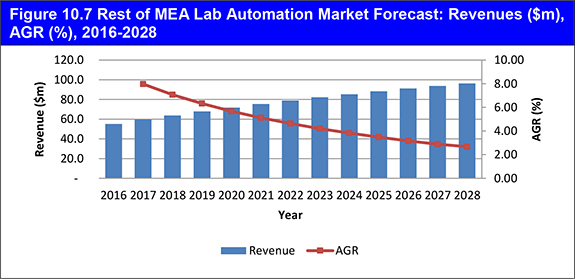
Figure 10.7 Rest of MEA Lab Automation Market Forecast: Revenues ($m), AGR (%), 2016-2028
Figure 11.1 Danaher Corporation: Revenue ($m), AGR (%), 2012-2016
Figure 11.2 Danaher Corporation: Business Segment Revenue Share (%), 2016
Figure 11.3 Danaher Corporation: Region Revenue Share (%), 2016
Figure 11.4 Thermo Fisher Scientific, Inc.: Revenue ($m), AGR (%), 2012-2016
Figure 11.5 Thermo Fisher Scientific, Inc.: Business Segment Revenue Share (%), 2016
Figure 11.6 Thermo Fisher Scientific, Inc.: Region Revenue Share (%), 2016
Figure 11.7 Roche: Revenue ($m), AGR (%), 2012-2016
Figure 11.8 Roche: Business Segment Revenue Share (%), 2016
Figure 11.9 Roche: Region Revenue Share (%), 2016
Figure 11.10 Siemens Healthineers: Revenue ($m), AGR (%), 2012-2016
Figure 11.11 Siemens Healthineers: Business Segment Revenue Share (%), 2016
Figure 11.12 Siemens Healthineers: Region Revenue Share (%), 2016
Figure 11.13 Qiagen N.V.: Revenue ($m), AGR (%), 2012-2016
Figure 11.14 Qiagen N.V.: Geographical Revenue Share (%), 2016
Figure 11.15 Abbott Laboratories: Revenue ($m), AGR (%), 2012-2016
Figure 11.16 Abbott Laboratories: Business Segment Revenue Share (%), 2016
Figure 11.17 Agilent Technologies, Inc.: Revenue ($m), AGR (%), 2013-2017
Figure 11.18 Agilent Technologies, Inc.: Business Segment Revenue Share (%), 2017
Figure 11.19 Agilent Technologies, Inc.: Geographical Revenue Share (%), 2017
Figure 11.20 Tecan Trading AG: Revenue ($m), AGR (%), 2012-2016
Figure 11.21 Tecan Trading AG: Business Segment Revenue Share (%), 2016
Figure 11.22 Tecan Trading AG: Geographical Revenue Share (%), 2016
Figure 11.23 PerkinElmer Inc.: Revenue ($m), AGR (%), 2013-2017
Figure 11.24 PerkinElmer Inc.: Geographical Revenue Share (%), 2017
Figure 11.25 PerkinElmer Inc.: Business Segment Revenue Share (%), 2017
Figure 12.1 Global Lab Automation Market by Product Type: Market Share (%), 2016
Figure 12.2 Lab Automation Market by Region Share (%), 2016, 2022, 2028
Abbott Laboratories
Agilent Technologies
Alere
AstraZeneca
BioTek Instruments, Inc.
CENTOGENE AG
Cepheid
Copper Merger Sub, Inc.
Danaher Corporation
EUROIMMUN Medical Laboratory Diagnostics AG
F. Hoffmann-La Roche AG
Finesse Solutions, Inc.
GE Healthcare
Genohm
Hamilton Robotics
iLab Solutions LLC
Labcyte Inc.
LabWare
Luxcel Biosciences
OmicSoft Corporation
Pall Corporation
PerkinElmer Inc.
Phenom-World
Qiagen N.V.
SCIEX
Sias AG
Siemens Healthineers
SPEware Corporation
St. Jude Medical, Inc.
Tecan Trading AG
Thermo Fisher Scientific, Inc.
Transcriptic
Viewics, Inc.
List of Other Organisations Mentioned in This Report
American Association for Clinical Chemistry
American Society for Clinical Pathology
Australian Bureau of Statistics
Centers for Medicare & Medicaid Services
College of American Pathologists
Food and Drug Administration
Health Care Development Services, Inc.
National Accrediting Agency for Clinical Laboratory Sciences
National Center for Biotechnology Information
Office for National Statistics
U.S. Census Bureau
U.S. Department of Commerce
US Bureau of Labor Statistics
Download sample pages
Complete the form below to download your free sample pages for Global Lab Automation Market Forecast 2018-2028
Related reports
-

Global Distribution Automation Market Report 2019-2029
Growing Renewable Power Generation capabilities are providing new opportunities.
...Full DetailsPublished: 01 January 1970 -

Pharma Wholesale and Distribution Market Forecasts 2018-2028
The pharma wholesale and distribution market is estimated to grow at a CAGR of 5.6% in the first half of...Full DetailsPublished: 06 November 2018 -
Next-Generation Pharmaceutical Temperature Management Solutions Market Report 2020-2030
Maintaining the quality and safety of the product in the supply chain has always been a high priority for pharmaceutical...Full DetailsPublished: 25 September 2020 -
Laboratory Information Management System (LIMS) Market Forecast 2020-2030
Experimental information management systems belong to the application software category designed to store and handle information obtained through laboratory work.
...Full DetailsPublished: 01 January 1970 -

Drug Discovery Outsourcing Market Forecast 2017-2027
Our 225-page report provides 150 tables, charts, and graphs. Read on to discover the most lucrative areas in the industry...
Full DetailsPublished: 13 October 2017 -
Global Laboratory Information Systems Market Forecast 2018-2028
The global laboratory information systems market was is valued at $1.8bn in 2017 and is expected to grow at a...
Full DetailsPublished: 19 November 2018 -

Clinical Trial Supply and Logistics Market for Pharma 2018-2028
The Global Clinical Trial Supply and Logistics Market is estimated at $15.77bn in 2017 and is expected to grow at...
Full DetailsPublished: 29 January 2018 -

Clinical Trial Packaging and Labelling Market Forecast 2020-2030
The global market for Clinical Trial Packaging and labelling is anticipated to reach US$657.0 million in 2020 and is further...
Full DetailsPublished: 24 March 2020 -

Biobanking Market Forecasts 2018-2028
Our 266-page report provides 145 tables, charts, clearly illustrating the data presented in this research. Read on to discover the...
Full DetailsPublished: 24 May 2018 -

Global Bioprocess Optimisation & Digital Biomanufacturing Market Forecast to 2029
The global market for bioprocess optimisation and digital biomanufacturing was valued to be $29.7bn in 2019 and is valued to...
Full DetailsPublished: 28 February 2020
Download sample pages
Complete the form below to download your free sample pages for Global Lab Automation Market Forecast 2018-2028
Do you have any custom requirements we can help you with?
Any specific country, geo region, market segment or specific company information?
Email us today, we can discuss your needs and see how we can help: jamie.roberts@visiongain.com
Would you like a free report overview of the report of your choice?
If so, please drop an email to Jamie Roberts stating your chosen report title to jamie.roberts@visiongain.com
Visiongain’s reports are based on comprehensive primary and secondary research. Those studies provide global market forecasts (sales by drug and class, with sub-markets and leading nations covered) and analyses of market drivers and restraints (including SWOT analysis) and current pipeline developments. To find out more about our reports methodology, please email jamie.roberts@visiongain.com
“Thank you for this Gene Therapy R&D Market report and for how easy the process was. Your colleague was very helpful and the report is just right for my purpose. This is the 2nd good report from Visiongain and a good price.”
Dr Luz Chapa Azuella, Mexico
American Association of Colleges of Pharmacy
American College of Clinical Pharmacy
American Pharmacists Association
American Society for Pharmacy Law
American Society of Consultant Pharmacists
American Society of Health-System Pharmacists
Association of Special Pharmaceutical Manufacturers
Australian College of Pharmacy
Biotechnology Industry Organization
Canadian Pharmacists Association
Canadian Society of Hospital Pharmacists
Chinese Pharmaceutical Association
College of Psychiatric and Neurologic Pharmacists
Danish Association of Pharmaconomists
European Association of Employed Community Pharmacists in Europe
European Medicines Agency
Federal Drugs Agency
General Medical Council
Head of Medicines Agency
International Federation of Pharmaceutical Manufacturers & Associations
International Pharmaceutical Federation
International Pharmaceutical Students’ Federation
Medicines and Healthcare Products Regulatory Agency
National Pharmacy Association
Norwegian Pharmacy Association
Ontario Pharmacists Association
Pakistan Pharmacists Association
Pharmaceutical Association of Mauritius
Pharmaceutical Group of the European Union
Pharmaceutical Society of Australia
Pharmaceutical Society of Ireland
Pharmaceutical Society Of New Zealand
Pharmaceutical Society of Northern Ireland
Professional Compounding Centers of America
Royal Pharmaceutical Society
The American Association of Pharmaceutical Scientists
The BioIndustry Association
The Controlled Release Society
The European Federation of Pharmaceutical Industries and Associations
The European Personalised Medicine Association
The Institute of Clinical Research
The International Society for Pharmaceutical Engineering
The Pharmaceutical Association of Israel
The Pharmaceutical Research and Manufacturers of America
The Pharmacy Guild of Australia
The Society of Hospital Pharmacists of Australia
Latest Pharma news
Visiongain Publishes Drug Delivery Technologies Market Report 2024-2034
The global Drug Delivery Technologies market is estimated at US$1,729.6 billion in 2024 and is projected to grow at a CAGR of 5.5% during the forecast period 2024-2034.
23 April 2024
Visiongain Publishes Cell Therapy Technologies Market Report 2024-2034
The cell therapy technologies market is estimated at US$7,041.3 million in 2024 and is projected to grow at a CAGR of 10.7% during the forecast period 2024-2034.
18 April 2024
Visiongain Publishes Automation in Biopharma Industry Market Report 2024-2034
The global Automation in Biopharma Industry market is estimated at US$1,954.3 million in 2024 and is projected to grow at a CAGR of 7% during the forecast period 2024-2034.
17 April 2024
Visiongain Publishes Anti-obesity Drugs Market Report 2024-2034
The global Anti-obesity Drugs market is estimated at US$11,540.2 million in 2024 and is expected to register a CAGR of 21.2% from 2024 to 2034.
12 April 2024
