The global drug of abuse testing market was valued at $4.4bn in 2016 and is projected to grow at a CAGR of 4.9% in the first half of the forecast period. The market is dominated by the Employment Testing submarket which held 39.3% share of that market in 2016.
How this report will benefit you
Read on to discover how you can exploit the future business opportunities emerging in this sector.
In this brand new 165 page report you will receive 78 tables and 71 figures – all unavailable elsewhere.
The 165-page report provides clear detailed insight into the global drug of abuse testing market. Discover the key drivers and challenges affecting the market.
By ordering and reading our brand new report today you stay better informed and ready to act.
Report Scope
• Global Drug of Abuse Testing Market forecasts from 2017-2027
• Revenue forecast for drug of abuse testing market by Type:
• Employment Testing
• Random Testing
• Reasonable Testing
• Post-Accident Testing
• Other
Each submarket is further divided by region: North America, Latin America, Europe, APEJ, Japan and MEA
• Revenue forecast for drug of abuse testing market by Sample Type:
• Saliva
• Breath
• Urine
• Blood
• Hair
• Sweat
Each submarket is further divided by region: North America, Latin America, Europe, APEJ, Japan and MEA
• Revenue forecast for drug of abuse testing market by Application:
• Schools and Educational Institutes
• Hospitals and Healthcare Units
• Government and Private Departments
• Others
Each submarket is further divided by region: North America, Latin America, Europe, APEJ, Japan and MEA
• This report provides individual revenue forecasts to 2027 for these regional and national markets:
• North America: the US and Canada
• Latin America: Mexico, Brazil, Argentina
• Europe: Germany, France, UK, Italy, Spain, Rest of Europe
• APEJ: China, India, Australia, Rest of APEJ
• MEA: GCC Countries, South Africa, Rest of MEA
• Japan
Each regional market is further divided by type, sample type and application.
• This report discusses the leading companies in the global drug of abuse testing market:
• Abbott
• Danaher
• Roche
• Siemens
• Biomerieux, Inc.
• Bio-Rad Laboratories
• Express Diagnostics International
• Quest Diagnostics Incorporated
• Thermo Fisher Scientific
• Agilent Technologies, Inc.
• This report discusses the drivers, restraints as well as porter’s five forces analysis of the global drug of abuse testing market
Visiongain’s study is intended for anyone requiring commercial analyses for the global drug of abuse testing market. You find data, trends and predictions.
Buy our report today Global Drug of Abuse Testing Market Report 2017-2027: Employment Testing, Random Testing, Reasonable Testing, Post-Accident Testing, Saliva, Breath, Urine, Blood, Hair, Sweat, Schools and Educational Institutes, Hospitals and Healthcare Units, Government and Private Departments and Others.
Visiongain is a trading partner with the US Federal Government
CCR Ref number: KD4R6
1. Report Overview
1.1 Global Drug of Abuse Testing Ingredients Market Overview
1.2 Why You Should Read This Report
1.3 Global Drug of Abuse Testing Market Segmentation
1.4 How This Report Delivers
1.5 Key Questions Answered by This Analytical Report Include:
1.6 Who is This Report for?
1.7 Methodology
1.7.1 Primary Research
1.7.2 Secondary Research
1.7.3 Market Evaluation& Forecasting Methodology
1.8 Frequently Asked Questions (FAQ)
1.9 Associated Visiongain Reports
1.10 About visiongain
2. Introduction to the Drug of Abuse Testing market
2.1 What is Drug of Abuse Testing?
2.2 What is Drug of Abuse Testing Used For?
2.3 What Does the Test Result Mean?
3. Global Drug of Abuse Testing Market 2017-2027
3.1 Global Drug of Abuse Testing Market Forecast 2017-2027
3.2 Porters Five Forces Analysis
3.3 Threat of New Entrants
3.4 Threat of Substitutes
3.5 Bargaining Power of Suppliers
3.6 Bargaining Power of Buyers
3.7 Competitive Rivalry
3.8 Global Drug of Abuse Testing Market Drivers and Restraints 2017
3.8.1 Drivers
3.8.2 Increasing production and trafficking of illegal drugs
3.8.3 Increase in drug related deaths and accidents
3.8.4 Increasing demand for high safety and productivity of employees
3.8.5 Mandate drug testing policies
3.8.6 Restraints
3.8.7 Duping the drug of abuse test
4. Global Drug of Abuse Testing Market by Type, 2017-2027
4.1 Drug of Abuse Testing Market Shares by Type
4.1.1 Employment Testing Submarket Forecast 2017-2027
4.1.2 Random Testing Submarket Forecast 2017-2027
4.1.3 Reasonable Testing Submarket Forecast 2017-2027
4.1.4 Post-Accident Testing Submarket Forecast 2017-2027
5. Global Drug of Abuse Testing Market by Sample Type, 2017-2027
5.1 Drug of Abuse Testing Market Shares by Sample Type
5.1.1 Saliva Sample Type Submarket Forecast 2017-2027
5.1.2 Breath Sample Type Submarket Forecast 2017-2027
5.1.3 Urine Sample Type Submarket Forecast 2017-2027
5.1.4 Blood Sample Type Submarket Forecast 2017-2027
5.1.5 Hair Sample Type Submarket Forecast 2017-2027
5.1.6 Sweat Sample Type Submarket Forecast 2017-2027
6. Global Drug of Abuse Testing Market by Application, 2017-2027
6.1 Drug of Abuse Testing Market Shares by Application
6.1.1 Schools and Educational Institutes Submarket Forecast 2017-2027
6.1.2 Hospitals and Healthcare Units Submarket Forecast 2017-2027
6.1.3 Government and Private Departments Submarket Forecast 2017-2027
6.1.4 Other Submarket Forecast 2017-2027
7. Leading National Drug of Abuse Testing Markets Forecast 2017-2027
7.1 North America Drug of Abuse Testing Market Regional Analysis
7.2 Latin America Drug of Abuse Testing Market Regional Analysis
7.3 Europe Drug of Abuse Testing Market Regional Analysis
7.4 APEJ Drug of Abuse Testing Market Regional Analysis
7.5 Japan Drug of Abuse Testing Market Regional Analysis
7.6 MEA Drug of Abuse Testing Market Regional Analysis
8. Leading Players in Global Drug of Abuse Testing Market 2017-2027
8.1 Abbott Industries
8.1.1 Company Overview
8.1.2 Company Snapshot
8.1.3 Product Portfolio
8.1.4 Business performance
8.1.5 Key Developments
8.2 Danaher Corporation
8.2.1 Company overview
8.2.2 Company Snapshot
8.2.3 Product portfolio
8.2.4 Business performance
8.2.5 Key Developments
8.3 F. Hoffmann-La Roche AG (Roche Diagnostics)
8.3.1 Company overview
8.3.2 Company snapshot
8.3.3 Operating business segments
8.3.4 Product portfolio
8.3.5 Business Performance
8.3.6 Key Developments
8.4 Bio-Rad Laboratories, Inc.
8.4.1 Company overview
8.4.2 Company snapshot
8.4.3 Operating business segments
8.4.4 Product portfolio
8.4.5 Business Performance
8.4.6 Key Developments
8.5 Express Diagnostics International Inc.
8.5.1 Company overview
8.5.2 Operating business segments
8.5.3 Business Performance
8.5.4 Key Developments
8.6 Quest Diagnostics Incorporated
8.6.1 Company overview
8.6.2 Company snapshot
8.6.3 Operating business segments
8.6.4 Product portfolio
8.6.5 Business Performance
8.6.6 Key Developments
8.7 Siemens Aktiengesellschaft
8.7.1 Company overview
8.7.2 Company snapshot
8.7.3 Operating segments
8.7.4 Product portfolio
8.7.5 Business Performance
8.7.6 Key Developments
8.8 Thermo Fisher Scientific Inc.
8.8.1 Company overview
8.8.2 Company snapshot
8.8.3 Operating business segments
8.8.4 Product portfolio
8.8.5 Business Performance
8.8.6 Key Developments
8.9 Agilent Technologies Inc.
8.9.1 Company overview
8.9.2 Company snapshot
8.9.3 Operating business segments
8.9.4 Product portfolio
8.9.5 Business Performance
8.9.6 Key Developments
8.10 BioMerieux, Inc.
8.10.1 Company Overview:
8.10.2 Company snapshot
8.10.3 Business Performance
8.10.4 Key Developments
9. Conclusion
Appendices
Visiongain Associated Report
Visiongain Report Sales Order Form
About Visiongain
Visiongain report evaluation form
List of Tables
Table 3.1 Global Drug of Abuse Testing Market Forecast ($M, AGR%, CAGR%) 2016-2027
Table 4.1 Global Drug of Abuse Testing Market Forecast by Type: ($M, AGR%, CAGR%) 2016-2027
Table 4.2 Employment Testing Submarket Forecast by Region: ($M, AGR%, CAGR%) 2016-2027
Table 4.3 Random Testing Submarket Forecast by Region: ($M, AGR%, CAGR%) 2016-2027
Table 4.4 Reasonable Testing Submarket Forecast by Region ($M, AGR%, CAGR%) 2016-2027
Table 4.5 Post-Accident Testing Submarket Forecast by Region ($M, AGR%, CAGR%) 2016-2027
Table 5.1 Global Drug of Abuse Testing Market Forecast by Sample Type ($M, AGR%, CAGR%) 2016-2027
Table 5.2 Saliva Testing Submarket Forecast by Region ($M, AGR%, CAGR%) 2016-2027
Table 5.3 Breath Testing Submarket Forecast by Region: ($M, AGR%, CAGR%) 2016-2027
Table 5.4 Urine Testing Submarket Forecast by Region: ($M, AGR%, CAGR%) 2016-2027
Table 5.5 Blood Testing Submarket Forecast by Region: ($M, AGR%, CAGR%) 2016-2027
Table 5.6 Hair Testing Submarket Forecast by Region: ($M, AGR%, CAGR%) 2016-2027
Table 5.7 Sweat Testing Submarket Forecast by Region: ($M, AGR%, CAGR%) 2016-2027
Table 6.1 Global Drug of Abuse Testing Market Forecast by Application: ($M, AGR%, CAGR%) 2016-2027
Table 6.2 Schools and Educational Institutes Submarket Forecast by Region: ($M, AGR%, CAGR%) 2016-2027
Table 6.3 Hospitals and Healthcare Units Submarket Forecast by Region: ($M, AGR%, CAGR%) 2016-2027
Table 6.4 Government and Private Departments Submarket Forecast by Region: ($M, AGR%) 2016-2027
Table 6.5 Other Submarket Forecast by Region: ($M, AGR%, CAGR%) 2016-2027
Table 7.1 Global Drug of Abuse Testing Market Forecast by Region: ($M, AGR%, CAGR%) 2016-2027
Table 7.2 North America Drug of Abuse Testing Market Forecast by Type: ($M, AGR%, CAGR%) 2016-2027
Table 7.3 North America Drug of Abuse Testing Market Forecast by Sample Type: ($M, AGR%, CAGR%) 2016-2027
Table 7.4 North America Drug of Abuse Testing Market Forecast by Application: ($M, AGR%, CAGR%) 2016-2027
Table 7.5 North America Drug of Abuse Testing Market Forecast by Country: ($M, AGR%, CAGR%) 2016-2027
Table 7.6 Latin America Drug of Abuse Testing Market Forecast by Type: ($M, AGR%, CAGR%) 2016-2027
Table 7.7 Latin America Drug of Abuse Testing Market Forecast by Sample Type: ($M, AGR%, CAGR%) 2016-2027
Table 7.8 Latin America Drug of Abuse Testing Market Forecast by Application: ($M, AGR%, CAGR%) 2016-2027
Table 7.9 Latin America Drug of Abuse Testing Market Forecast by Country: ($M, AGR%, CAGR%) 2016-2027
Table 7.10 Europe Drug of Abuse Testing Market Forecast by Type: ($M, AGR%, CAGR%) 2016-2027
Table 7.11 Europe Drug of Abuse Testing Market Forecast by Sample Type: ($M, AGR%, CAGR%) 2016-2027
Table 7.12 Europe Drug of Abuse Testing Market Forecast by Application: ($M, AGR%, CAGR%) 2016-2027
Table 7.13 Europe Drug of Abuse Testing Market Forecast by Country: ($M, AGR%, CAGR%) 2016-2027
Table 7.14 APEJ Drug of Abuse Testing Market Forecast by Type: ($M, AGR%, CAGR%) 2016-2027
Table 7.15 APEJ Drug of Abuse Testing Market Forecast by Sample Type: ($M, AGR%, CAGR%) 2016-2027
Table 7.16 APEJ Drug of Abuse Testing Market Forecast by Application: ($M, AGR%, CAGR%) 2016-2027
Table 7.17 APEJ Drug of Abuse Testing Market Forecast by Country: ($M, AGR%, CAGR%) 2016-2027
Table 7.18 Japan Drug of Abuse Testing Market Forecast by Type ($M, AGR%, CAGR%) 2016-2027
Table 7.19 Japan Drug of Abuse Testing Market Forecast by Sample Type ($M, AGR%, CAGR%) 2016-2027
Table 7.20 Japan Drug of Abuse Testing Market Forecast by Application: ($M, AGR%, CAGR%) 2016-2027
Table 7.21 MEA Drug of Abuse Testing Market Forecast by Type: ($M, AGR%, CAGR%) 2016-2027
Table 7.22 MEA Drug of Abuse Testing Market Forecast by Sample Type: ($M, AGR%, CAGR%) 2016-2027
Table 7.23 MEA Drug of Abuse Testing Market Forecast by Application: ($M, AGR%, CAGR%) 2016-2027
Table 7.24 MEA Drug of Abuse Testing Market Forecast by Country: ($M, AGR%, CAGR%) 2016-2027
Table 8.1. Company Snapshot: Abbott Laboratories
Table 8.2. Business Segments: Abbott Laboratories
Table 8.3. Product Portfolio: Abbott Laboratories
Table 8.4. Key Developments: Abbott Laboratories
Table 8.5. Company Snapshot: Danaher Corporation
Table 8.6. Business Segments: Danaher Corporation
Table 8.7. Product Portfolio: Danaher Corporation
Table 8.8. Key Developments: Danaher Corporation
Table 8.9. Company Snapshot: F. Hoffmann-La Roche Ag
Table 8.10. Business Segments: F. Hoffmann-La Roche Ag
Table 8.11. Product Portfolio: F. Hoffmann-La Roche Ag
Table 8.12. Key Developments: F. Hoffmann-La Roche Ag
Table 8.13. Company Snapshots: Bio-Rad Laboratories, Inc.
Table 8.14. Business Segments: Bio-Rad Laboratories, Inc.
Table 8.15. Product Portfolio: Bio-Rad Laboratories, Inc.
Table 8.16. Key Developments: Bio-Rad Laboratories, Inc.
Table 8.17. Company Snapshot: Express Diagnostics International Inc.
Table 8.18. Business Segments: Express Diagnostics International Inc.
Table 8.19. Key Developments: Express Diagnostics International Inc.
Table 8.20. Company Snapshot: Quest Diagnostics Incorporated
Table 8.21. Business Segments: Quest Diagnostics Incorporated
Table 8.22. Product Portfolio: Quest Diagnostics Incorporated
Table 8.23. Key Developments: Quest Diagnostics Incorporated
Table 8.24. Company Snapshots: Siemens Ag
Table 8.25. Business Segments: Siemens Ag
Table 8.26. Product Portfolio: Siemens Ag
Table 8.27. Key Developments: Siemens Ag
Table 8.28. Key Developments: Thermo Fisher Scientific Inc.
Table 8.29. Operating Segments: Thermo Fisher Scientific Inc.
Table 8.30. Product Portfolio: Thermo Fisher Scientific Inc.
Table 8.31. Key Developments: Thermo Fisher Scientific Inc.
Table 8.32. Company Snapshot: Agilent Technologies Inc.
Table 8.33. Business Segments: Agilent Technologies Inc.
Table 8.34. Product Portfolio: Agilent Technologies Inc.
Table 8.35. Key Developments: Agilent Technologies Inc.
Table 8.36. Company Snapshot: Biomerieux, Inc.
List of Figure
Figure 1.2 Global Drug of Abuse Testing Market Segmentation
Figure 4.1 Global Drug of Abuse Testing Market by Type: Growth Rate Forecast (AGR %) 2017-2027
Figure 4.2 Global Drug of Abuse Testing Market Shares by Type: (% Share), 2016
Figure 4.3 Global Drug of Abuse Testing Market Shares by Type: (% Share), 2022
Figure 4.4 Global Drug of Abuse Testing Market Shares by Type: (% Share), 2027
Figure 4.5 Employment Testing Submarket Forecast ($M, AGR%), 2017-2027
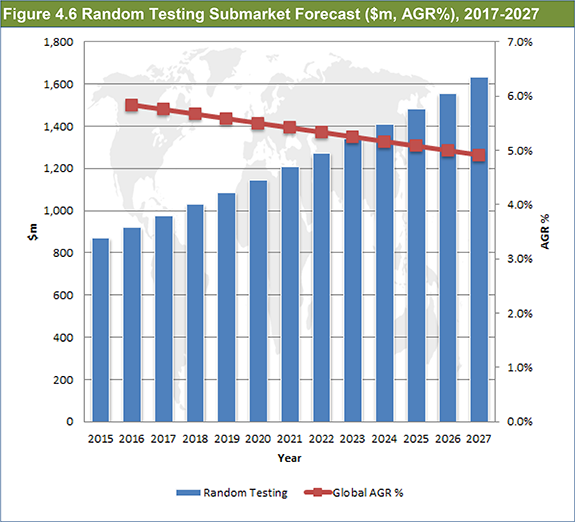
Figure 4.6 Random Testing Submarket Forecast ($M, AGR%), 2017-2027
Figure 4.7 Reasonable Testing Submarket Forecast ($M, AGR%), 2017-2027
Figure 4.8 Post-Accident Testing Submarket Forecast ($M, AGR%), 2017-2027
Figure 5.1 Drug of Abuse Testing Market by Sample Type: Growth Rate Forecast: (AGR %), 2017-2027
Figure 5.2 Global Drug of Abuse Testing Market Shares by Sample Type: (% Share), 2016
Figure 5.3 Global Drug of Abuse Testing Market Shares by Sample Type: (% Share), 2022
Figure 5.4 Global Drug of Abuse Testing Market Shares by Sample Type: (% Share), 2027
Figure 5.5 Saliva Testing Submarket Forecast ($M, AGR%), 2017-2027
Figure 5.6 Breath Testing Submarket Forecast ($M, AGR%), 2017-2027
Figure 5.7 Urine Testing Submarket Forecast ($M, AGR%), 2017-2027
Figure 5.8 Blood Testing Submarket Forecast ($M, AGR%), 2017-2027
Figure 5.9 Hair Testing Submarket Forecast ($M, AGR%), 2017-2027
Figure 5.10 Sweat Testing Submarket Forecast ($M, AGR%), 2017-2027
Figure 6.1 Drug of Abuse Testing Market by Application: Growth Rate Forecast (AGR %), 2017-2027
Figure 6.2 Global Drug of Abuse Testing Market Shares by Application: (% Share), 2016
Figure 6.3 Global Drug of Abuse Testing Market Shares by Application: (% Share), 2022
Figure 6.4 Global Drug of Abuse Testing Market Shares by Application: (% Share), 2027
Figure 6.5 Schools and Educational Institutes Submarket Forecast ($M, AGR%), 2017-2027
Figure 6.6 Hospitals and Healthcare Units Submarket Forecast ($M, AGR%), 2017-2027
Figure 6.7 Government and Private Departments Submarket Forecast ($M, AGR%), 2017-2027
Figure 6.8 Other Submarket Forecast ($M, AGR%), 2017-2027
Figure 7.1 Drug of Abuse Testing Market by Region: Growth Rate Forecast (AGR %), 2017-2027
Figure 7.2 North America Drug of Abuse Testing Market Shares by Country: (% Share), 2016
Figure 7.3 North America Drug of Abuse Testing Market Shares by Country: (% Share), 2022
Figure 7.4 North America Drug of Abuse Testing Market Shares by Country: (%), 2027
Figure 7.5 Latin America Drug of Abuse Testing Market Shares by Country: (% Share), 2016
Figure 7.6 Latin America Drug of Abuse Testing Market Shares by Country: (% Share), 2022
Figure 7.7 Latin America Drug of Abuse Testing Market Shares by Country: (% Share), 2027
Figure 7.8 Europe Drug of Abuse Testing Market Shares by Country: (% Share), 2016
Figure 7.9 Europe Drug of Abuse Testing Market Shares by Country: (% Share), 2022
Figure 7.10 Europe Drug of Abuse Testing Market Shares by Country: (% Share), 2027
Figure 7.11 APEJ Drug of Abuse Testing Market Shares by Country: (% Share), 2016
Figure 7.12 APEJ Drug of Abuse Testing Market Shares by Country: (% Share), 2022
Figure 7.13 APEJ Drug of Abuse Testing Market Shares by Country: (% Share), 2027
Figure 7.14 MEA Drug of Abuse Testing Market Shares by Country: (% Share), 2016
Figure 7.15 MEA Drug of Abuse Testing Market Shares by Country: (% Share), 2022
Figure 7.16 MEA Drug of Abuse Testing Market Shares by Country: (% Share), 2027
Figure 8.1 Abbott: Net Sales, 2014–2016 ($Million)
Figure 8.2 Abbott: Revenue by Segment, 2016 (%)
Figure 8.3 Abbott: Revenue by Geography, 2016 (%)
Figure 8.4 Danaher Corporation: Net Sales, 2014-2016 ($Million)
Figure 8.5 Danaher Corporation: Revenue by Segment, 2016 (%)
Figure 8.6 Danaher Corporation: Revenue by Geography, 2016 (%)
Figure 8.7 F. Hoffmann-La Roche Ag: Net Sales, 2014–2016 ($Million)
Figure 8.8 F. Hoffmann-La Roche Ag: Revenue by Segment (%)
Figure 8.9 F. Hoffmann-La Roche Ag: Revenue by Geography (%)
Figure 8.10 Bio-Rad Laboratories, Inc.: Net Sales, 2014–2016 ($Million)
Figure 8.11 Bio-Rad Laboratories, Inc.: Revenue Share by Segment, 2016 (%)
Figure 8.12 Bio-Rad Laboratories, Inc.: Revenue Share by Segment, 2016 (%)
Figure 8.13 Quest Diagnostics Incorporated: Net Sales, 2014-2016 ($ Million)
Figure 8.14 Quest Diagnostics Incorporated: Revenue Share by Segment, 2016 (%)
Figure 8.15 Siemens Ag: Net Sales, 2014–2016 ($Million)
Figure 8.16 Siemens Ag: Revenue Share by Segment, 2016 (%)
Figure 8.16 Siemens Ag: Revenue Share by Geography, 2016 (%)
Figure 8.18 Thermo Fisher: Net Sales, 2014–2016 ($Million)
Figure 8.19 Thermo Fisher: Revenue Share by Segment, 2016 (%)
Figure 8.20 Thermo Fisher: Revenue Share by Geography, 2016 (%)
Figure 8.21 Agilent Technologies Inc.: Net Sales, 2014–2016 ($Million)
Figure 8.22 Agilent Technologies Inc.: Revenue by Segment, 2016 (%)
Figure 8.23 Agilent Technologies Inc.: Revenue by Geography, 2016 (%)
Figure 8.24 Biomeriux: Revenue by Geography (%)
Figure 9.1 Global Drug of Abuse Testing Market Shares by Type Forecast: (% Share), 2016
Figure 9.2 Global Drug of Abuse Testing Market Shares by Sample Type: (% Share), 2016
Figure 9.3 Leading Drug of Abuse Testing Application Submarkets Shares by Application: (% Share), 2016
Figure 9.4 Leading Drug of Abuse Testing Regional Submarkets Shares by Country: (% Share), 2016


