The global anti-obesity drugs market is estimated to have reached $1.9bn in 2019 and is expected to grow at a CAGR of 32% in the first half of the forecast period. In 2019, the innovator drugs submarket held 75% of the global anti-obesity drugs market.
How this report will benefit you
Read on to discover how you can exploit the future business opportunities emerging in this sector.
In this brand new 285-page report you will receive 146 tables and 137 figures– all unavailable elsewhere.
The 285-page report provides clear detailed insight into the anti-obesity drugs market. Discover the key drivers and challenges affecting the market.
By ordering and reading our brand-new report today you stay better informed and ready to act.
Report Scope
• Global Anti-obesity Drugs Market forecast from 2020-2030
• Global Anti-obesity Drugs Market analysis and forecast from 2018-2028, by Mechanism of Action:
• Incretion mimetics/GLP-1 agonists
• SNDRIs
• Lipase Inhibitors
• Serotonin receptor agonists
• Sympathomimetic-GABA receptor agonists
• Sympathomimetics
• Global Anti-obesity Drugs Market analysis and forecast from 2020-2030, by Duration of Therapy:
• Long-term Drugs
• Short-term Drugs
• Global Anti-obesity Drugs Market analysis and forecast from 2020-2030, by Innovator vs Generic Drugs:
• Innovator
• Generic Drugs
• Global Anti-obesity Drugs Market analysis and forecast from 2020-2030, by Prescription vs OTC:
• Prescription Drugs
• OTC
• This report discusses and provides revenue forecasts from 2020-2030 for selected anti-obesity drugs:
• Saxenda
• Contrave/Mysimba
• Belviq
• Qysmia
• Xenical
• Alli
• This report provides individual revenue forecasts from 2020-2030 for these regional and national markets:
• US
• Japan
• EU5: Germany, France, Spain, Italy, UK
• BRIC: Brazil, Russia, China, India
• RoW
Each national market is further segmented by submarket: mechanism of action, duration of therapy, prescription vs OTC, innovator vs generic drugs.
• Our study discusses the selected leading companies that are the major players in the anti-obesity drugs market:
• Arena Pharmaceuticals
• AstraZeneca
• Carmot Therapeutics
• CohBar
• Currax Pharmaceuticals LLC
• Eisai
• ERX Pharmaceuticals
• Gelesis
• GlaxoSmithKline (GSK)
• Hanmi Pharmaceutical
• LNC Therapeutics
• Novartis
• Novo Nordisk
• Pfizer
• Rhythm Pharmaceuticals, Inc.
• Roche
• Saniona
• Scohia Pharma, Inc.
• Sinil Pharmaceutical Co., Ltd
• Takeda
• Teva
• Vivus
• This report discusses novel mechanism of action, active pipeline molecules and promising pipeline molecules.
• This report gives an overview of pricing and reimbursement in the US and EU.
• This report provides a SWOT Analysis of the global anti-obesity drugs market.
• Key questions answered by this report:
• How is the anti-obesity drugs market evolving?
• What is driving and restraining anti-obesity drugs dynamics?
• How will each anti-obesity drugs submarket market grow over the forecast period and how much Sales will these submarkets account for in 2030?
• How will market shares of each anti-obesity drugs submarket develop from 2020-2030? Which individual technologies will prevail and how will these shifts be responded to?
• Which anti-obesity drugs submarket will be the main driver of the overall market from 2020-2030?
• How will political and regulatory factors influence regional anti-obesity drugs markets and submarkets?
• Will leading national anti-obesity drugs markets broadly follow macroeconomic dynamics, or will individual country sectors outperform the rest of the economy?
• How will market shares of the national markets change by 2030 and which nation will lead the market in 2030?
• Who are the leading players and what are their prospects over the forecast period?
• How will the sector evolve as alliances form during the period between 2020 and 2030?
Visiongain’s study is intended for anyone requiring commercial analyses for the anti-obesity drugs market. You find data, trends and predictions.
Buy our report today Global Anti-obesity Drugs Market Forecast: Mechanism of Action, Innovator Drugs, Generics. Prescription Drugs, OTC, Duration of Therapy, Incretin Mimetics/GLP-1 Agonists, SNDRIs, Lipase Inhibitors, Serotonin Receptor Agonists, Sympathomimetic-GABA Receptor Agonists, Sympathomimetics, Short-term Drugs, Long-term Drugs.
Visiongain is a trading partner with the US Federal Government
CCR Ref number: KD4R6
Do you have any custom requirements we can help you with? Any need for specific country, geo region, market segment or specific company information? Contact us today, we can discuss your needs and see how we can help: sara.peerun@visiongain.com
1. Report Overview
1.1 Why You Should Read This Report
1.2 How This Report Delivers
1.3 Key Questions Answered by This Analytical Report:
1.4 Who is This Report for?
1.5 Methodology
1.5.1 Primary Research
1.5.2 Secondary Research
1.5.3 Market Evaluation & Forecasting Methodology
1.6 Frequently Asked Questions
1.7 Associated Reports
1.8 About Visiongain
2. Introduction to Obesity
2.1 What is Obesity?
2.1.1 Types of obesity
2.1.1.1 Central Obesity / Android Type
2.1.1.2 Peripheral Obesity/ Gynoid Type
2.2 What are the causes and risk factors of obesity?
2.2.1 Energy Imbalance
2.2.2 Genetic Predisposition
2.2.3 Unhealthy Diet
2.2.4 Health Conditions and Medicines
2.2.5 Emotional Factors
2.2.6 Age
2.2.7 Pregnancy
2.2.8 Lack of Sleep
2.2.9 Smoking
2.3 Obesity Measurement
2.3.1 BMI
2.3.2 Waist circumference
2.3.3 Index of Central Obesity
2.3.4 Bioelectrical Impedance Analysis
2.3.5 New Approaches/Techniques
2.4 Epidemiology of Obesity
2.4.1 Epidemiology by Geography
2.4.2 Epidemiology by Country
2.4.3 Historical Prevalence in Major Markets
2.4.4 Forecast of Obesity Prevalence in Major Markets
2.5 Humanistic and Economic Burden
2.5.1 Mortality
2.5.2 Morbidity
2.5.2.1 Disability-adjusted life year (DALY)
2.5.2.2 Years Lost due to Disability (YLD)
2.5.2.3 Years of Life Lost (YLL)
2.5.3 Economic Impact
2.6 Obesity: Prevention and Treatment
2.6.1 Lifestyle changes
2.6.2 Pharmacotherapy
2.6.3 Other treatments
3. Introduction to the Global Anti-obesity Drugs Market
3.1 Market Structure
3.2 Market Definition and Scope
3.3 Classification by Mechanism of Action
3.3.1 Incretin Mimetics/GLP-1 Agonists
3.3.2 Lipase Inhibitors
3.3.3 Serotonin-norepinephrine-dopamine Reuptake (SNDRI) Inhibitors
3.3.4 Serotonin Receptor Agonists
3.3.5 Sympathomimetics
3.3.6 Sympathomimetic-GABA Receptor Agonists
3.3.7 Others
3.4 Classification by Innovator or Generics Drugs
3.4.1 Innovator Drugs
3.4.2 Generics Drugs
3.5 Classification by Prescription or OTC drugs
3.5.1 Prescription drugs
3.5.2 OTC drugs
3.6 Classification by Duration of Therapy
3.6.1 Short-term drugs
3.6.2 Long-term drugs
4. Global Anti-obesity Drugs Market 2020-2030
4.1 Global Anti-obesity Drugs Market 2019
4.2 Global Anti-obesity Drugs Market Forecast 2020-2030
4.3 Global Anti-obesity Drugs by Mechanism of Action
4.3.1 Global Anti-obesity Drugs by Mechanism of Action: Market Forecasts 2020-2030
4.3.1.1 Incretin mimetics/GLP-1 Agonists: Market Forecasts 2020-2030
4.3.1.2 Lipase Inhibitors: Market Forecasts 2020-2030
4.3.1.3 Serotonin-norepinephrine-dopamine Reuptake Inhibitors (SNDRI): Market Forecasts 2020-2030
4.3.2 Serotonin Receptor Agonists: Market Forecasts 2020-2030
4.3.2.1 Sympathomimetic-GABA Receptor Agonists: Market Forecasts 2020-2030
4.3.2.2 Sympathomimetics: Market Forecasts 2020-2030
4.3.2.3 Others: Market Forecasts 2020-2030
4.3.3 Global Anti-obesity Drugs Market Forecasts by Mechanism of Action: Market Share 2020-2030
4.4 Global Anti-obesity Drugs Market by Innovator and Generics Drugs
4.4.1 Global Anti-obesity Drugs by Innovator Drugs and Generics: Market Forecasts 2020-2030
4.4.1.1 Innovator Drugs: Market Forecasts 2020-2030
4.4.1.2 Generics: Market Forecasts 2020-2030
4.4.2 Global Anti-obesity Drugs Market Forecast by Innovator Drugs and Generics: Market Share 2020-2030
4.5 Global Anti-obesity Drugs Market by Prescription and OTC Drugs
4.5.1 Global Anti-obesity Drugs Market by Prescription and OTF Drugs: Market Forecast 2020-2030
4.5.1.1 Prescription Drugs: Market Forecasts 2020-2030
4.5.1.2 OTC Drugs: Market Forecasts 2020-2030
4.5.2 Global Anti-obesity Drugs Market Forecast by Prescription and OTC Drugs: Market Share 2020-2030
4.6 Global Anti-obesity Drugs Market by Duration of Therapy
4.6.1 Global Anti-obesity Drugs Market by Duration of Therapy: Market Forecast 2019-2030
4.6.1.1 Short-term Anti-obesity Drugs: Market Forecasts 2020-2030
4.6.1.2 Long-term Anti-obesity Drugs: Market Forecasts 2020-2030
4.6.2 Global Anti-obesity Drugs Market Forecast by Duration of Therapy: Market Share 2019-2030
4.7 Overall Global Anti-obesity Drugs Market Drivers, Restraints and Trends
5. Leading Anti-obesity Drugs
5.1 Snapshot of Anti-obesity Drugs
5.2 Innovator Drugs
5.2.1 Saxenda
5.2.1.1 Saxenda Drug Profile
5.2.1.2 Saxenda Historical Sales
5.2.1.3 Saxenda Forecast 2020-2030
5.2.1.4 Saxenda Sales by Geography, 2018
5.2.2 Contrave / Mysimba
5.2.2.1 Contrave Drug Profile
5.2.2.2 Contrave Historical Sales
5.2.2.3 Contrave Forecast 2020-2030
5.2.2.4 Contrave Sales by Geography, 2018
5.2.3 Belviq
5.2.3.1 Belviq Drug Profile
5.2.3.2 Belviq Historical Sales
5.2.3.3 Belviq Forecast 2020-2030
5.2.3.4 Belviq Sales by Geography, 2018
5.2.4 Qysmia
5.2.4.1 Qysmia Drug Profile
5.2.4.2 Qysmia Historical Sales
5.2.4.3 Qysmia Forecast 2020-2030
5.2.4.4 Qysmia Sales by Geography, 2018
5.2.5 Xenical and Alli
5.2.5.1 Xenical and Alli Historical Sales
5.2.5.2 Xenical and Alli Sales by Geography, 2018
5.2.5.3 Xenical and Alli Forecast 2020-2030
5.2.6 Cametor/Oblean
5.2.7 Lomaira
5.3 Generics
5.3.1 Orlistat
5.3.1.1 Orlistat Historical Sales
5.3.2 Sibutramine
5.3.2.1 Sibutramine Historical Sales
5.3.3 Adipex
5.3.3.1 Adipex Historical Sales
5.3.4 Phentermine
5.3.4.1 Phentermine Historical Sales
6. Leading National Markets Forecast 2020-2030
6.1 Geographical Breakdown of Global Anti-obesity Drugs Market, 2019
6.1.1 Regional Breakdown of Global Anti-obesity Drugs Market, 2019
6.1.2 Country Breakdown of Global Anti-obesity Drugs Market, 2019
6.2 Regional Forecast of Global Anti-obesity Drugs Market, 2019-2030
6.3 US Anti-obesity Drugs Market
6.3.1 US Anti-obesity Drugs: Market Forecasts 2020-2030
6.4 Japan Anti-obesity Drugs Market
6.4.1 Japan Anti-obesity Drugs: Market Forecasts 2020-2030
6.5 EU5 Anti-obesity Drugs Market, 2019
6.5.1 EU5 Anti-obesity Drugs: Market Forecast 2020-2030
6.5.1.1 The UK Anti-obesity Drugs: Market Forecasts 2020-2030
6.5.1.2 Germany Anti-obesity Drugs: Market Forecasts 2020-2030
6.5.1.3 France Anti-obesity Drugs: Market Forecasts 2020-2030
6.5.1.4 Italy Anti-obesity Drugs: Market Forecasts 2020-2030
6.5.1.5 Spain Anti-obesity Drugs: Market Forecasts 2020-2030
6.6 BRIC Anti-obesity Drugs Market, 2019
6.6.1 BRIC Anti-obesity Drugs: Market Forecasts 2020-2030
6.6.1.1 China Anti-obesity Drugs: Market Forecasts 2020-2030
6.6.1.2 India Anti-obesity Drugs: Market Forecasts 2020-2030
6.6.1.3 Brazil Anti-obesity Drugs: Market Forecasts 2020-2030
6.6.1.4 Russia Anti-obesity Drugs: Market Forecasts 2020-2030
7. Research and Development for Treating Obesity
7.1 Novel Mechanism of Action of Pipeline Drugs
7.2 Active Pipeline Molecules
7.3 Promising Potential Pipeline Molecules
7.3.1 Phase III Molecules
7.3.1.1 BTI-320
7.3.2 Phase II Molecules
7.3.2.1 Oxyntolong
7.3.2.2 Antisense FGFR4 oligo, Verva
7.3.2.3 S-237648
7.3.2.4 Setmelanotide
7.3.2.5 Bupropion + zonisamide SR
7.3.2.6 Semaglutide
7.3.2.7 LIK066
7.3.2.8 Tesofensine
7.3.2.9 LIPO-202
7.3.2.10 Canagliflozin and Phentermine
7.3.2.11 OBEP-100
7.3.2.12 Efpeglenatide
7.3.2.13 EMP16
7.3.2.14 MEDI-0382
8. Pricing and Reimbursement Overview
8.1 US
8.2 EU
8.3 Payers Perspective
9. Qualitative Analysis of the Global Anti-obesity Drugs Market
9.1 SWOT Analysis, 2019
9.2 Market Trends in Weight Loss & Management Market
10. Leading Companies in Global Anti-obesity Drugs Market, 2019
10.1 Novo Nordisk
10.1.1 Obesity Care – To Establish its presence
10.2 Currax Pharmaceuticals LLC
10.2.1 Currax™ Pharmaceuticals LLC Announces the Acquisition of Nalpropion Pharmaceuticals, Inc.
10.3 Eisai Co., Ltd.
10.3.1 Collaboration Agreement with EUROFARMA
10.3.2 Collaboration Agreement with CY BIOTECH
10.4 F. Hoffmann-La Roche Ltd.
10.5 Vivus
10.5.1 Collaboration Agreement with Alvogen Malta Operations (ROW) Ltd
10.5.2 Collaboration Agreement with Other Companies
10.6 Teva
10.7 GlaxoSmithKline (GSK)
10.8 Pfizer Inc.
10.9 Rhythm Pharmaceuticals, Inc.
10.10 AstraZeneca
10.11 Saniona
10.12 Hanmi Pharmaceutical
10.13 SCOHIA PHARMA, Inc.
10.14 Sinil Pharmaceutical Co., Ltd
10.15 ERX Pharmaceuticals
10.16 CohBar, Inc.
10.17 Carmot Therapeutics, Inc.
10.18 LNC Therapeutics
10.19 Gelesis
11. Conclusions
Associated Visiongain Reports
Visiongain Report Sales Order Form
About Visiongain
Visiongain report evaluation form
List of Table
Table 2.1 WHO BMI Cut Off Points
Table 2.2 Classification of Overweight and Obesity by BMI, Waist Circumference, and Associated Disease Risk
Table 2.3 Prevalence of obesity among adults (both sexes 18+), BMI ≥ 30, age-standardized Estimates by WHO region
Table 2.4 Prevalence of obesity (Male 18+), BMI ≥ 30, age-standardized Estimates by WHO region
Table 2.5 Prevalence of obesity (Female 18+), BMI ≥ 30, age-standardized Estimates by WHO region
Table 2.6 Forecast of Obesity Prevalence in Major Markets (US, EU5, BRIC, and Japan), Both Sexes, aged >18 years, 2019-2030, million, CAGR% (2019-2030)
Table 3.1 Mechanism of Action of Innovator Drugs for the treatment of Obesity
Table 3.2 List of Innovator Drugs for the treatment of Obesity
Table 3.2 List of Prescription Drugs for the treatment of Obesity
Table 3.3 Long-term Prescription Drugs for the treatment of Obesity
Table 4.1 Global Anti-obesity Drugs Market by Markets: Revenue ($m), and Market Share (%), 2019
Table 4.2 Global Anti-obesity Drugs Market Forecast 2019-2030: Revenue ($m), AGR (%), CAGR (%)
Table 4.3 Global Anti-obesity Drugs Market Segmentation by Mechanism of Action 2019-2030: Revenue ($m), AGR (%), CAGR (%)
Table 4.4 Global Anti-obesity Drugs Market by Mechanism of Action 2020-2030: AGR (%)
Table 4.5 Global Anti-obesity Incretin mimetics/GLP-1 Agonist Drugs Market 2019-2030: Revenue ($m), AGR (%), CAGR (%)
Table 4.6 List of Active GLP-1 agonists in Clinical Pipeline
Table 4.7 Global Anti-obesity Lipase Inhibitor Drugs Market 2019-2030: Revenue ($m), AGR (%), CAGR (%)
Table 4.8 List of Active SNDRI agonists in Clinical Pipeline
Table 4.9 Global Anti-obesity Serotonin-norepinephrine-Dopamine Reuptake Inhibitor Drugs Market 2019-2030: Revenue ($m), AGR (%), CAGR (%)
Table 4.10 Global Anti-obesity Serotonin Receptor Agonist Drugs Market 2019-2030: Revenue ($m), AGR (%), CAGR (%)
Table 4.11 Global Anti-obesity Sympathomimetic-GABA Receptor Agonist Drugs Market 2019-2030: Revenue ($m), AGR (%), CAGR (%)
Table 4.12 Global Anti-obesity Sympathomimetic Drugs Market 2019-2030: Revenue ($m), AGR (%), CAGR (%)
Table 4.13 Global Anti-obesity Other Drugs Market 2019-2030: Revenue ($m), AGR (%), CAGR (%)
Table 4.14 Global Anti-obesity Drugs Market by Mechanism of Action 2020-2030: Market Share (%)
Table 4.15 Global Anti-obesity Drugs Market by Innovator Drugs and Generics 2019-2030: Revenue ($m), AGR (%), CAGR (%)
Table 4.16 Global Anti-obesity Drugs Market Segmentation by Innovator Drugs and Generics 2020-2030: AGR (%)
Table 4.17 Global Anti-obesity Innovator Drugs Market 2019-2030: Revenue ($m), AGR (%), CAGR (%)
Table 4.18 Global Anti-obesity Generic Drugs Market 2019-2030: Revenue ($m), AGR (%), CAGR (%)
Table 4.19 Global Anti-obesity Drugs Market by Innovator Drugs and Generics 2020-2030: Market Share (%)
Table 4.20 Global Anti-obesity Drugs Market by Prescription and OTC Drugs 2019-2030: Revenue ($m), AGR (%), CAGR (%)
Table 4.21 Global Anti-obesity Drugs Market by Prescription and OTC Drugs 2020-2030: AGR (%)
Table 4.22 Global Anti-obesity Prescription Drugs Market 2019-2030: Revenue ($m), AGR (%), CAGR (%)
Table 4.20 Global Anti-obesity Drugs Market by Prescription and OTC Drugs 2019-2030: Revenue ($m), AGR (%), CAGR (%)
Table 4.24 Global Anti-obesity Drugs Market by Prescription and OTC Drugs 2019-2030: Market Share (%)
Table 4.25 Global Anti-obesity Drugs Market by Duration of Therapy 2019-2030: Revenue ($m), AGR (%), CAGR (%)
Table 4.26 Global Anti-obesity Drugs Market by Duration of Therapy 2020-2030: AGR (%)
Table 4.27 Global Anti-obesity Short-term Drugs Market 2019-2030: Revenue ($m), AGR (%), CAGR (%)
Table 4.28 Global Anti-obesity Long-term Drugs Market 2019-2030: Revenue ($m), AGR (%), CAGR (%)
Table 4.29 Global Anti-obesity Drugs Market by Duration of Therapy 2019-2030: Market Share (%)
Table 5.1 Saxenda Drug Profile
Table 5.2 Saxenda Sales Forecast 2019-2030: Revenue ($m), AGR (%), CAGR (%)
Table 5.3 Contrave Drug Profile
Table 5.4 Contrave Sales Forecast 2019-2030: Revenue ($m), AGR (%), CAGR (%)
Table 5.5 Belviq Drug Profile
Table 5.6 Belviq Sales Forecast 2019-2030: Revenue ($m), AGR (%), CAGR (%)
Table 5.7 Qysmia Drug Profile
Table 5.8 Qysmia Sales Forecast 2019-2030: Revenue ($m), AGR (%), CAGR (%)
Table 5.9 Alli Sales Forecast 2019-2030: Revenue ($m), AGR (%), CAGR (%)
Table 6.1 Global Anti-obesity Drugs Market by Region: Revenue ($m), and Market Share (%), 2019
Table 6.2 Global Anti-obesity Drugs Market by Country: Revenue ($m), and Market Share (%), 2019
Table 6.3 Global Anti-obesity Drugs Market Forecast by Region: Revenue ($m), AGR (%), CAGR (%), 2019-2030
Table 6.4 Global Anti-obesity Drugs Market by Region: AGR 2020-2030 (%)
Table 6.5 Global Anti-obesity Drugs Market by Region: Market Share (%), 2019-2030
Table 6.6 US Anti-obesity Drugs Market Forecast 2019-2030: Revenue ($m), AGR (%), CAGR (%)
Table 6.7 U.S. Anti-obesity Drugs Market by Mechanism of Action 2019-2030: Revenue ($m), AGR (%), CAGR (%)
Table 6.8 U.S. Anti-obesity Drugs Market by Innovator Drugs and Generics 2019-2030: Revenue ($m), AGR (%), CAGR (%)
Table 6.9 US Anti-obesity Drugs Market by Prescription and OTC Drugs 2019-2030: Revenue ($m), AGR (%), CAGR (%)
Table 6.10 US Anti-obesity Drugs Market by Duration of Therapy 2019-2030: Revenue ($m), AGR (%), CAGR (%)
Table 6.11 Japan Anti-obesity Drugs Market Forecast 2019-2030: Revenue ($m), AGR (%), CAGR (%)
Table 6.12 Japan Anti-obesity Drugs Market by Mechanism of Action 2019-2030: Revenue ($m), AGR (%), CAGR (%)
Table 6.13 Japan Anti-obesity Drugs Market by Innovator Drugs and Generics 2019-2030: Revenue ($m), AGR (%), CAGR (%)
Table 6.14 Japan Anti-obesity Drugs Market by Prescription and OTC Drugs 2019-2030: Revenue ($m), AGR (%), CAGR (%)
Table 6.15 Japan Anti-obesity Drugs Market by Duration of Therapy 2019-2030: Revenue ($m), AGR (%), CAGR (%)
Table 6.16 EU5 Anti-obesity Drugs Market by Region: Market Size ($m) and Share (%), 2019
Table 6.17 EU5 Anti-obesity Drugs Market Forecast by Region: Revenue ($m), AGR (%), CAGR (%), 2019-2030
Table 6.18 EU5 Anti-obesity Drugs Market by Region: Market Share Forecast 2019-2030 (%)
Table 6.19 EU5 Anti-obesity Drugs Market Forecast by Region: AGR (%) 2019-2030
Table 6.20 UK Anti-obesity Drugs Market Forecast: Revenue ($m), AGR (%), CAGR (%), 2019-2030
Table 6.21 UK Anti-obesity Drugs Market by Mechanism of Action 2019-2030: Revenue ($m), AGR (%), CAGR (%)
Table 6.22 UK Anti-obesity Drugs Market by Innovator Drugs and Generics 2019-2030: Revenue ($m), AGR (%), CAGR (%)
Table 6.23 UK Anti-obesity Drugs Market by Prescription and OTC Drugs 2019-2030: Revenue ($m), AGR (%), CAGR (%)
Table 6.24 UK Anti-obesity Drugs Market by Duration of Therapy 2019-2030: Revenue ($m), AGR (%), CAGR (%)
Table 6.25 Germany Anti-obesity Drugs Market Forecast: Revenue ($m), AGR (%), CAGR (%), 2019-2030
Table 6.26 Germany Anti-obesity Drugs Market by Mechanism of Action 2019-2030: Revenue ($m), AGR (%), CAGR (%)
Table 6.27 Germany Anti-obesity Drugs Market by Innovator Drugs and Generics 2019-2030: Revenue ($m), AGR (%), CAGR (%)
Table 6.28 Germany Anti-obesity Drugs Market by Prescription and OTC Drugs 2019-2030: Revenue ($m), AGR (%), CAGR (%)
Table 6.29 Germany Anti-obesity Drugs Market by Duration of Therapy 2019-2030: Revenue ($m), AGR (%), CAGR (%)
Table 6.30 France Anti-obesity Drugs Market Forecast: Revenue ($m), AGR (%), CAGR (%), 2019-2030
Table 6.31 France Anti-obesity Drugs Market by Mechanism of Action 2019-2030: Revenue ($m), AGR (%), CAGR (%)
Table 6.32 France Anti-obesity Drugs Market by Innovator Drugs and Generics 2019-2030: Revenue ($m), AGR (%), CAGR (%)
Table 6.33 France Anti-obesity Drugs Market by Prescription and OTC Drugs 2019-2030: Revenue ($m), AGR (%), CAGR (%)
Table 6.34 France Anti-obesity Drugs Market by Duration of Therapy 2019-2030: Revenue ($m), AGR (%), CAGR (%)
Table 6.35 Italy Anti-obesity Drugs Market Forecast: Revenue ($m), AGR (%), CAGR (%), 2019-2030
Table 6.36 Italy Anti-obesity Drugs Market by Mechanism of Action 2019-2030: Revenue ($m), AGR (%), CAGR (%)
Table 6.37 Italy Anti-obesity Drugs Market by Innovator Drugs and Generics 2019-2030: Revenue ($m), AGR (%), CAGR (%)
Table 6.38 Italy Anti-obesity Drugs Market by Prescription and OTC Drugs 2019-2030: Revenue ($m), AGR (%), CAGR (%)
Table 6.39 Italy Anti-obesity Drugs Market by Duration of Therapy 2019-2030: Revenue ($m), AGR (%), CAGR (%)
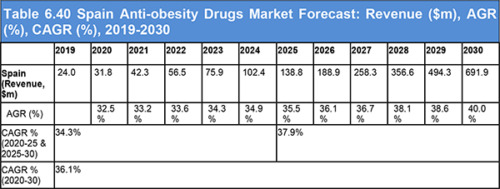
Table 6.40 Spain Anti-obesity Drugs Market Forecast: Revenue ($m), AGR (%), CAGR (%), 2019-2030
Table 6.41 Spain Anti-obesity Drugs Market by Mechanism of Action 2019-2030: Revenue ($m), AGR (%), CAGR (%)
Table 6.42 Spain Anti-obesity Drugs Market by Innovator Drugs and Generics 2019-2030: Revenue ($m), AGR (%), CAGR (%)
Table 6.43 Spain Anti-obesity Drugs Market by Prescription and OTC Drugs 2019-2030: Revenue ($m), AGR (%), CAGR (%)
Table 6.44 Spain Anti-obesity Drugs Market by Duration of Therapy 2019-2030: Revenue ($m), AGR (%), CAGR (%)
Table 6.45 Anti-obesity Drugs Market in the BRIC Region: Market Size ($m) & Share 2019 (%)
Table 6.46 BRIC Anti-obesity Drugs Market Forecast by Region: Revenue ($m), AGR (%), CAGR (%), 2019-2030
Table 6.47 China Anti-obesity Drugs Market Forecast: Revenue ($m), AGR (%), CAGR (%), 2019-2030
Table 6.48 China Anti-obesity Drugs Market by Mechanism of Action 2019-2030: Revenue ($m), AGR (%), CAGR (%)
Table 6.49 China Anti-obesity Drugs Market by Innovator Drugs and Generics 2019-2030: Revenue ($m), AGR (%), CAGR (%)
Table 6.50 China Anti-obesity Drugs Market by Prescription and OTC Drugs 2019-2030: Revenue ($m), AGR (%), CAGR (%)
Table 6.51 China Anti-obesity Drugs Market by Duration of Therapy 2019-2030: Revenue ($m), AGR (%), CAGR (%)
Table 6.52 India Anti-obesity Drugs Market Forecast by Region: Revenue ($m), AGR (%), CAGR (%), 2019-2030
Table 6.53 India Anti-obesity Drugs Market by Mechanism of Action 2019-2030: Revenue ($m), AGR (%), CAGR (%)
Table 6.54 India Anti-obesity Drugs Market by Innovator Drugs and Generics 2019-2030: Revenue ($m), AGR (%), CAGR (%)
Table 6.55 India Anti-obesity Drugs Market by Prescription and OTC Drugs 2019-2030: Revenue ($m), AGR (%), CAGR (%)
Table 6.56 India Anti-obesity Drugs Market by Duration of Therapy 2019-2030: Revenue ($m), AGR (%), CAGR (%)
Table 6.57 Brazil Anti-obesity Drugs Market Forecast: Revenue ($m), AGR (%), CAGR (%), 2019-2030
Table 6.58 Brazil Anti-obesity Drugs Market by Mechanism of Action 2019-2030: Revenue ($m), AGR (%), CAGR (%)
Table 6.59 Brazil Anti-obesity Drugs Market by Innovator Drugs and Generics 2019-2030: Revenue ($m), AGR (%), CAGR (%)
Table 6.60 Brazil Anti-obesity Drugs Market by Prescription and OTC Drugs 2019-2030: Revenue ($m), AGR (%), CAGR (%)
Table 6.61 Brazil Anti-obesity Drugs Market by Duration of Therapy 2019-2030: Revenue ($m), AGR (%), CAGR (%)
Table 6.62 Russia Anti-obesity Drugs Market Forecast: Revenue ($m), AGR (%), CAGR (%), 2019-2030
Table 6.63 Russia Anti-obesity Drugs Market by Mechanism of Action 2019-2030: Revenue ($m), AGR (%), CAGR (%)
Table 6.64 Russia Anti-obesity Drugs Market by Innovator Drugs and Generics 2019-2030: Revenue ($m), AGR (%), CAGR (%)
Table 6.65 Russia Anti-obesity Drugs Market by Prescription and OTC Drugs 2019-2030: Revenue ($m), AGR (%), CAGR (%)
Table 6.66 Russia Anti-obesity Drugs Market by Duration of Therapy 2019-2030: Revenue ($m), AGR (%), CAGR (%)
Table 7.1 Active Pipeline Molecules under Development for Treating Obesity
Table 9.1 The number of operations performed in all responding nations of the world
Table 9.2 Number of undernourished individuals worldwide, 2005–2017
Table 9.3 Prevalence of excess bodyweight in school-age children, 2010-2013
Table 9.4 Common Ingredients in Weight-Loss Dietary Supplements
Table 10.1: Innovator Drugs’ Originator-Licensee Information
Table 10.2 Novo Nordisk A/S: Overview
Table 10.3 Novo Nordisk: Patent Status for Marketed Products
Table 10.3 Novo Nordisk: Pipeline Overview (Obesity)
Table 10.4 Currax Pharmaceuticals LLC: Overview
Table 10.5 Eisai Co., Ltd.: Overview
Table 10.6 Roche: Overview
Table 10.7 Vivus: Overview
Table 10.8 Teva: Overview
Table 10.9 GSK: Overview
Table 10.10 Pfizer Inc.: Overview
Table 10.11 Rhythm Pharmaceuticals, Inc.: Overview
Table 10.12 Product Pipeline: Setmelanotide
Table 10.13 AstraZeneca: Overview
Table 10.14 Saniona: Overview
Table 10.15 Hanmi Pharmaceutical: Overview
Table 10.16 Hanmi Pharmaceutical: Pipeline
Table 10.17 SCOHIA PHARMA, Inc.: Overview
Table 10.18 SCOHIA PHARMA, Inc.: Pipeline
Table 10.19 Sinil Pharmaceutical Co., Ltd: Overview
Table 10.20 ERX Pharmaceuticals: Overview
Table 10.21 CohBar, Inc.: Overview
Table 10.22 Carmot Therapeutics, Inc.: Overview
Table 10.23 Carmot Therapeutics, Inc.: Pipeline
Table 10.24 LNC Therapeutics: Overview
Table 10.25 Gelesis: Overview
Table 10.26 Gelesis: Pipeline
List of Figure
Figure 2.1 Percentage of adults with obesity in the United States by State, 2018
Figure 2.2 Prevalence of Obesity in OECD 32 Countries – population aged 15 years and over, 2013 or nearest year
Figure 2.3 Prevalence of Obesity in G7 and BRIC Countries – population aged 15 years and over, 2012 or nearest year, men, women, both sexes
Figure 2.4 Age-Standardized Obesity Prevalence Rate in Major Markets – Population aged 15 years and over, 1972-2016
Figure 2.5 Deaths due to Obesity in G7 and BRIC Nation: Absolute Number (000’s), 2015
Figure 2.6 DALY’s due to Obesity in G7 and BRIC Nation: Absolute Number (million), 2015
Figure 2.7 YLD’s due to Obesity in G7 and BRIC Nation: Absolute Number (million), 2015
Figure 2.8 YLL’s due to Obesity in G7 and BRIC Nation: Absolute Number (000’s), 2015
Figure 4.1 Global Anti-obesity Drugs Market by Mechanism of Action: Market Share (%), 2019
Figure 4.2 Global Anti-obesity Drugs Market by Innovator Drugs and Generics: Market Share (%), 2019
Figure 4.3 Global Anti-obesity Drugs Market by Prescription and OTC Drugs: Market Share (%), 2019
Figure 4.4 Global Anti-obesity Drugs Market by Duration of Therapy: Market Share (%), 2019
Figure 4.5 Global Anti-obesity Drugs Market Forecast 2019-2030: Revenue ($m), AGR (%)
Figure 4.6 Global Anti-obesity Drugs Market by Mechanism of Action 2019, Revenue ($m)
Figure 4.7 Global Anti-obesity Drugs Market by Mechanism of Action: Market Share (%), 2019
Figure 4.8 Global Anti-obesity Drugs Market by Mechanism of Action 2019-2030: Revenue ($m), Global AGR (%)
Figure 4.9 Global Anti-obesity Drugs Market by Mechanism of Action 2020 and 2030: Revenue ($m), CAGR (%) 2020-2030
Figure 4.10 Global Anti-obesity Drugs Market by Mechanism of Action 2020-2030: AGR (%)
Figure 4.11 Global Anti-obesity Incretin mimetics/GLP-1 Agonist Drugs Market 2019-2030: Revenue ($m), AGR (%)
Figure 4.12 Global Anti-obesity Lipase Inhibitor Drugs Market 2019-2030: Revenue ($m), AGR (%)
Figure 4.13 Global Anti-obesity Serotonin-norepinephrine-Dopamine Reuptake Inhibitor Drugs Market 2019-2030: Revenue ($m), AGR (%)
Figure 4.14 Global Anti-obesity Serotonin Receptor Agonist Drugs Market 2019-2030: Revenue ($m), AGR (%)
Figure 4.15 Global Anti-obesity Sympathomimetic-GABA Receptor Agonist Drugs Market 2019-2030: Revenue ($m), AGR (%)
Figure 4.16 Global Anti-obesity Sympathomimetic Drugs Market 2019-2030: Revenue ($m), AGR (%)
Figure 4.17 Global Anti-obesity Other Drugs Market 2019-2030: Revenue ($m), AGR (%)
Figure 4.18 Global Anti-obesity Drugs Market by Mechanism of Action 2019-2030: Market Share (%)
Figure 4.19 Global Anti-obesity Drugs Market by Mechanism of Action: Market Share (%), 2025
Figure 4.20 Global Anti-obesity Drugs Market by Mechanism of Action: Market Share (%), 2030
Figure 4.21 Global Anti-obesity Drugs Market by Innovator Drugs and Generics: Revenue ($m), 2019
Figure 4.22 Global Anti-obesity Drugs Market by Innovator Drugs and Generics: Revenue ($m), 2019
Figure 4.23 Global Anti-obesity Drugs Market Segmentation by Innovator Drugs and Generics 2019-2030: Revenue ($m), Global AGR (%)
Figure 4.24 Global Anti-obesity Drugs Market Segmentation by Innovator Drugs and Generics: Revenue 2020 and 2030 ($m), CAGR 2020-2030 (%)
Figure 4.25 Global Anti-obesity Drugs Market by Innovator Drugs and Generics 2019-2030: AGR (%)
Figure 4.26 Global Anti-obesity Innovator Drugs Market 2019-2030: Revenue ($m), AGR (%)
Figure 4.27 Global Anti-obesity Generic Drugs Market 2019-2030: Revenue ($m), AGR (%)
Figure 4.28 Global Anti-obesity Drugs Market by Innovator Drugs and Generics 2019-2030: Market Share (%)
Figure 4.29 Global Anti-obesity Drugs Market by Innovator Drugs and Generics: Market Share (%), 2020
Figure 4.30 Global Anti-obesity Drugs Market by Innovator Drugs and Generics: Market Share (%), 2030
Figure 4.31 Global Anti-obesity Drugs Market by Prescription and OTC Drugs, Revenue 2019 ($m)
Figure 4.32 Global Anti-obesity Drugs Market by Prescription and OTC Drugs: Market Share (%), 2019
Figure 4.33 Global Anti-obesity Drugs Market by Prescription and OTC Drugs 2019-2030: Revenue ($m), Global AGR (%)
Figure 4.34 Global Anti-obesity Drugs Market by Prescription and OTC Drugs: Revenue 2020 and 2030 ($m), CAGR 2020-2030(%)
Figure 4.35 Global Anti-obesity Drugs Market by Prescription and OTC Drugs 2020-2030: AGR (%)
Figure 4.36 Global Anti-obesity Prescription Drugs Market 2019-2030: Revenue ($m), AGR (%)
Figure 4.37 Global Anti-obesity OTC Drugs Market 2019-2030: Revenue ($m), AGR (%)
Figure 4.38 Global Anti-obesity Drugs Market by Prescription and OTC Drugs 2019-2030: Market Share (%)
Figure 4.39 Global Anti-obesity Drugs Market by Prescription and OTC Drugs: Market Share (%), 2019
Figure 4.40 Global Anti-obesity Drugs Market by Prescription and OTC Drugs: Market Share (%), 2030
Figure 4.41 Global Anti-obesity Drugs Market by Duration of Therapy: Revenue ($m), 2019
Figure 4.42 Global Anti-obesity Drugs Market by Duration of Therapy: Market Share (%), 2019
Figure 4.43 Global Anti-obesity Drugs Market by Duration of Therapy 2019-2030: Revenue ($m), AGR (%)
Figure 4.44 Global Anti-obesity Drugs Market by Duration of Therapy: Revenue 2020 and 2030 ($m), CAGR 2020-2030 (%)
Figure 4.45 Global Anti-obesity Drugs Market by Duration of Therapy 2019-2030: AGR (%)
Figure 4.46 Global Anti-obesity Short-term Drugs Market 2019-2030: Revenue ($m), AGR (%)
Figure 4.47 Global Anti-obesity Long-term Drugs Market 2019-2030: Revenue ($m), AGR (%)
Figure 4.48 Global Anti-obesity Drugs Market by Duration of Therapy 2019-2030: Market Share (%)
Figure 4.49 Global Anti-obesity Drugs Market by Duration of Therapy: Market Share (%), 2019
Figure 4.50 Global Anti-obesity Drugs Market by Duration of Therapy: Market Share (%), 2030
Figure 4.51 Global Anti-obesity Drugs Market: Drivers and Restraints
Figure 4.52 Trends in Global Anti-obesity Drugs Market
Figure 5.1 Leading Anti-obesity Drug Sales, Revenue ($m), 2018
Figure 5.2 Leading Anti-obesity Drug Sales, Market Share (%), 2018
Figure 5.3 Anti-obesity Drugs Sales Forecast, Market Share (%), 2030
Figure 5.4 Leading Anti-obesity Drugs: Historical Revenue ($m), 2012-2018
Figure 5.5 Global Anti-obesity Innovator Drugs by Individual Drug: Market Share (%), 2018
Figure 5.6 Global Anti-obesity Innovator Drugs by Individual Drug: Market Share (%), 2030
Figure 5.7 Saxenda Global Sales: Revenue ($million), 2015-2018
Figure 5.8 Saxenda Sales Forecast 2019-2030: Revenue ($m), AGR (%)
Figure 5.9 Saxenda Sales Forecast 2019-2030: Revenue ($m), AGR (%)
Figure 5.10 Contrave Global Sales: Revenue ($million), 2014-2016
Figure 5.11 Contrave Sales Forecast 2019-2030: Revenue ($m), AGR (%)
Figure 5.12 Contrave Sales by Geography: Market Share (%), 2018
Figure 5.13 Belviq Global Sales: Revenue ($million), 2013-2018
Figure 5.14 Belviq Sales Forecast 2019-2030: Revenue ($million), AGR (%)
Figure 5.15 Belviq Sales by Geography: Market Share (%), 2018
Figure 5.16 Qysmia Global Sales: Revenue ($m), 2013-2018
Figure 5.17 Qysmia Sales Forecast 2019-2030: Revenue ($m), AGR (%)
Figure 5.18 Qysmia Sales by Geography: Market Share (%), 2018
Figure 5.19 Xenical Global Sales: Revenue ($million), 2013-2018
Figure 5.20 Alli Global Sales: Revenue ($million), 2013-2018
Figure 5.21 Xenical Sales by Geography: Market Share (%), 2018
Figure 5.22 Alli Sales by Geography: Market Share (%), 2018
Figure 5.23 Alli Sales Forecast 2019-2030: Revenue ($m), AGR (%)
Figure 5.24 Global Anti-obesity Generics Market by Individual Compound: Market Share (%), 2018
Figure 5.25 Orlistat Global Sales: Revenue ($m), 2013-2018
Figure 5.26 Sibutramine Global Sales: Revenue ($m), 2013-2018
Figure 5.27 Adipex Global Sales: Revenue ($m), 2013-2018
Figure 5.28 Phentermine Global Sales: Revenue ($m), 2013-2018
Figure 6.1 Global Anti-obesity Drugs Market Segmentation by Region/Country
Figure 6.2 Global Anti-obesity Drugs Market by Region: Revenue ($m), CAGR%, 2020, 2025 & 2030
Figure 6.3 Global Anti-obesity Drugs Market by Region: Market Share (%), 2020
Figure 6.4 Global Anti-obesity Drugs Market by Country: Revenue ($m), 2019
Figure 6.5 Global Anti-obesity Drugs Market by Country: Market Share (%), 2030
Figure 6.6 Global Anti-obesity Drugs Market Forecast by Region: Revenue ($m), Global AGR (%), 2019-2030
Figure 6.7 Global Anti-obesity Drugs Market Forecast by Region 2020, 2025, 2030: Revenue ($m), CAGR 2020-2030 (%)
Figure 6.8 Global Anti-obesity Drugs Market by Region: AGR 2020-2030 (%)
Figure 6.9 Global Anti-obesity Drugs Market by Region: Market Share (%), 2019-2030
Figure 6.10 Global Anti-obesity Drugs Market by Region: Market Share (%), 2020
Figure 6.11 Global Anti-obesity Drugs Market by Region: Market Share (%), 2025
Figure 6.12 Global Anti-obesity Drugs Market by Region: Market Share (%), 2030
Figure 6.13 US Anti-obesity Drugs Market by Mechanism of Action: Market Share %, 2019
Figure 6.14 US Anti-obesity Drugs Market Forecast 2019-2030: Revenue ($m), AGR (%)
Figure 6.15 Japan Anti-obesity Drugs Market Forecast 2019-2030: Revenue ($m), AGR (%)
Figure 6.16 EU5 Anti-obesity Drugs Market by Region: Global Market Share (%), 2019
Figure 6.17 EU5 Anti-obesity Drugs Market by Region: Market Share (%), 2019
Figure 6.18 EU5 Anti-obesity Drugs Market Forecast by Region 2019-2030: Revenue ($m), AGR (%)
Figure 6.19 EU5 Anti-obesity Drugs Market by Region 2020 and 2030: Revenue ($m), CAGR 2019-2030 (%)
Figure 6.20 EU5 Anti-obesity Drugs Market by Region: Market Share Forecast 2019-2030 (%)
Figure 6.23 EU5 Anti-obesity Drugs Market Forecast by Region: Market Share (%), 2030
Figure 6.25 UK Anti-obesity Drugs Market Forecast: Revenue ($m), AGR (%), 2019-2030
Figure 6.26 Germany Anti-obesity Drugs Market Forecast: Revenue ($m), AGR (%), 2019-2030
Figure 6.27 France Anti-obesity Drugs Market Forecast: Revenue ($m), AGR (%), 2019-2030
Figure 6.28 Italy Anti-obesity Drugs Market Forecast: Revenue ($m), AGR (%), 2019-2030
Figure 6.29 Spain Anti-obesity Drugs Market Forecast: Revenue ($m), AGR (%), 2019-2030
Figure 6.30 BRIC Anti-obesity Drugs Market by Region: Global Market Share 2019 (%)
Figure 6.31 BRIC Anti-obesity Drugs Market Forecast 2019-2030: Revenue ($m), AGR (%)
Figure 6.32 BRIC Anti-obesity Drugs Market Forecast 2020 and 2030: Revenue ($m), CAGR 2020-2030 (%)
Figure 6.33 BRIC Anti-obesity Drugs Market Forecast by Region: Global Market Share (%), 2030
Figure 6.34 BRIC Anti-obesity Drugs Market Forecast by Region: Market Share (%), 2020
Figure 6.35 BRIC Anti-obesity Drugs Market Forecast by Region: Market Share (%), 2030
Figure 6.36 China Anti-obesity Drugs Market Forecast: Revenue ($m), AGR (%), 2019-2030
Figure 6.37 India Anti-obesity Drugs Market Forecast: Revenue ($m), AGR (%), 2019-2030
Figure 6.38 Brazil Anti-obesity Drugs Market Forecast: Revenue ($m), AGR (%), 2019-2030
Figure 6.39 Russia Anti-obesity Drugs Market Forecast: Revenue ($m), AGR (%),2019-2030
Figure 7.1 Anti-obesity Clinical Pipeline Segmentation by Phase, 2019
Figure 7.2 Anti-obesity Pipeline Segmentation by Mechanism of Action, 2019
Figure 9.1 SWOT Analysis of the Global Anti-obesity Drugs Market
Figure 9.2 U.S. Bariatric Surgery, 2011-2017
Figure 9.3 Trends in percentage of procedures in USA/Canada from 2003, 2008, 2011, 2013
Figure 9.4 Trends in percentage of procedures in Europe from 2003, 2008, 2011, 2013
Figure 9.5 Trends in percentage of procedures in Latin/South America from 2003, 2008, 2011, 2013
Figure 9.6 Trends in percentage of procedures in Asia-Pacific from 2003, 2008, 2011, 2013
Figure 9.7 Prevalence and number of people with diabetes (Adults 18+ Years)
Figure 9.8 Risk of general diseases associated with obesity
Figure 10.1 Global Anti-obesity Drugs Market by Company 2018: Market Share (%)
Figure 10.2 Novo Nordisk’s 20-year R&D journey in Obesity - Milestones of Saxenda
Figure 11.1 Global Anti-obesity Drugs Market by Region: Share (%), 2019