Industries > Pharma > Global Anti-Obesity Drugs Market Forecast 2018-2028
Global Anti-Obesity Drugs Market Forecast 2018-2028
Mechanism of Action, Innovator Drugs, Generics. Prescription Drugs, OTC, Duration of Therapy, Incretin mimetics/GLP-1 agonists, SNDRIs, Lipase Inhibitors, Serotonin receptor agonists, Sympathomimetic-GABA receptor agonists, Sympathomimetics, Short-term Drugs, Long-term Drugs
The global anti-obesity drugs market was is valued at $1.3bn in 2017 and is expected to grow at a CAGR of 29.1% from 2017 to 2022. In 2017, the prescription drugs submarket held 96% of the global anti-obesity drugs market.
How this report will benefit you
Read on to discover how you can exploit the future business opportunities emerging in this sector.
In this brand new 250-page report you will receive 119 tables and 139 figures– all unavailable elsewhere.
The 250-page report provides clear detailed insight into the anti-obesity drugs market. Discover the key drivers and challenges affecting the market.
By ordering and reading our brand-new report today you stay better informed and ready to act.
Report Scope
• Global Anti-obesity Drugs Market forecast from 2018-2028
• Global Anti-obesity Drugs Market analysis and forecast from 2018-2028, by Mechanism of Action:
• Incretion mimetics/GLP-1 agonists
• SNDRIs
• Lipase Inhibitors
• Serotonin receptor agonists
• Sympathomimetic-GABA receptor agonists
• Sympathomimetics
• Global Anti-obesity Drugs Market analysis and forecast from 2018-2028, by Duration of Therapy:
• Long-term Drugs
• Short-term Drugs
• Global Anti-obesity Drugs Market analysis and forecast from 2018-2028, by Innovator vs Generic Drugs:
• Innovator
• Generic Drugs
• Global Anti-obesity Drugs Market analysis and forecast from 2018-2028, by Prescription vs OTC:
• Prescription Drugs
• OTC
• This report discusses and provides revenue forecasts from 2018-2028 for selected anti-obesity drugs:
• Saxenda
• Contrave/Mysimba
• Belviq
• Qysmia
• Xenical
• Alli
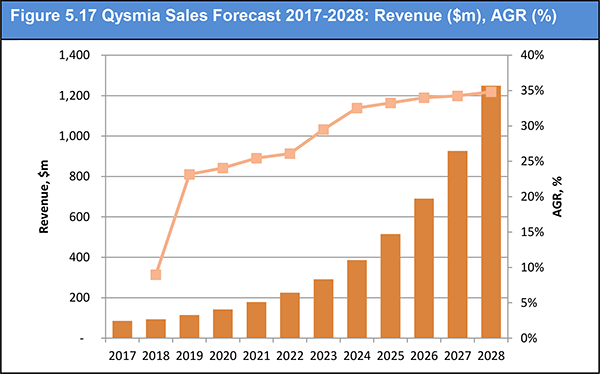
• This report provides individual revenue forecasts from 2018-2028 for these regional and national markets:
• US
• Japan
• EU5: Germany, France, Spain, Italy, UK
• BRIC: Brazil, Russia, China, India
• RoW
Each national market is further segmented by submarket: mechanism of action, duration of therapy, prescription vs OTC, innovator vs generic drugs
• Our study discusses the selected leading companies that are the major players in the anti-obesity drugs market:
• Eisai/Arena
• GlaxoSmithKline (GSK)
• Novo Nordisk
• Orexigen/Takeda
• Roche
• Teva
• Vivus
• This report discusses novel mechanism of action, active pipeline molecules and promising pipeline molecules.
• This report gives an overview of pricing and reimbursement in the US and EU.
• This report provides a SWOT Analysis of the global anti-obesity drugs market.
Visiongain’s study is intended for anyone requiring commercial analyses for the anti-obesity drugs market. You find data, trends and predictions.
Buy our report today Anti-obesity Drugs Market Analysis : Mechanism of Action, Innovator Drugs, Generics. Prescription Drugs, OTC, Duration of Therapy, Incretin mimetics/GLP-1 agonists, SNDRIs, Lipase Inhibitors, Serotonin receptor agonists, Sympathomimetic-GABA receptor agonists, Sympathomimetics, Short-term Drugs, Long-term Drugs
Visiongain is a trading partner with the US Federal Government
CCR Ref number: KD4R6
1. Report Overview
1.1 Why You Should Read This Report
1.2 How This Report Delivers
1.3 Key Questions Answered by This Analytical Report:
1.4 Who is This Report for?
1.5 Methodology
1.5.1 Primary Research
1.5.2 Secondary Research
1.5.3 Market Evaluation & Forecasting Methodology
1.6 Frequently Asked Questions
1.7 Associated Reports
1.8 About Visiongain
2. Introduction to Obesity
2.1 What is Obesity?
2.1.1 Types of obesity
2.1.1.1 Central Obesity / Android Type
2.1.1.2 Peripheral Obesity/ Gynoid Type
2.2 What are the causes and risk factors of obesity?
2.2.1 Energy Imbalance
2.2.2 Genetic Predisposition
2.2.3 Unhealthy Diet
2.2.4 Health Conditions and Medicines
2.2.5 Emotional Factors
2.2.6 Age
2.2.7 Pregnancy
2.2.8 Lack of Sleep
2.2.9 Smoking
2.3 Obesity Measurement
2.3.1 BMI
2.3.2 Waist circumference
2.3.3 Index of Central Obesity
2.3.4 Bioelectrical Impedance Analysis
2.3.5 New Approaches/Techniques
2.4 Epidemiology of Obesity
2.4.1 Epidemiology by Geography
2.4.2 Epidemiology by Country
2.4.3 Historical Prevalence in Major Markets
2.4.4 Forecast of Obesity Prevalence in Major Markets
2.5 Humanistic and Economic Burden
2.5.1 Mortality
2.5.2 Morbidity
2.5.2.1 Disability-adjusted life year (DALY)
2.5.2.2 Years Lost due to Disability (YLD)
2.5.2.3 Years of Life Lost (YLL)
2.5.3 Economic Impact
2.6 Obesity: Prevention and Treatment
2.6.1 Lifestyle changes
2.6.2 Pharmacotherapy
2.6.3 Other treatments
3. Introduction to the Global Anti-obesity Drugs Market
3.1 Market Structure
3.2 Market Definition and Scope
3.3 Classification by Mechanism of Action
3.3.1 Incretin Mimetics/GLP-1 Agonists
3.3.2 Lipase Inhibitors
3.3.3 Serotonin-norepinephrine-dopamine Reuptake (SNDRI) Inhibitors
3.3.4 Serotonin Receptor Agonists
3.3.5 Sympathomimetics
3.3.6 Sympathomimetic-GABA Receptor Agonists
3.3.7 Others
3.4 Classification by Innovator or Generics Drugs
3.4.1 Innovator Drugs
3.4.2 Generics Drugs
3.5 Classification by Prescription or OTC drugs
3.5.1 Prescription drugs
3.5.2 OTC drugs
3.6 Classification by Duration of Therapy
3.6.1 Short-term drugs
3.6.2 Long-term drugs
4. Global Anti-obesity Drugs Market 2018-2028
4.1 Global Anti-obesity Drugs Market 2017
4.2 Global Anti-obesity Drugs Market Forecast 2017-2028
4.3 Global Anti-obesity Drugs by Mechanism of Action
4.3.1 Global Anti-obesity Drugs by Mechanism of Action: Market Forecasts 2018-2028
4.3.1.1 Incretin mimetics/GLP-1 Agonists: Market Forecasts 2018-2028
4.3.1.2 Lipase Inhibitors: Market Forecasts 2018-2028
4.3.1.3 Serotonin-norepinephrine-dopamine Reuptake Inhibitors (SNDRI): Market Forecasts 2018-2028
4.3.2 Serotonin Receptor Agonists: Market Forecasts 2018-2028
4.3.2.1 Sympathomimetic-GABA Receptor Agonists: Market Forecasts 2018-2028
4.3.2.2 Sympathomimetics: Market Forecasts 2018-2028
4.3.2.3 Others: Market Forecasts 2018-2028
4.3.3 Global Anti-obesity Drugs Market Forecasts by Mechanism of Action: Market Share 2018-2028
4.4 Global Anti-obesity Drugs Market by Innovator and Generics Drugs
4.4.1 Global Anti-obesity Drugs by Innovator Drugs and Generics: Market Forecasts 2018-2028
4.4.1.1 Innovator Drugs: Market Forecasts 2018-2028
4.4.1.2 Generics: Market Forecasts 2018-2028
4.4.2 Global Anti-obesity Drugs Market Forecast by Innovator Drugs and Generics: Market Share 2018-2028
4.5 Global Anti-obesity Drugs Market by Prescription and OTC Drugs
4.5.1 Global Anti-obesity Drugs Market by Prescription and OTF Drugs: Market Forecast 2018-2028
4.5.1.1 Prescription Drugs: Market Forecasts 2018-2028
4.5.1.2 OTC Drugs: Market Forecasts 2018-2028
4.5.2 Global Anti-obesity Drugs Market Forecast by Prescription and OTC Drugs: Market Share 2018-2028
4.6 4.6 Global Anti-obesity Drugs Market by Duration of Therapy
4.6.1 Global Anti-obesity Drugs Market by Duration of Therapy: Market Forecast 2017-2028
4.6.1.1 Short-term Anti-obesity Drugs: Market Forecasts 2018-2028
4.6.1.2 Long-term Anti-obesity Drugs: Market Forecasts 2018-2028
4.6.2 Global Anti-obesity Drugs Market Forecast by Duration of Therapy: Market Share 2017-2028
4.7 Overall Global Anti-obesity Drugs Market Drivers, Restraints and Trends
5. Leading Anti-obesity Drugs
5.1 Snapshot of Anti-obesity Drugs
5.2 Innovator Drugs
5.2.1 Saxenda
5.2.1.1 Saxenda Drug Profile
5.2.1.2 Saxenda Historical Sales
5.2.1.3 Saxenda Forecast 2018-2028
5.2.1.4 Saxenda Sales by Geography, 2017
5.2.2 Contrave / Mysimba
5.2.2.1 Contrave Drug Profile
5.2.2.2 Contrave Historical Sales
5.2.2.3 Contrave Forecast 2018-2028
5.2.2.4 Contrave Sales by Geography, 2017
5.2.3 Belviq
5.2.3.1 Belviq Drug Profile
5.2.3.2 Belviq Historical Sales
5.2.3.3 Belviq Forecast 2018-2028
5.2.3.4 Belviq Sales by Geography, 2017
5.2.4 Qysmia
5.2.4.1 Qysmia Drug Profile
5.2.4.2 Qysmia Historical Sales
5.2.4.3 Qysmia Forecast 2018-2028
5.2.4.4 Qysmia Sales by Geography, 2017
5.2.5 Xenical and Alli
5.2.5.1 Xenical and Alli Historical Sales
5.2.5.2 Xenical and Alli Sales by Geography, 2017
5.2.5.3 Xenical and Alli Forecast 2018-2028
5.2.6 Cametor/Oblean
5.2.7 Lomaira
5.3 Generics
5.3.1 Orlistat
5.3.1.1 Orlistat Historical Sales
5.3.2 Sibutramine
5.3.2.1 Sibutramine Historical Sales
5.3.3 Adipex
5.3.3.1 Adipex Historical Sales
5.3.4 Phentermine
5.3.4.1 Phentermine Historical Sales
6. Leading National Markets Forecast 2018-2028
6.1 Geographical Breakdown of Global Anti-obesity Drugs Market, 2017
6.1.1 Regional Breakdown of Global Anti-obesity Drugs Market, 2017
6.1.2 Country Breakdown of Global Anti-obesity Drugs Market, 2017
6.2 Regional Forecast of Global Anti-obesity Drugs Market, 2018-2028
6.3 US Anti-obesity Drugs Market
6.3.1 US Anti-obesity Drugs: Market Forecasts 2018-2028
6.4 Japan Anti-obesity Drugs Market
6.4.1 Japan Anti-obesity Drugs: Market Forecasts 2018-2028
6.5 EU5 Anti-obesity Drugs Market, 2017
6.5.1 EU5 Anti-obesity Drugs: Market Forecast 2018-2028
6.5.1.1 The UK Anti-obesity Drugs: Market Forecasts 2018-2028
6.5.1.2 Germany Anti-obesity Drugs: Market Forecasts 2018-2028
6.5.1.3 France Anti-obesity Drugs: Market Forecasts 2018-2028
6.5.1.4 Italy Anti-obesity Drugs: Market Forecasts 2018-2028
6.5.1.5 Spain Anti-obesity Drugs: Market Forecasts 2018-2028
6.6 BRIC Anti-obesity Drugs Market, 2017
6.6.1 BRIC Anti-obesity Drugs: Market Forecasts 2018-2028
6.6.1.1 China Anti-obesity Drugs: Market Forecasts 2018-2028
6.6.1.2 India Anti-obesity Drugs: Market Forecasts 2018-2028
6.6.1.3 Brazil Anti-obesity Drugs: Market Forecasts 2018-2028
6.6.1.4 Russia Anti-obesity Drugs: Market Forecasts 2018-2028
7. Research and Development for Treating Obesity
7.1 Novel Mechanism of Action of Pipeline Drugs
7.2 Active Pipeline Molecules
7.3 Promising Potential Pipeline Molecules
7.3.1 Phase III Molecules
7.3.1.1 BTI-320
7.3.2 Phase II Molecules
7.3.2.1 Oxyntolong
7.3.2.2 Antisense FGFR4 oligo, Verva
7.3.2.3 S-237648
7.3.2.4 Setmelanotide
7.3.2.5 Bupropion + zonisamide SR
7.3.2.6 Semaglutide
7.3.2.7 LIK066
7.3.2.8 Tesofensine
7.3.2.9 LIPO-202
7.3.2.10 Canagliflozin and Phentermine
7.3.2.11 OBEP-100
7.3.2.12 Efpeglenatide
7.3.2.13 EMP16
7.3.2.14 MEDI-0382
8. Pricing and Reimbursement Overview
8.1 US
8.2 EU
8.3 Payers Perspective
9. Qualitative Analysis of the Global Anti-obesity Drugs Market
9.1 SWOT Analysis, 2017
10. Leading Companies in Global Anti-obesity Drugs Market, 2017
10.1 Novo Nordisk
10.1.1 Obesity Care – To Establish its presence
10.2 Orexigen/Takeda
10.2.1 Collaboration Agreement with Takeda Pharmaceutical Company Limited
10.2.2 Collaboration Agreement with Valeant
10.3 Arena/Eisai
10.3.1 Collaboration Agreement with Eisai Co., Ltd.
10.3.2 Collaboration Agreement with Other Companies
10.4 F. Hoffmann-La Roche Ltd.
10.5 Vivus
10.6 Teva
10.7 GlaxoSmithKline (GSK)
11. Conclusions
Associated visiongain Reports
Visiongain Report Sales Order Form
About Visiongain
Visiongain report evaluation form
List of Tables
Table 2.1: WHO BMI Cut Off Points
Table 2.2 Classification of Overweight and Obesity by BMI, Waist Circumference, and Associated Disease Risk
Table 3.1 Mechanism of Action of Innovator Drugs for the treatment of Obesity
Table 3.2 List of Innovator Drugs for the treatment of Obesity
Table 3.3 List of Prescription Drugs for the treatment of Obesity
Table 3.4 Long-term Prescription Drugs for the treatment of Obesity
Table 4.1 Global Anti-obesity Drugs Market by Markets: Revenue ($m), and Market Share (%), 2017
Table 4.2 Global Anti-obesity Drugs Market Forecast 2017-2028: Revenue ($m), AGR (%), CAGR (%)
Table 4.3 Global Anti-obesity Drugs Market Segmentation by Mechanism of Action 2017-2028: Revenue ($m), AGR (%), CAGR (%)
Table 4.4 Global Anti-obesity Drugs Market by Mechanism of Action 2017-2028: AGR (%)
Table 4.5 Global Anti-obesity Incretin mimetics/GLP-1 Agonist Drugs Market 2017-2028: Revenue ($m), AGR (%), CAGR (%)
Table 4.6 List of Active GLP-1 agonists in Clinical Pipeline
Table 4.7 Global Anti-obesity Lipase Inhibitor Drugs Market 2017-2028: Revenue ($m), AGR (%), CAGR (%)
Table 4.8 List of Active SNDRI agonists in Clinical Pipeline
Table 4.9 Global Anti-obesity Serotonin-norepinephrine-Dopamine Reuptake Inhibitor Drugs Market 2017-2028: Revenue ($m), AGR (%), CAGR (%)
Table 4.10 Global Anti-obesity Serotonin Receptor Agonist Drugs Market 2017-2028: Revenue ($m), AGR (%), CAGR (%)
Table 4.11 Global Anti-obesity Sympathomimetic-GABA Receptor Agonist Drugs Market 2017-2028: Revenue ($m), AGR (%), CAGR (%)
Table 4.12 Global Anti-obesity Sympathomimetic Drugs Market 2017-2028: Revenue ($m), AGR (%), CAGR (%)
Table 4.13 Global Anti-obesity Other Drugs Market 2017-2028: Revenue ($m), AGR (%), CAGR (%)
Table 4.14 Global Anti-obesity Drugs Market by Mechanism of Action 2017-2028: Market Share (%)
Table 4.15 Global Anti-obesity Drugs Market Segmentation by Innovator Drugs and Generics 2017-2028: Revenue ($m), AGR (%), CAGR (%)
Table 4.16 Global Anti-obesity Drugs Market Segmentation by Innovator Drugs and Generics 2017-2028: AGR (%)
Table 4.17 Global Anti-obesity Innovator Drugs Market 2017-2028: Revenue ($m), AGR (%), CAGR (%)
Table 4.18 Global Anti-obesity Generic Drugs Market 2017-2028: Revenue ($m), AGR (%), CAGR (%)
Table 4.19 Global Anti-obesity Drugs Market by Innovator Drugs and Generics 2017-2028: Market Share (%)
Table 4.20 Global Anti-obesity Drugs Market by Prescription and OTC Drugs 2017-2028: Revenue ($m), AGR (%), CAGR (%)
Table 4.21 Global Anti-obesity Drugs Market by Prescription and OTC Drugs 2017-2028: AGR (%)
Table 4.22 Global Anti-obesity Prescription Drugs Market 2017-2028: Revenue ($m), AGR (%), CAGR (%)
Table 4.23 Global Anti-obesity OTC Drugs Market 2017-2028: Revenue ($m), AGR (%), CAGR (%)
Table 4.24 Global Anti-obesity Drugs Market by Prescription and OTC Drugs 2017-2028: Market Share (%)
Table 4.25 Global Anti-obesity Drugs Market by Duration of Therapy 2017-2028: Revenue ($m), AGR (%), CAGR (%)
Table 4.26 Global Anti-obesity Drugs Market by Duration of Therapy 2017-2028: AGR (%)
Table 4.27 Global Anti-obesity Short-term Drugs Market 2017-2028: Revenue ($m), AGR (%), CAGR (%)
Table 4.28 Global Anti-obesity Long-term Drugs Market 2017-2028: Revenue ($m), AGR (%), CAGR (%)
Table 5.1 Saxenda Drug Profile
Table 5.2 Saxenda Sales Forecast 2017-2028: Revenue ($m), AGR (%), CAGR (%)
Table 5.3 Contrave Drug Profile
Table 5.4 Contrave Sales Forecast 2017-2028: Revenue ($m), AGR (%), CAGR (%)
Table 5.5 Belviq Drug Profile
Table 5.6 Belviq Sales Forecast 2017-2028: Revenue ($m), AGR (%), CAGR (%)
Table 5.7 Qysmia Drug Profile
Table 5.8 Qysmia Sales Forecast 2017-2028: Revenue ($m), AGR (%), CAGR (%)
Table 5.9 Alli Sales Forecast 2017-2028: Revenue ($m), AGR (%), CAGR (%)
Table 6.1 Global Anti-obesity Drugs Market by Region: Revenue ($m), and Market Share (%), 2017
Table 6.2 Global Anti-obesity Drugs Market by Country: Revenue ($m), and Market Share (%), 2017
Table 6.3 Global Anti-obesity Drugs Market Forecast by Region: Revenue ($m), AGR (%), CAGR (%), 2017-2028
Table 6.4 Global Anti-obesity Drugs Market by Region: AGR 2017-2028 (%)
Table 6.5 Global Anti-obesity Drugs Market by Region: Market Share (%), 2017-2028
Table 6.6 US Anti-obesity Drugs Market Forecast 2017-2028: Revenue ($m), AGR (%), CAGR (%)
Table 6.7 U.S. Anti-obesity Drugs Market by Mechanism of Action 2017-2028: Revenue ($m), AGR (%), CAGR (%)
Table 6.8 U.S. Anti-obesity Drugs Market by Innovator Drugs and Generics 2017-2028: Revenue ($m), AGR (%), CAGR (%)
Table 6.9 US Anti-obesity Drugs Market by Prescription and OTC Drugs 2017-2028: Revenue ($m), AGR (%), CAGR (%)
Table 6.10 US Anti-obesity Drugs Market by Duration of Therapy 2017-2028: Revenue ($m), AGR (%), CAGR (%)
Table 6.11 Japan Anti-obesity Drugs Market Forecast 2017-2028: Revenue ($m), AGR (%), CAGR (%)
Table 6.12 Japan Anti-obesity Drugs Market by Mechanism of Action 2017-2028: Revenue ($m), AGR (%), CAGR (%)
Table 6.13 Japan Anti-obesity Drugs Market by Innovator Drugs and Generics 2017-2028: Revenue ($m), AGR (%), CAGR (%)
Table 6.14 Japan Anti-obesity Drugs Market by Prescription and OTC Drugs 2017-2028: Revenue ($m), AGR (%), CAGR (%)
Table 6.15 Japan Anti-obesity Drugs Market by Duration of Therapy 2017-2028: Revenue ($m), AGR (%), CAGR (%)
Table 6.16 EU5 Anti-obesity Drugs Market by Region: Market Size ($m) and Share (%), 2017
Table 6.17 EU5 Anti-obesity Drugs Market Forecast by Region: Revenue ($m), AGR (%), CAGR (%), 2017-2028
Table 6.18 EU5 Anti-obesity Drugs Market by Region: Market Share Forecast 2017-2028 (%)
Table 6.19 EU5 Anti-obesity Drugs Market Forecast by Region: AGR (%) 2017-2028
Table 6.20 UK Anti-obesity Drugs Market Forecast: Revenue ($m), AGR (%), CAGR (%), 2017-2028
Table 6.21 UK Anti-obesity Drugs Market by Mechanism of Action 2017-2028: Revenue ($m), AGR (%), CAGR (%)
Table 6.22 UK Anti-obesity Drugs Market by Innovator Drugs and Generics 2017-2028: Revenue ($m), AGR (%), CAGR (%)
Table 6.23 UK Anti-obesity Drugs Market by Prescription and OTC Drugs 2017-2028: Revenue ($m), AGR (%), CAGR (%)
Table 6.24 UK Anti-obesity Drugs Market by Duration of Therapy 2017-2028: Revenue ($m), AGR (%), CAGR (%)
Table 6.25 Germany Anti-obesity Drugs Market Forecast: Revenue ($m), AGR (%), CAGR (%), 2017-2028
Table 6.26 Germany Anti-obesity Drugs Market by Mechanism of Action 2017-2028: Revenue ($m), AGR (%), CAGR (%)
Table 6.27 Germany Anti-obesity Drugs Market by Innovator Drugs and Generics 2017-2028: Revenue ($m), AGR (%), CAGR (%)
Table 6.28 Germany Anti-obesity Drugs Market by Prescription and OTC Drugs 2017-2028: Revenue ($m), AGR (%), CAGR (%)
Table 6.29 Germany Anti-obesity Drugs Market by Duration of Therapy 2017-2028: Revenue ($m), AGR (%), CAGR (%)
Table 6.30 France Anti-obesity Drugs Market Forecast: Revenue ($m), AGR (%), CAGR (%), 2017-2028
Table 6.31 France Anti-obesity Drugs Market by Mechanism of Action 2017-2028: Revenue ($m), AGR (%), CAGR (%)
Table 6.32 France Anti-obesity Drugs Market by Innovator Drugs and Generics 2017-2028: Revenue ($m), AGR (%), CAGR (%)
Table 6.33 France Anti-obesity Drugs Market by Prescription and OTC Drugs 2017-2028: Revenue ($m), AGR (%), CAGR (%)
Table 6.34 France Anti-obesity Drugs Market by Duration of Therapy 2017-2028: Revenue ($m), AGR (%), CAGR (%)
Table 6.35 Italy Anti-obesity Drugs Market Forecast: Revenue ($m), AGR (%), CAGR (%), 2017-2028
Table 6.36 Italy Anti-obesity Drugs Market by Mechanism of Action 2017-2028: Revenue ($m), AGR (%), CAGR (%)
Table 6.37 Italy Anti-obesity Drugs Market Innovator Drugs and Generics 2017-2028: Revenue ($m), AGR (%), CAGR (%)
Table 6.38 Italy Anti-obesity Drugs Market by Prescription and OTC Drugs 2017-2028: Revenue ($m), AGR (%), CAGR (%)
Table 6.39 Italy Anti-obesity Drugs Market by Duration of Therapy 2017-2028: Revenue ($m), AGR (%), CAGR (%)
Table 6.40 Spain Anti-obesity Drugs Market Forecast: Revenue ($m), AGR (%), CAGR (%), 2017-2028
Table 6.41 Spain Anti-obesity Drugs Market by Mechanism of Action 2017-2028: Revenue ($m), AGR (%), CAGR (%)
Table 6.42 Spain Anti-obesity Drugs Market by Innovator Drugs and Generics 2017-2028: Revenue ($m), AGR (%), CAGR (%)
Table 6.43 Spain Anti-obesity Drugs Market by Prescription and OTC Drugs 2017-2028: Revenue ($m), AGR (%), CAGR (%)
Table 6.44 Spain Anti-obesity Drugs Market by Duration of Therapy 2017-2028: Revenue ($m), AGR (%), CAGR (%)
Table 6.45 Anti-obesity Drugs Market in the BRIC Region: Market Size ($m) & Share 2017 (%)
Table 6.46 BRIC Anti-obesity Drugs Market Forecast by Region: Revenue ($m), AGR (%), CAGR (%), 2017-2028
Table 6.47 China Anti-obesity Drugs Market Forecast: Revenue ($m), AGR (%), CAGR (%), 2017-2028
Table 6.48 China Anti-obesity Drugs Market by Mechanism of Action 2017-2028: Revenue ($m), AGR (%), CAGR (%)
Table 6.49 China Anti-obesity Drugs Market by Innovator Drugs and Generics 2017-2028: Revenue ($m), AGR (%), CAGR (%)
Table 6.50 China Anti-obesity Drugs Market by Prescription and OTC Drugs 2017-2028: Revenue ($m), AGR (%), CAGR (%)
Table 6.51 China Anti-obesity Drugs Market by Duration of Therapy 2017-2028: Revenue ($m), AGR (%), CAGR (%)
Table 6.52 India Anti-obesity Drugs Market Forecast by Region: Revenue ($m), AGR (%), CAGR (%), 2017-2028
Table 6.53 India Anti-obesity Drugs Market by Mechanism of Action 2017-2028: Revenue ($m), AGR (%), CAGR (%)
Table 6.54 India Anti-obesity Drugs Market by Innovator Drugs and Generics 2017-2028: Revenue ($m), AGR (%), CAGR (%)
Table 6.55 India Anti-obesity Drugs Market by Prescription and OTC Drugs 2017-2028: Revenue ($m), AGR (%), CAGR (%)
Table 6.56 India Anti-obesity Drugs Market by Duration of Therapy 2017-2028: Revenue ($m), AGR (%), CAGR (%)
Table 6.57 Brazil Anti-obesity Drugs Market Forecast: Revenue ($m), AGR (%), CAGR (%), 2017-2028
Table 6.58 Brazil Anti-obesity Drugs Market by Mechanism of Action 2017-2028: Revenue ($m), AGR (%), CAGR (%)
Table 6.59 Brazil Anti-obesity Drugs Market by Innovator Drugs and Generics 2017-2028: Revenue ($m), AGR (%), CAGR (%)
Table 6.60 Brazil Anti-obesity Drugs Market by Prescription and OTC Drugs 2017-2028: Revenue ($m), AGR (%), CAGR (%)
Table 6.61 Brazil Anti-obesity Drugs Market by Duration of Therapy 2017-2028: Revenue ($m), AGR (%), CAGR (%)
Table 6.62 Russia Anti-obesity Drugs Market Forecast: Revenue ($m), AGR (%), CAGR (%), 2017-2028
Table 6.63 Russia Anti-obesity Drugs Market by Mechanism of Action 2017-2028: Revenue ($m), AGR (%), CAGR (%)
Table 6.64 Russia Anti-obesity Drugs Market by Innovator Drugs and Generics 2017-2028: Revenue ($m), AGR (%), CAGR (%)
Table 6.65 Russia Anti-obesity Drugs Market by Prescription and OTC Drugs 2017-2028: Revenue ($m), AGR (%), CAGR (%)
Table 6.66 Russia Anti-obesity Drugs Market by Duration of Therapy 2017-2028: Revenue ($m), AGR (%), CAGR (%)
Table 7.1 Active Pipeline Molecules under Development for Treating Obesity
Table 10.1: Innovator Drugs’ Originator-Licensee Information
Table 10.2 Novo Nordisk A/S: Overview
Table 10.3 Novo Nordisk: List of Active Clinical Pipeline Molecules
Table 10.4 Orexigen: Overview
Table 10.5 Arena: Overview
Table 10.6 Roche: Overview
Table 10.7 Vivus: Overview
Table 10.8 Teva: Overview
Table 10.9 Vivus: Overview
List of Figures
Figure 2.1 Prevalence of Obesity by WHO region, ages 18+, Both sexes, 2014
Figure 2.2 Prevalence of Overweight, ages 18+, 2010-2014, age standardized estimate: Both sexes 2014
Figure 2.3 Prevalence of Obesity, ages 18+, 2010-2014, age standardized estimate: Both sexes 2014
Figure 2.4 Prevalence of Obesity in OECD 32 Countries – population aged 15 years and over, 2013 or nearest year
Figure 2.5 Prevalence of Obesity in G7 and BRIC Countries – population aged 15 years and over, 2012 or nearest year, men, women, both sexes
Figure 2.6 Age-Standardized Obesity Prevalence Rate in Major Markets – Population aged 15 years and over, 1973-2012
Table 2.7 Forecast of Obesity Prevalence in Major Markets (US, EU5, BRIC, and Japan), Both Sexes, aged >18 years, 2017-2028, million, CAGR% (2017-2028)
Figure 2.8 Deaths due to Obesity in G7 and BRIC Nation: Absolute Number (000’s), 2015
Figure 2.9 DALY’s due to Obesity in G7 and BRIC Nation: Absolute Number (million), 2015
Figure 2.10 YLD’s due to Obesity in G7 and BRIC Nation: Absolute Number (million), 2015
Figure 2.11 YLL’s due to Obesity in G7 and BRIC Nation: Absolute Number (000’s), 2015
Figure 3.1 Global Anti-obesity Drugs Market Segmentation Overview
Figure 3.2 Anti-Obesity Drugs Classification by Mechanism of Action, 2017
Figure 4.1 Global Anti-obesity Drugs Market by Mechanism of Action: Market Share (%), 2017
Figure 4.2 Global Anti-obesity Drugs Market by Innovator Drugs and Generics: Market Share (%), 2017
Figure 4.3 Global Anti-obesity Drugs Market by Prescription and OTC Drugs: Market Share (%), 2017
Figure 4.4 Global Anti-obesity Drugs Market by Duration of Therapy: Market Share (%), 2017
Figure 4.5 Global Anti-obesity Drugs Market Forecast 2017-2028: Revenue ($m), AGR (%)
Figure 4.6 Global Anti-obesity Drugs Market by Mechanism of Action 2017, Revenue ($m)
Figure 4.7 Global Anti-obesity Drugs Market by Mechanism of Action: Market Share (%), 2017
Figure 4.8 Global Anti-obesity Drugs Market by Mechanism of Action 2017-2028: Revenue ($m), Global AGR (%)
Figure 4.9 Global Anti-obesity Drugs Market by Mechanism of Action 2017 and 2028: Revenue ($m), CAGR (%) 2017-2028
Figure 4.10 Global Anti-obesity Drugs Market by Mechanism of Action 2017-2028: AGR (%)
Figure 4.11 Global Anti-obesity Incretin mimetics/GLP-1 Agonist Drugs Market 2017-2028: Revenue ($m), AGR (%)
Figure 4.12 Global Anti-obesity Lipase Inhibitor Drugs Market 2017-2028: Revenue ($m), AGR (%)
Figure 4.13 Global Anti-obesity Serotonin-norepinephrine-Dopamine Reuptake Inhibitor Drugs Market 2017-2028: Revenue ($m), AGR (%)
Figure 4.14 Global Anti-obesity Serotonin Receptor Agonist Drugs Market 2017-2028: Revenue ($m), AGR (%)
Figure 4.15 Global Anti-obesity Sympathomimetic-GABA Receptor Agonist Drugs Market 2017-2028: Revenue ($m), AGR (%)
Figure 4.16 Global Anti-obesity Sympathomimetic Drugs Market 2017-2028: Revenue ($m), AGR (%)
Figure 4.17 Global Anti-obesity Other Drugs Market 2017-2028: Revenue ($m), AGR (%)
Figure 4.18 Global Anti-obesity Drugs Market Segmentation by Mechanism of Action 2017-2028: Market Share (%)
Figure 4.19 Global Anti-obesity Drugs Market by Mechanism of Action: Market Share (%), 2022
Figure 4.20 Global Anti-obesity Drugs Market by Mechanism of Action: Market Share (%), 2028
Figure 4.21 Global Anti-obesity Drugs Market by Innovator Drugs and Generics: Revenue ($m), 2017
Figure 4.22 Global Anti-obesity Drugs Market by Innovator Drugs and Generics: Market Share (%), 2017
Figure 4.23 Global Anti-obesity Drugs Market by Innovator Drugs and Generics 2017-2028: Revenue ($m), Global AGR (%)
Figure 4.24 Global Anti-obesity Drugs Market by Innovator Drugs and Generics: Revenue 2017 and 2028 ($m), CAGR 2017-2028 (%)
Figure 4.25 Global Anti-obesity Drugs Market by Mechanism of Action 2017-2028: AGR (%)
Figure 4.26 Global Anti-obesity Innovator Drugs Market 2017-2028: Revenue ($m), AGR (%)
Figure 4.27 Global Anti-obesity Generic Drugs Market 2017-2028: Revenue ($m), AGR (%)
Figure 4.28 Global Anti-obesity Drugs Market by Innovator Drugs and Generics 2017-2028: Market Share (%)
Figure 4.29 Global Anti-obesity Drugs Market by Innovator Drugs and Generics: Market Share (%), 2022
Figure 4.30 Global Anti-obesity Drugs Market by Innovator Drugs and Generics: Market Share (%), 2028
Figure 4.31 Global Anti-obesity Drugs Market by Prescription and OTC Drugs, Revenue 2017 ($m)
Figure 4.32 Global Anti-obesity Drugs Market by Prescription and OTC Drugs: Market Share (%), 2017
Figure 4.33 Global Anti-obesity Drugs Market by Prescription and OTC Drugs 2017-2028: Revenue ($m), Global AGR (%)
Figure 4.34 Global Anti-obesity Drugs Market by Prescription and OTC Drugs: Revenue 2017 and 2028 ($m), CAGR 2017-2028 (%)
Figure 4.35 Global Anti-obesity Drugs Market by Prescription and OTC Drugs 2017-2028: AGR (%)
Figure 4.36 Global Anti-obesity Prescription Drugs Market 2017-2028: Revenue ($m), AGR (%)
Figure 4.37 Global Anti-obesity OTC Drugs Market 2017-2028: Revenue ($m), AGR (%)
Figure 4.38 Global Anti-obesity Drugs Market by Prescription and OTC Drugs 2017-2028: Market Share (%)
Figure 4.39 Global Anti-obesity Drugs Market by Prescription and OTC Drugs: Market Share (%), 2017
Figure 4.40 Global Anti-obesity Drugs Market by Prescription and OTC Drugs: Market Share (%), 2028
Figure 4.41 Global Anti-obesity Drugs Market by Duration of Therapy: Revenue ($m), 2017
Figure 4.42 Global Anti-obesity Drugs Market by Duration of Therapy: Market Share (%), 2017
Figure 4.43 Global Anti-obesity Drugs Market by Duration of Therapy 2017-2028: Revenue ($m), AGR (%)
Figure 4.44 Global Anti-obesity Drugs Market by Duration of Therapy: Revenue 2017 and 2028 ($m), CAGR 2017-2028 (%)
Figure 4.45 Global Anti-obesity Drugs Market by Duration of Therapy 2017-2028: AGR (%)
Figure 4.46 Global Anti-obesity Short-term Drugs Market 2017-2028: Revenue ($m), AGR (%)
Figure 4.47 Global Anti-obesity Long-term Drugs Market 2017-2028: Revenue ($m), AGR (%)
Figure 4.48 Global Anti-obesity Drugs Market by Duration of Therapy 2017-2028: Market Share (%)
Figure 4.49 Global Anti-obesity Drugs Market by Duration of Therapy: Market Share (%), 2017
Figure 4.50 Global Anti-obesity Drugs Market by Duration of Therapy: Market Share (%), 2028
Figure 4.51 Global Anti-obesity Drugs Market: Drivers and Restraints
Figure 4.52 Trends in Global Anti-obesity Drugs Market
Figure 5.1 Leading Anti-obesity Drug Sales, Revenue ($m), 2017
Figure 5.2 Leading Anti-obesity Drug Sales, Market Share (%), 2017
Figure 5.3 Anti-obesity Drugs Sales Forecast, Market Share (%), 2028
Figure 5.4 Leading Anti-obesity Drugs: Historical Revenue ($m), 2012-2017
Figure 5.5 Global Anti-obesity Innovator Drugs by Individual Drug: Market Share (%), 2017
Figure 5.6 Global Anti-obesity Innovator Drugs by Individual Drug: Market Share (%), 2028
Figure 5.7 Saxenda Global Sales: Revenue ($million), 2015-2016
Figure 5.8 Saxenda Sales Forecast 2017-2028: Revenue ($m), AGR (%)
Figure 5.9 Saxenda Sales by Geography: Market Share (%), 2017
Figure 5.10 Contrave Global Sales: Revenue ($million), 2014-2016
Figure 5.11 Contrave Sales Forecast 2017-2028: Revenue ($m), AGR (%)
Figure 5.12 Contrave Sales by Geography: Market Share (%), 2017
Figure 5.13 Belviq Global Sales: Revenue ($million), 2013-2016
Figure 5.14 Belviq Sales Forecast 2017-2028: Revenue ($million), AGR (%)
Figure 5.15 Belviq Sales by Geography: Market Share (%), 2017
Figure 5.16 Qysmia Global Sales: Revenue ($m), 2013-2016
Figure 5.17 Qysmia Sales Forecast 2017-2028: Revenue ($m), AGR (%)
Figure 5.18 Qysmia Sales by Geography: Market Share (%), 2017
Figure 5.19 Xenical Global Sales: Revenue ($million), 2011-2016
Figure 5.20 Alli Global Sales: Revenue ($million), 2011-2016
Figure 5.21 Xenical Sales by Geography: Market Share (%), 2017
Figure 5.22 Alli Sales by Geography: Market Share (%), 2017
Figure 5.23 Alli Sales Forecast 2017-2028: Revenue ($m), AGR (%)
Figure 5.24 Global Anti-obesity Generics Market by Individual Compound: Market Share (%), 2017
Figure 5.25 Orlistat Global Sales: Revenue ($m), 2011-2016
Figure 5.26 Sibutramine Global Sales: Revenue ($m), 2012-2017
Figure 5.27 Adipex Global Sales: Revenue ($m), 2012-2017
Figure 5.28 Phentermine Global Sales: Revenue ($m), 2012-2017
Figure 6.1 Global Anti-obesity Drugs Market Segmentation by Region/Country
Figure 6.2 Global Anti-obesity Drugs Market by Region: Revenue ($m), 2017
Figure 6.3 Global Anti-obesity Drugs Market by Region: Market Share (%), 2017
Figure 6.4 Global Anti-obesity Drugs Market by Country: Revenue ($m), 2017
Figure 6.5 Global Anti-obesity Drugs Market by Country: Market Share (%), 2028
Figure 6.6 Global Anti-obesity Drugs Market Forecast by Region: Revenue ($m), Global AGR (%), 2017-2028
Figure 6.7 Global Anti-obesity Drugs Market Forecast by Region 2017, 2022, 2028: Revenue ($m), CAGR 2017-2028 (%)
Figure 6.8 Global Anti-obesity Drugs Market by Region: AGR 2017-2028 (%)
Figure 6.9 Global Anti-obesity Drugs Market by Region: Market Share (%), 2017-2028
Figure 6.10 Global Anti-obesity Drugs Market by Region: Market Share (%), 2017
Figure 6.11 Global Anti-obesity Drugs Market by Region: Market Share (%), 2022
Figure 6.12 Global Anti-obesity Drugs Market by Region: Market Share (%), 2028
Figure 6.13 US Anti-obesity Drugs Market by Mechanism of Action: Market Share %, 2017
Figure 6.14 US Anti-obesity Drugs Market Forecast 2017-2028: Revenue ($m), AGR (%)
Figure 6.15 Japan Anti-obesity Drugs Market Forecast 2017-2028: Revenue ($m), AGR (%)
Figure 6.16 EU5 Anti-obesity Drugs Market by Region: Global Market Share (%), 2017
Figure 6.17 EU5 Anti-obesity Drugs Market by Region: Market Share (%), 2017
Figure 6.18 EU5 Anti-obesity Drugs Market Forecast by Region 2017-2028: Revenue ($m), AGR (%)
Figure 6.19 EU5 Anti-obesity Drugs Market by Region 2017 and 2028: Revenue ($m), CAGR 2017-2028 (%)
Figure 6.20 EU5 Anti-obesity Drugs Market by Region: Market Share Forecast 2017-2028 (%)
Figure 6.21 EU5 Anti-obesity Drugs Market Forecast by Region: Global Market Share (%), 2028
Figure 6.22 EU5 Anti-obesity Drugs Market Forecast by Region: Market Share (%), 2023
Figure 6.23 EU5 Anti-obesity Drugs Market Forecast by Region: Market Share (%), 2028
Figure 6.24 EU5 Global Anti-obesity Drugs Market Forecast by Region: AGR (%), 2017-2028
Figure 6.25 UK Anti-obesity Drugs Market Forecast: Revenue ($m), AGR (%), 2017-2028
Figure 6.26 Germany Anti-obesity Drugs Market Forecast: Revenue ($m), AGR (%), 2017-2028
Figure 6.27 France Anti-obesity Drugs Market Forecast: Revenue ($m), AGR (%), 2017-2028
Figure 6.28 Italy Anti-obesity Drugs Market Forecast: Revenue ($m), AGR (%), 2017-2028
Figure 6.29 Spain Anti-obesity Drugs Market Forecast: Revenue ($m), AGR (%), 2017-2028
Figure 6.30 BRIC Anti-obesity Drugs Market by Region: Global Market Share 2017 (%)
Figure 6.31 BRIC Anti-obesity Drugs Market Forecast 2017-2028: Revenue ($m), AGR (%)
Figure 6.32 BRIC Anti-obesity Drugs Market Forecast 2017 and 2028: Revenue ($m), CAGR 2017-2028 (%)
Figure 6.33 BRIC Anti-obesity Drugs Market Forecast by Region: Global Market Share (%), 2028
Figure 6.34 BRIC Anti-obesity Drugs Market Forecast by Region: Market Share (%), 2017
Figure 6.35 BRIC Anti-obesity Drugs Market Forecast by Region: Market Share (%), 2028
Figure 6.36 China Anti-obesity Drugs Market Forecast: Revenue ($m), AGR (%), 2017-2028
Figure 6.37 India Anti-obesity Drugs Market Forecast: Revenue ($m), AGR (%),2017-2028
Figure 6.38 Brazil Anti-obesity Drugs Market Forecast: Revenue ($m), AGR (%),2017-2028
Figure 6.39 Russia Anti-obesity Drugs Market Forecast: Revenue ($m), AGR (%),2017-2028
Figure 7.1 Anti-obesity Clinical Pipeline Segmentation by Phase, 2017
Figure 7.2 Anti-obesity Pipeline Segmentation by Mechanism of Action, 2017
Figure 9.1 SWOT Analysis of the Global Anti-obesity Drugs Market
Figure 10.1 Global Anti-obesity Drugs Market by Company: Revenue ($m)
Figure 10.2 Global Anti-obesity Drugs Market by Company 2017: Market Share (%)
Figure 10.3 Novo Nordisk’s 20-year R&D journey in Obesity - Milestones of Saxenda
Figure 11.1 Global Anti-obesity Drugs Market by Region: Share (%), 2017 and 2028
ADial Pharmaceuticals
AEMPS
AIFA
HAS
Akrimax Pharmaceuticals
American Medical Association
Arena Pharmaceuticals
AstraZeneca
Biophytis
Boehringer Ingelheim
Boston Therapeutics
Diasome
Eisai
EMEA
Empros Pharma
FDA
G-BA
GenePreDiT
GlaxoSmithKline (GSK)
Hanmi
Ildong Pharmaceuticals
Intarcia Therapeutics
Ionis Pharmaceuticals
Janssen Pharmaceuticals
KT&G Life Sciences
KVK Tech
Kwang Dong
Medivation
Medlab Clinical
Neothetics
NGM Biopharmaceuticals
NICE
SMC
Novartis
Novo Nordisk
OPKO Health
Orexigen
Rhythm Pharmaceuticals
Roche
Saniona
Shionogi & Co., Ltd
Takeda
Teva
Valeant Pharmaceuticals
Virtici
Vivus
World Health Organization (WHO)
Xenetic Biosciences
Zafgen
Download sample pages
Complete the form below to download your free sample pages for Global Anti-Obesity Drugs Market Forecast 2018-2028
Related reports
-

Global Human Microbiome Therapeutics Market Forecast 2019-2029
The global human microbiome therapeutics market is estimated to grow at a CAGR of 60.2% in the first half of...
Full DetailsPublished: 24 April 2019 -
Generic Drugs Market Forecast 2019-2029
The generic drugs market is estimated to have reached $257.3bn in 2018 and is expected to grow at a CAGR...
Full DetailsPublished: 14 June 2019 -

Global Antibacterial Drugs Market 2019-2029
The global antibacterial drugs market is estimated to have reach $43bn in 2018 and is expected to grow at a...
Full DetailsPublished: 25 April 2019 -

Global Diabetes Drugs Market 2017-2027
The global diabetes drugs market was valued at $49.26bn in 2016 and is projected to grow at a CAGR of...Full DetailsPublished: 27 July 2017 -

Global Antidepressant and Anti-Anxiety Drugs Market 2019-2029
The global antidepressant and Anti-anxiety drugs market is estimated to have reached $12.16bn in 2018. In 2018, the SSRIs segment...
Full DetailsPublished: 29 March 2019 -

Global Probiotics Market Forecast 2018-2028
The global probiotics market reached $43bn in 2017 and is estimated to reach $59bn by 2022. In 2017, the bacterial...
Full DetailsPublished: 29 October 2018 -

Top 25 Dermatological Drugs Manufacturers 2019
Dermatological drugs market has been growing over the last decade. A combination of significant new market launches, and corporate activities...
Full DetailsPublished: 15 April 2019 -

Global Inflammatory Bowel Diseases (IBD) Drug Market Forecast 2018-2028
The global inflammatory bowel diseases (IBD) drug market is estimated at $6.7bn in 2017 and $7.6bn in 2023. Biologic therapies...
Full DetailsPublished: 29 May 2018 -
Dermatological Drugs Market Forecast 2018-2028
The revenue of the dermatological drugs market in 2017 is estimated at $26.07bn and is expected to grow at a...
Full DetailsPublished: 14 August 2018 -
Generic Drugs Market Forecast 2018-2028
The generic drugs market is estimated at $257.3bn in 2017 and is expected to grow at a CAGR of 7.9%...
Full DetailsPublished: 25 April 2018
Download sample pages
Complete the form below to download your free sample pages for Global Anti-Obesity Drugs Market Forecast 2018-2028
Do you have any custom requirements we can help you with?
Any specific country, geo region, market segment or specific company information?
Email us today, we can discuss your needs and see how we can help: jamie.roberts@visiongain.com
Would you like a free report overview of the report of your choice?
If so, please drop an email to Jamie Roberts stating your chosen report title to jamie.roberts@visiongain.com
Visiongain’s reports are based on comprehensive primary and secondary research. Those studies provide global market forecasts (sales by drug and class, with sub-markets and leading nations covered) and analyses of market drivers and restraints (including SWOT analysis) and current pipeline developments. To find out more about our reports methodology, please email jamie.roberts@visiongain.com
“Thank you for this Gene Therapy R&D Market report and for how easy the process was. Your colleague was very helpful and the report is just right for my purpose. This is the 2nd good report from Visiongain and a good price.”
Dr Luz Chapa Azuella, Mexico
American Association of Colleges of Pharmacy
American College of Clinical Pharmacy
American Pharmacists Association
American Society for Pharmacy Law
American Society of Consultant Pharmacists
American Society of Health-System Pharmacists
Association of Special Pharmaceutical Manufacturers
Australian College of Pharmacy
Biotechnology Industry Organization
Canadian Pharmacists Association
Canadian Society of Hospital Pharmacists
Chinese Pharmaceutical Association
College of Psychiatric and Neurologic Pharmacists
Danish Association of Pharmaconomists
European Association of Employed Community Pharmacists in Europe
European Medicines Agency
Federal Drugs Agency
General Medical Council
Head of Medicines Agency
International Federation of Pharmaceutical Manufacturers & Associations
International Pharmaceutical Federation
International Pharmaceutical Students’ Federation
Medicines and Healthcare Products Regulatory Agency
National Pharmacy Association
Norwegian Pharmacy Association
Ontario Pharmacists Association
Pakistan Pharmacists Association
Pharmaceutical Association of Mauritius
Pharmaceutical Group of the European Union
Pharmaceutical Society of Australia
Pharmaceutical Society of Ireland
Pharmaceutical Society Of New Zealand
Pharmaceutical Society of Northern Ireland
Professional Compounding Centers of America
Royal Pharmaceutical Society
The American Association of Pharmaceutical Scientists
The BioIndustry Association
The Controlled Release Society
The European Federation of Pharmaceutical Industries and Associations
The European Personalised Medicine Association
The Institute of Clinical Research
The International Society for Pharmaceutical Engineering
The Pharmaceutical Association of Israel
The Pharmaceutical Research and Manufacturers of America
The Pharmacy Guild of Australia
The Society of Hospital Pharmacists of Australia
Latest Pharma news
Visiongain Publishes Drug Delivery Technologies Market Report 2024-2034
The global Drug Delivery Technologies market is estimated at US$1,729.6 billion in 2024 and is projected to grow at a CAGR of 5.5% during the forecast period 2024-2034.
23 April 2024
Visiongain Publishes Cell Therapy Technologies Market Report 2024-2034
The cell therapy technologies market is estimated at US$7,041.3 million in 2024 and is projected to grow at a CAGR of 10.7% during the forecast period 2024-2034.
18 April 2024
Visiongain Publishes Automation in Biopharma Industry Market Report 2024-2034
The global Automation in Biopharma Industry market is estimated at US$1,954.3 million in 2024 and is projected to grow at a CAGR of 7% during the forecast period 2024-2034.
17 April 2024
Visiongain Publishes Anti-obesity Drugs Market Report 2024-2034
The global Anti-obesity Drugs market is estimated at US$11,540.2 million in 2024 and is expected to register a CAGR of 21.2% from 2024 to 2034.
12 April 2024
