This latest report by business intelligence provider Visiongain assesses that Floating Power Plant Market spending will reach USD 1.2 billion in 2020 to USD 4.10 billion by 2030, at a CAGR of 10.7% from 2020 to 2030. The floating power plant combines marine technology with the production of electricity. It offers power generation that is flexible and decentralized. Floating power stations eliminate the need for infrastructure and pre-feasibility studies, as required for onshore power stations. Floating power plants provide certain advantages such as fast electricity supply to areas with limited infrastructure, they can be relocated to areas where electricity is needed, these power plants require less space compared to land-based power plants, and secure power supply in the event of earthquakes and floods. Islands that are power deprived and are unable to build power plants can use floating power plants as a method of supply. It is possible to use existing cargo ship or ship as a floating power plant to eliminate the need for investment in new ones.
The floating power plants are essentially a replica of the traditional land-based gas turbine power generation concept.
It is predicted that floating power plants will be able to satisfy the rise in energy supply in a smaller moment relative to land-based power plants. The floating power plants are essentially a replica of the traditional concept of generating power from land-based gas turbines. Barge structures that are designed to support and allow the flow of forces in the barges hull support the turbine structures and foundations. This does not exaggerate the components. The barge’s hull girder provides differential weight and thermal gradient distribution. The turbine is thus isolated from the barge structure’s influences. Thus, the turbine is isolated from the influences of the barge structure. This reduces the chance of mechanical damage to the barge structure.
It is therefore critical that you have your timescales correct and your forecasting plans ready. This report will ensure that you do. Visiongain’s report will ensure that you keep informed and ahead of your competitors. Gain that competitive advantage.
Floating power plants can economically supply electricity to a district or to a facility
Floating power plants can provide electricity from a land-based origin to a district or plant that utilizes electricity economically. They can also minimize economic regulatory constraints. In addition, they also work as a cause of emergency power. Floating power plant design is the amalgamation of marine power generation engineering protocols. They are restricted in their motion, however, and can only move along the vertical axis; it is not possible to rotate. One of the key advantages of the floating power plants is that they can be supplied with dual cooling alternatives such as seawater and roof-top radiators. Moreover, they are mobile, versatile, and adaptable that put low risk on the operation and power generation costs to the provider.
It is expected that the global floating power plant market will grow from an estimated USD 1.2 billion in 2020 to USD 4.10 billion by 2030, at a CAGR of 10.7% from 2020 to 2030. The factors driving the floating power plant market include increasing power demand, coupled with the lack of power infrastructure, benefits over land-based power plants (mainly as it eliminates land-based issues), and energy efficiency mandates and clean energy demand (renewable energy source).
The renewable power source segment is estimated to be the fastest growing segment.
According to the assessment by Visiongain, the non-renewable power sector maintains a significant proportion, largely owing to the absence of power infrastructure, combined with the rise in supply for energy. Due to increasing demand for energy efficiency mandates and demand for clean energy (renewable energy source), the renewable energy source segment is estimated to be the fastest growing segment. Because of its advantages over land-based power crops and offshore wind turbines, floating storage and wind have seen an increase in facilities. The flying origin of solar energy is made up of main parts like solar panels and flying buildings.
Floating power plants Key Industry Developments
NTPC announced in March 2019 that its 1MW grid-connected hovering solar power plant in Gujrat will be near closure. For the last 6 months, the work for this power plant has been going on. As announced by Debashish Das, who is NTPC Director, this power plant will be commissioned in April 2019.
Thailand’s Electricity Generating Authority announced proposals for the construction of flying power installations across 8 dams in February 2019. The Siam cement company intends to build the first 45MW solar farm agreement at the Sirindhron Dam in Thailand.
In April 2019, Greenam Energy a wholly owned subsidiary of Singapore based AM International Holdings has set up its first floating solar power plant at Tutricon. The plant has a capacity of 24MW. It has been built to optimize the energy production in industrial plants as said by the company.
Read on to discover how you can exploit the future business opportunities emerging in this sector. Visiongain’s new study tells you and tells you NOW. The 215-pages report provides clear, detailed insight into the global Floating Power Plant market. Discover the key drivers and challenges affecting the market.
By ordering and reading our brand-new report today, you stay better informed and ready to act.
Report Scope
The report delivers considerable added value by revealing:
78 tables, charts and graphs are analyzing and revealing the growth prospects and outlook for the Floating Power Plant market.
Global Floating Power Plant market forecasts and analysis from 2020-2030.
Floating Power Plant market provides revenue estimates, forecasts and analysis from 2020-2030 for Floating Power Plant submarkets:
Forecasts and analysis of Floating Power Plant market by Power Source between 2020-2030
Non-renewable Market, 2020-2030
Gas Turbines Market, 2020-2030
IC Engines Market, 2020-2030
Renewable Market, 2020-2030
Solar Panels Market, 2020-2030
Floating Structures Market, 2020-2030
Wind Market, 2020-2030
Wind Turbines Market, 2020-2030
Sub-Structures Market, 2020-2030
Forecasts and analysis of Floating Power Plant market by Capacity between 2020-2030
1 MW–5 MW Market, 2020-2030
5.1 MW–20 MW Market, 2020-2030
20.1 MW–100 MW Market, 2020-2030
100.1 MW–250 MW Market, 2020-2030
Above 250 MW Market, 2020-2030
Regional Floating Power Plant market forecasts from 2020-2030 with drivers and restraints for the countries including:
Geographic Breakdown
Focused regional forecasts and analysis explore the future opportunities:
North America Market, 2020-2030
US Market, 2020-2030
Canada Market, 2020-2030
Europe Market, 2020-2030
The UK Market, 2020-2030
Germany Market, 2020-2030
France Market, 2020-2030
Italy Market, 2020-2030
Spain Market, 2020-2030
Rest of Europe Market, 2020-2030
Asia-Pacific Market, 2020-2030
China Market, 2020-2030
India Market, 2020-2030
Japan Market, 2020-2030
Australia & New Zealand Market, 2020-2030
Rest of Asia-Pacific Market, 2020-2030
LAMEA Market, 2020-2030
Latin America Market, 2020-2030
Middle East Market, 2020-2030
Africa Market, 2020-2030

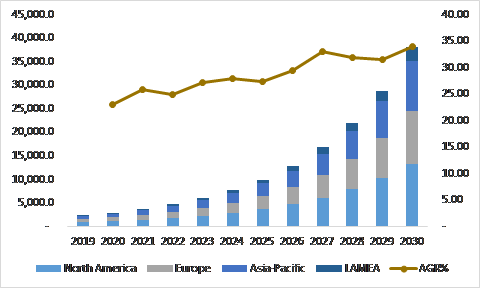
Figure:- Floating Power Plant Market Size and Forecast by Region, 2020-2030
Company profiles for the leading Floating Power Plant companies
Company Profiles of Leading Players
Caterpillar Inc
Ciel & Terre International
Floating Power Plant A/S
MAN Diesel & Turbo SE
Mitsubishi Corporation
Wartsila General Electric Company
Siemens AG
Ideol
Kyocera Corporation
Principle Power Inc
Upsolar
Other Key Players in the market
Vikram Solar Pvt. Ltd.
Yingli Solar
SeaTwirl
Ciel and Terre International
Vikram Solar Pvt., Ltd.
Principle Power
General Electric Company
Siemens AG
Wartsila
Man Diesel and Turbo Se
Caterpillar, Inc.
Ideol
Seatwirl AB
Upsolar
Yingli Solar
Orsted
NextEra Energy Resources
EDF renewables
EDP Renovaveis
Eolica Brasil
Floating Power Plant A/S
Conclusions and recommendations which will aid decision-making
How will you benefit from this report?
Keep your knowledge base up to speed. Don’t get left behind
Reinforce your strategic decision-making with definitive and reliable market data
Learn how to exploit new technological trends
Realise your company’s full potential within the market
Understand the competitive landscape and identify potential new business opportunities & partnerships
Who should read this report?
Anyone with involvement in the Floating Power Plant
Energy operators
Engineering contractors
Investment managers
Arbitrage companies and divisions
Energy price reporting companies
Energy company managers
Energy consultants
Energy company executives and analysts
Heads of strategic development
Business development managers
Marketing managers
Market analysts,
Technologists
Suppliers
Investors
Banks
Government agencies
Visiongain’s study is intended for anyone requiring commercial analyses for the Floating Power Plant market and leading companies. You find data, trends and predictions.
Buy our report today the Floating Power Plant Market Forecast 2020-2030. Avoid missing out by staying informed – get our report now.
Visiongain is a trading partner with the US Federal Government
CCR Ref number: KD4R6
Do you have any custom requirements we can help you with? Any need for specific country, geo region, market segment or specific company information? Contact us today, we can discuss your needs and see how we can help sara.peerun@visiongain.com
Report Overview
1.1 Global Floating Power Plant Market
1.2 Global Floating Power Plant Market Overview
1.3 Global Floating Power Plant Market Segmentation
1.4 The Emergence of Floating Power Plant in the Industry
1.5 Why You Should Read This Report
1.6 How This Report Delivers
1.7 Key Questions Answered by This Analytical Report
1.8 Methodology
1.8.1 Secondary Research
1.8.2 Market Evaluation & Forecasting Methodology
1.9 Frequently Asked Questions (FAQ)
1.10 Associated Visiongain Reports
1.11 About Visiongain
2. Introduction to Floating Power Plant Market
2.1 Market Definition
2.2 Industry Outlook
2.3 Value Chain Analysis
2.4 Industry Structure
2.5 Current Status & Trends
2.6 Demand & Supply Analysis
2.7 Trade Analysis
2.8 Price Trend Analysis
3. Global Floating Power Plant Market Analysis
3.1 PEST Analysis of the Floating Power Plant Market
3.2 Expert Opinion
3.2.1 Primary Correspondents
3.3 Market Outlook
3.4 Drivers & Restraints
3.5 Dominant Region/Country
3.6 Market Scenario
3.7 Overall Growth Rate, Globally
3.8 SWOT Analysis of the Floating Power Plant Market
3.8.1 Strengths
3.8.2 Weaknesses
3.8.3 Opportunities
3.8.4 Threats
3.9 Porter’s Five Forces Analysis
3.9.1 Competitive Rivalry
3.9.2 Supplier Power
3.9.3 Buyer Power
3.9.4 Threat of Substitute
3..9.5 Threat of New Entrant
4. Floating Power Plant: Global Market Analysis by Segments
4.1 Global Floating Power Plant Market Forecast, by Power Source 2020-2030
4.1.1 Power Source Overview
4.1.2 Non-renewable Market, 2020-2030
4.1.2.1 Gas Turbines Market, 2020-2030
4.1.2.2 IC Engines Market, 2020-2030
4.1.3 Renewable Market, 2020-2030
4.1.3.1 Solar Panels Market, 2020-2030
4.1.3.2 Floating Structures Market, 2020-2030
4.1.5 Wind Market, 2020-2030
4.1.5.1 Wind Turbines Market, 2020-2030
4.1.5.2 Sub-Structures Market, 2020-2030
4.2 Global Floating Power Plant Market Forecast, by Capacity 2020-2030
4.2.1 Capacity Overview
4.2.2 1 MW–5 MW Market, 2020-2030
4.2.3 5.1 MW–20 MW Market, 2020-2030
4.2.4 20.1 MW–100 MW Market, 2020-2030
4.2.5 100.1 MW–250 MW Market, 2020-2030
4.2.6 Above 250 MW Market, 2020-2030
5. Leading Regions in Floating Power Plant Market 2020-2030
5.1 Regional Overview
5.1.1 North America
5.1.2 Europe
5.1.3 Asia Pacific
5.1.4 LAMEA
5.1.5 Leading Countries/ Regions
5.2 U.S. Floating Power Plant Market Forecast, 2020-2030
5.2.1 U.S. Floating Power Plant Submarket, By Power Source Forecast 2020-2030
5.2.2 U.S. Floating Power Plant Submarket, By Capacity Forecast 2020-2030
5.3 Canada Floating Power Plant Market Forecast, 2020-2030
5.3.1 Canada Floating Power Plant Submarket, By Power Source Forecast 2020-2030
5.3.2 Canada Floating Power Plant Submarket, By Capacity Forecast 2020-2030
5.4 The UK Floating Power Plant Market Forecast, 2020-2030
5.4.1 The UK Floating Power Plant Submarket, By Power Source Forecast 2020-2030
5.4.2 The UK Floating Power Plant Submarket, By Capacity Forecast 2020-2030
5.5 Germany Floating Power Plant Market Forecast, 2020-2030
5.5.1 Germany Floating Power Plant Submarket, By Power Source Forecast 2020-2030
5.5.2 Germany Floating Power Plant Submarket, By Capacity Forecast 2020-2030
5.6 France Floating Power Plant Market Forecast, 2020-2030
5.6.1 France Floating Power Plant Submarket, By Power Source Forecast 2020-2030
5.6.2 France Floating Power Plant Submarket, By Capacity Forecast 2020-2030
5.7 Italy Floating Power Plant Market Forecast, 2020-2030
5.7.1 Italy Floating Power Plant Submarket, By Power Source Forecast 2020-2030
5.7.2 Italy Floating Power Plant Submarket, By Capacity Forecast 2020-2030
5.8 Spain Floating Power Plant Market Forecast, 2020-2030
5.8.1 Spain Floating Power Plant Submarket, By Power Source Forecast 2020-2030
5.8.2 Spain Floating Power Plant Submarket, By Capacity Forecast 2020-2030
5.9 Rest of Europe Floating Power Plant Market Forecast, 2020-2030
5.9.1 Rest of Europe Floating Power Plant Submarket, By Power Source Forecast 2020-2030
5.9.2 Rest of Europe Floating Power Plant Submarket, By Capacity Forecast 2020-2030
5.10 China Floating Power Plant Market Forecast, 2020-2030
5.10.1 China Floating Power Plant Submarket, By Power Source Forecast 2020-2030
5.10.2 China Floating Power Plant Submarket, By Capacity Forecast 2020-2030
5.11 India Floating Power Plant Market Forecast, 2020-2030
5.11.1 India Floating Power Plant Submarket, By Power Source Forecast 2020-2030
5.11.2 India Floating Power Plant Submarket, By Capacity Forecast 2020-2030
5.12 Japan Floating Power Plant Market Forecast, 2020-2030
5.12.1 Japan Floating Power Plant Submarket, By Power Source Forecast 2020-2030
5.12.2 Japan Floating Power Plant Submarket, By Capacity Forecast 2020-2030
5.13 Australia & New Zealand Floating Power Plant Market Forecast, 2020-2030
5.13.1 Australia & New Zealand Floating Power Plant Submarket, By Power Source Forecast 2020-2030
5.13.2 Australia & New Zealand Floating Power Plant Submarket, By Capacity Forecast 2020-2030
5.14 Rest of Asia-Pacific Floating Power Plant Market Forecast, 2020-2030
5.14.1 Rest of Asia-Pacific Floating Power Plant Submarket, By Power Source Forecast 2020-2030
5.14.2 Rest of Asia-Pacific Floating Power Plant Submarket, By Capacity Forecast 2020-2030
5.15 Latin America Floating Power Plant Market Forecast, 2020-2030
5.15.1 Latin America Floating Power Plant Submarket, By Power Source Forecast 2020-2030
5.15.2 Latin America Floating Power Plant Submarket, By Capacity Forecast 2020-2030
5.16 Middle East Floating Power Plant Market Forecast, 2020-2030
5.16.1 Middle East Floating Power Plant Submarket, By Power Source Forecast 2020-2030
5.16.2 Middle East Floating Power Plant Submarket, By Capacity Forecast 2020-2030
5.17 Africa Floating Power Plant Market Forecast, 2020-2030
5.17.1 Africa Floating Power Plant Submarket, By Power Source Forecast 2020-2030
5.17.2 Africa Floating Power Plant Submarket, By Capacity Forecast 2020-2030
7. Leading Companies in The Floating Power Plant Market
7.1 Caterpillar Inc.
7.1.1 Caterpillar Inc. Products and Services
7.1.2 Analysis of Caterpillar Inc. within the Floating Power Plant Market
7.1.3 Caterpillar Inc. M&A Activity
7.1.4 Future Outlook for Caterpillar Inc.
7.1.5 Caterpillar Inc. Projects
7.1 Ciel & Terre International
7.1.1 Ciel & Terre International Products and Services
7.1.2 Analysis of Ciel & Terre International within the Floating Power Plant Market
7.1.3 Ciel & Terre International M&A Activity
7.1.4 Future Outlook for Ciel & Terre International
7.1.5 Ciel & Terre International Projects
7.1 Floating Power Plant A/S
7.1.1 Floating Power Plant A/S Products and Services
7.1.2 Analysis of Floating Power Plant A/S within the Floating Power Plant Market
7.1.3 Floating Power Plant A/S M&A Activity
7.1.4 Future Outlook for Floating Power Plant A/S
7.1.5 Floating Power Plant A/S Projects
7.1 MAN Diesel & Turbo SE
7.1.1 MAN Diesel & Turbo SE Products and Services
7.1.2 Analysis of MAN Diesel & Turbo SE within the Floating Power Plant Market
7.1.3 MAN Diesel & Turbo SE M&A Activity
7.1.4 Future Outlook for MAN Diesel & Turbo SE
7.1.5 MAN Diesel & Turbo SE Projects
7.1 Mitsubishi Corporation
7.1.1 Mitsubishi Corporation Products and Services
7.1.2 Analysis of Mitsubishi Corporation within the Floating Power Plant Market
7.1.3 Mitsubishi Corporation M&A Activity
7.1.4 Future Outlook for Mitsubishi Corporation
7.1.5 Mitsubishi Corporation Projects
7.1 Wartsila General Electric Company
7.1.1 Wartsila General Electric Company Products and Services
7.1.2 Analysis of Wartsila General Electric Company within the Floating Power Plant Market
7.1.3 Wartsila General Electric Company M&A Activity
7.1.4 Future Outlook for Wartsila General Electric Company
7.1.5 Wartsila General Electric Company Projects
7.1 Siemens AG
7.1.1 Siemens AG Products and Services
7.1.2 Analysis of Siemens AG within the Floating Power Plant Market
7.1.3 Siemens AG M&A Activity
7.1.4 Future Outlook for Siemens AG
7.1.5 Siemens AG Projects
7.1 Ideol
7.1.1 Ideol Products and Services
7.1.2 Analysis of Ideol within the Floating Power Plant Market
7.1.3 Ideol M&A Activity
7.1.4 Future Outlook for Ideol
7.1.5 Ideol Projects
7.1 Kyocera Corporation
7.1.1 Kyocera Corporation Products and Services
7.1.2 Analysis of Kyocera Corporation within the Floating Power Plant Market
7.1.3 Kyocera Corporation M&A Activity
7.1.4 Future Outlook for Kyocera Corporation
7.1.5 Kyocera Corporation Projects
7.1 Principle Power Inc
7.1.1 Principle Power Inc Products and Services
7.1.2 Analysis of Principle Power Inc within the Floating Power Plant Market
7.1.3 Principle Power Inc M&A Activity
7.1.4 Future Outlook for Principle Power Inc
7.1.5 Principle Power Inc Projects
7.1 Upsolar
7.1.1 Upsolar Products and Services
7.1.2 Analysis of Upsolar within the Floating Power Plant Market
7.1.3 Upsolar M&A Activity
7.1.4 Future Outlook for Upsolar
7.1.5 Upsolar Projects
8. Conclusions and Recommendations
8.1 Global Floating Power Plant Market Outlook
8.2 Recommendations
9. Glossary
Associated Visiongain Reports
Visiongain Report Sales Order Form
Appendix A
About Visiongain
Appendix B
Visiongain Report Evaluation Form
List of Tables
Table 1.0 Key Highlights
Table 3.1 PEST Analysis, Floating Power Plant Market
Table 3.2 SWOT Analysis
Table 4.1 Global Floating Power Plant Market Forecast 2020-2030 ($Bn, AGR %, CAGR %, Cumulative)
Table 4.2 Global Floating Power Plant Submarket, By Power Source Forecast 2020-2030 ($billion, AGR %, Cumulative)
Table 4.3 Global Floating Power Plant Submarket, By Forecast 2020-2030 ($billion, AGR %, Cumulative)
Table 4.4 Global Floating Power Plant Submarket, By Forecast 2020-2030 ($billion, AGR %, Cumulative)
Table 5.1 Global Floating Power Plant Market, by Country/Region Forecast 2020-2030 ($billion, AGR %, Cumulative)
Table 5.2 Global Floating Power Plant Market, by Country/Region Forecast 2020-2030 ($billion, AGR %, Cumulative)
Table 5.3 Canada Floating Power Plant Market Forecast 2020-2030 ($billion, , AGR %, CAGR %, Cumulative)
Table 5.4 Canada Floating Power Plant Submarket, By Power Source Forecast 2020-2030 ($billion, AGR %, Cumulative)
Table 5.5 Canada Floating Power Plant Submarket, By Capacity Forecast 2020-2030 ($billion, AGR %, Cumulative)
Table 5.6 US Floating Power Plant Market Submarket, By Forecast 2020-2030 ($billion, , AGR %, CAGR %, Cumulative)
Table 5.7 US Floating Power Plant Submarket, By Power Source Forecast 2020-2030 ($billion, AGR %, Cumulative)
Table 5.8 US Floating Power Plant Submarket, By Capacity Forecast 2020-2030 ($billion, AGR %, Cumulative)
Table 5.9 Latin America Floating Power Plant Market Forecast 2020-2030 ($billion, , AGR %, CAGR %, Cumulative)
Table 5.10 Latin America Floating Power Plant Submarket, By Power Source Forecast 2020-2030 ($billion, AGR %, Cumulative)
Table 5.11 Latin America Floating Power Plant Submarket, By Capacity Forecast 2020-2030 ($billion, AGR %, Cumulative)
Table 5.12 Germany Floating Power Plant Market Submarket, By Forecast 2020-2030 ($billion, , AGR %, CAGR %, Cumulative)
Table 5.13 Germany Floating Power Plant Submarket, By Power Source Forecast 2020-2030 ($billion, AGR %, Cumulative)
Table 5.14 Germany Floating Power Plant Submarket, By Capacity Forecast 2020-2030 ($billion, AGR %, Cumulative)
Table 5.15 UK Floating Power Plant Market Submarket, By Forecast 2020-2030 ($billion, , AGR %, CAGR %, Cumulative)
Table 5.16 UK Floating Power Plant Submarket, By Power Source Forecast 2020-2030 ($billion, AGR %, Cumulative)
Table 5.17 UK Floating Power Plant Submarket, By Capacity Forecast 2020-2030 ($billion, AGR %, Cumulative)
Table 5.18 Spain Floating Power Plant Market Submarket, By Forecast 2020-2030 ($billion, , AGR %, CAGR %, Cumulative)
Table 5.19 Spain Floating Power Plant Submarket, By Power Source Forecast 2020-2030 ($billion, AGR %, Cumulative)
Table 5.20 Spain Floating Power Plant Submarket, By Capacity Forecast 2020-2030 ($billion, AGR %, Cumulative)
Table 5.21 UK Floating Power Plant Submarket, By Forecast 2020-2030 ($billion, , AGR %, CAGR %, Cumulative)
Table 5.22 UK Floating Power Plant Submarket, By Power Source Forecast 2020-2030 ($billion, AGR %, Cumulative)
Table 5.23 UK Floating Power Plant Submarket, By Capacity Forecast 2020-2030 ($billion, AGR %, Cumulative)
Table 5.24 China Floating Power Plant Submarket, By Forecast 2020-2030 ($billion, , AGR %, CAGR %, Cumulative)
Table 5.25 China Floating Power Plant Submarket, By Power Source Forecast 2020-2030 ($billion, AGR %, Cumulative)
Table 5.26 China Floating Power Plant Submarket, By Capacity Forecast 2020-2030 ($billion, AGR %, Cumulative)
Table 5.27 Australia Floating Power Plant Submarket, By Forecast 2020-2030 ($billion, , AGR %, CAGR %, Cumulative)
Table 5.28 Australia Floating Power Plant Submarket, By Power Source Forecast 2020-2030 ($billion, AGR %, Cumulative)
Table 5.29 Australia Floating Power Plant Submarket, By Capacity Forecast 2020-2030 ($billion, AGR %, Cumulative)
Table 5.30 South Korea Floating Power Plant Submarket, By Forecast 2020-2030 ($billion, , AGR %, CAGR %, Cumulative)
Table 5.31 South Korea Floating Power Plant Submarket, By Power Source Forecast 2020-2030 ($billion, AGR %, Cumulative)
Table 5.32 South Korea Floating Power Plant Submarket, By Capacity Forecast 2020-2030 ($billion, AGR %, Cumulative)
Table 5.33 Japan Floating Power Plant Submarket, By Forecast 2020-2030 ($billion, , AGR %, CAGR %, Cumulative)
Table 5.34 Japan Floating Power Plant Submarket, By Power Source Forecast 2020-2030 ($billion, AGR %, Cumulative)
Table 5.35 Japan Floating Power Plant Submarket, By Capacity Forecast 2020-2030 ($billion, AGR %, Cumulative)
Table 5.36 India Floating Power Plant Submarket, By Forecast 2020-2030 ($billion, , AGR %, CAGR %, Cumulative)
Table 5.37 India Floating Power Plant Submarket, By Power Source Forecast 2020-2030 ($billion, AGR %, Cumulative)
Table 5.38 India Floating Power Plant Submarket, By Capacity Forecast 2020-2030 ($billion, AGR %, Cumulative)
Table 5.39 Middle East Floating Power Plant Submarket, By Forecast 2020-2030 ($billion, , AGR %, CAGR %, Cumulative)
Table 5.40 Middle East Floating Power Plant Submarket, By Power Source Forecast 2020-2030 ($billion, AGR %, Cumulative)
Table 5.41 Middle East Floating Power Plant Submarket, By Capacity Forecast 2020-2030 ($billion, AGR %, Cumulative)
Table 5.42 Rest of Asia-Pacific Floating Power Plant Submarket, By Forecast 2020-2030 ($billion , , AGR %, CAGR %, Cumulative)
Table 5.43 Rest of Asia-Pacific Floating Power Plant Submarket, By Power Source Forecast 2020-2030 ($billion , AGR %, Cumulative)
Table 5.44 Rest of Asia-Pacific Floating Power Plant Submarket, By Capacity Forecast 2020-2030 ($billion , AGR %, Cumulative)
Table 5.45 Rest of Europe Floating Power Plant Submarket, By Forecast 2020-2030 ($billion, , AGR %, CAGR %, Cumulative)
Table 5.46 Rest of Europe Floating Power Plant Submarket, By Power Source Forecast 2020-2030 ($billion, AGR %, Cumulative)
Table 5.47 Rest of Europe Floating Power Plant Submarket, By Capacity Forecast 2020-2030 ($billion, AGR %, Cumulative)
Table 5.48 Africa Floating Power Plant Submarket, By Forecast 2020-2030 ($billion, , AGR %, CAGR %, Cumulative)
Table 5.49 Africa Floating Power Plant Submarket, By Power Source Forecast 2020-2030 ($billion, AGR %, Cumulative)
Table 5.50 Africa Floating Power Plant Submarket, By Capacity Forecast 2020-2030 ($billion, AGR %, Cumulative)
Table 5.51 Spain Floating Power Plant Submarket, By Forecast 2020-2030 ($billion , , AGR %, CAGR %, Cumulative)
Table 5.52 Spain Floating Power Plant Submarket, By Power Source Forecast 2020-2030 ($billion , AGR %, Cumulative)
Table 5.53 Spain Floating Power Plant Submarket, By Capacity Forecast 2020-2030 ($billion , AGR %, Cumulative)
Table 7.1 Caterpillar Inc. Profile 2019 (Market Entry, Public/Private, Headquarters, Geography, Key Market, Listed on, Products/Services
Table 7.2 Caterpillar Inc. Profile 2019 (Market Entry, Public/Private, Headquarter, Total Company Revenue $billion, Change in Revenue, Geography, Key Market, Listed on, Products/Services)
Table 7.3 Caterpillar Inc. Products and Services (Product/Service, Notes)
Table 7.4 Caterpillar Inc. Total Company Sales 2015-2019 (US$billion, AGR %)
Table 7.5 Caterpillar Inc. Total Company Recent Development 2015-2019
Table 7.6 Ciel & Terre International Profile 2019 (Market Entry, Public/Private, Headquarter, Total Company Revenue $billion, Change in Revenue, Geography, Key Market, Listed on, Products/Services)
Table 7.7 Ciel & Terre International Products and Services (Product/Service, Notes)
Table 7.8 Ciel & Terre International Total Company Sales 2015-2019 (US$billion, AGR %)
Table 7.9 Ciel & Terre International Total Company Recent Development 2015-2019
Table 7.10 Floating Power Plant A/S Profile 2019 (Market Entry, Public/Private, Headquarter, Total Company Revenue $billion, Change in Revenue, Geography, Key Market, Listed on, Products/Services)
Table 7.11 Floating Power Plant A/S Products and Services (Product/Service, Notes)
Table 7.12 Floating Power Plant A/S Total Company Sales 2015-2019 (US$billion, AGR %)
Table 7.13 Floating Power Plant A/S Total Company Recent Development 2015-2019
Table 7.14 MAN Diesel & Turbo SE Profile 2019 (Market Entry, Public/Private, Headquarter, Total Company Revenue $billion, Change in Revenue, Geography, Key Market, Listed on, Products/Services)
Table 7.15 MAN Diesel & Turbo SE Products and Services (Product/Service, Notes)
Table 7.16 MAN Diesel & Turbo SE Total Company Sales 2015-2019 (US$billion, AGR %)
Table 7.17 MAN Diesel & Turbo SE Total Company Recent Development 2015-2019
Table 7.18 Mitsubishi Corporation Profile 2019 (Market Entry, Public/Private, Headquarter, Total Company Revenue $billion, Change in Revenue, Geography, Key Market, Listed on, Products/Services)
Table 7.19 Mitsubishi Corporation Products and Services (Product/Service, Notes)
Table 7.20 Mitsubishi Corporation Total Company Sales 2015-2019 (US$billion, AGR %)
Table 7.21 Mitsubishi Corporation Total Company Recent Development 2015-2019
Table 7.22 Wartsila General Electric Company Profile 2019 (Market Entry, Public/Private, Headquarter, Total Company Revenue $billion, Change in Revenue, Geography, Key Market, Listed on, Products/Services)
Table 7.23 Wartsila General Electric Company Products and Services (Product/Service, Notes)
Table 7.24 Wartsila General Electric Company Total Company Sales 2015-2019 (US$billion, AGR %)
Table 7.25 Wartsila General Electric Company Total Company Recent Development 2015-2019
Table 7.26 Siemens AG Profile 2019 (Market Entry, Public/Private, Headquarter, Total Company Revenue $billion, Change in Revenue, Geography, Key Market, Listed on, Products/Services)
Table 7.27 Siemens AG Products and Services (Product/Service, Notes)
Table 7.28 Siemens AG Total Company Sales 2015-2019 (US$billion, AGR %)
Table 7.29 Siemens AG Total Company Recent Development 2015-2019
Table 7.30 Ideol Profile 2019 (Market Entry, Public/Private, Headquarter, Total Company Revenue $billion, Change in Revenue, Geography, Key Market, Listed on, Products/Services)
Table 7.31 Ideol Products and Services (Product/Service, Notes)
Table 7.32 Ideol Total Company Sales 2015-2019 (US$billion, AGR %)
Table 7.33 Ideol Total Company Recent Development 2015-2019
Table 7.34 Kyocera Corporation Profile 2019 (Market Entry, Public/Private, Headquarter, Total Company Revenue $billion, Change in Revenue, Geography, Key Market, Listed on, Products/Services)
Table 7.35 Kyocera Corporation Products and Services (Product/Service, Notes)
Table 7.36 Kyocera Corporation Total Company Sales 2015-2019 (US$billion, AGR %)
Table 7.37 Kyocera Corporation Total Company Recent Development 2015-2019
Table 7.38 Principle Power Inc Profile 2019 (Market Entry, Public/Private, Headquarter, Total Company Revenue $billion, Change in Revenue, Geography, Key Market, Listed on, Products/Services)
Table 7.39 Principle Power Inc Products and Services (Product/Service, Notes)
Table 7.40 Principle Power Inc Total Company Sales 2015-2019 (US$billion, AGR %)
Table 7.41 Principle Power Inc Total Company Recent Development 2015-2019
Table 7.42 Upsolar Profile 2019 (Market Entry, Public/Private, Headquarter, Total Company Revenue $billion, Change in Revenue, Geography, Key Market, Listed on, Products/Services)
Table 7.43 Upsolar Products and Services (Product/Service, Notes)
Table 7.44 Upsolar Total Company Sales 2015-2019 (US$billion, AGR %)
Table 7.45 Upsolar Total Company Recent Development 2015-2019
List of Figures
Figure 1.1 Global Floating Power Plant Market Segmentation
Figure 2.1 Floating Power Plant Value Chain Analysis
Figure 3.1 Floating Power Plant Supply-Demand Analysis
Figure 4.1 Global Floating Power Plant Forecast 2020-2030 ($billion, AGR %)
Figure 4.2 Global Floating Power Plant Market Forecast 2020-2030
Figure 4.3 Global Floating Power Plant Submarket Forecast by 2020-2030 ($ billion)
Figure 4.4 Global Floating Power Plant Market By Power Source Share Forecast 2020, 2025, 2030 (% Share)
Figure 4.19 Global Floating Power Plant by Submarket By Power Source Forecast 2020-2030 ($ million)
Figure 4.20 Global Floating Power Plant Market, by Share Forecast 2020, 2025, 2030 (% Share)
Figure 4.21 Floating Power Plant Market, By Power Source Forecast 2020-2030 ($billion, AGR%)
Figure 4.23 Floating Power Plant Market, By Power Source Forecast 2020-2030 ($billion, AGR%)
Figure 4.25 Floating Power Plant Market, By Power Source Forecast 2020-2030 ($billion, AGR%)
Figure 4.27 Floating Power Plant Market, By Power Source Forecast 2020-2030 ($billion, AGR%)
Figure 5.1 Regional/Country Floating Power Plant Market, by 2020-2030
Figure 5.3 Leading Country/Regional Floating Power Plant Market Share, by 2020
Figure 5.4 Leading Country/Regional Floating Power Plant Market Share, by 2025
Figure 5.5 Leading Country/Regional Floating Power Plant Market Share, by 2030
Figure 5.6 Canada Floating Power Plant Market Forecast 2020-2030 ($billion, AGR%)
Figure 5.7 Canada Floating Power Plant Market, by Forecast 2020-2030
Figure 5.8 Canada Floating Power Plant Submarket, By Power Source Forecast 2020-2030
Figure 5.9 Canada Floating Power Plant Submarket , By Capacity Forecast 2020-2030
Figure 5.10 Canada Floating Power Plant Submarket , By 2020-2030 ($billion, AGR%)
Figure 5.10 U.S. Floating Power Plant Market Forecast 2020-2030 ($billion, AGR%)
Figure 5.11 U.S. Floating Power Plant Market, by Forecast 2020-2030
Figure 5.12 U.S. Floating Power Plant Submarket, By Power Source Forecast 2020-2030
Figure 5.13 U.S. Floating Power Plant Submarket , By Capacity Forecast 2020-2030
Figure 5.13 U.S. Floating Power Plant Submarket , By Forecast 2020-2030
Figure 5.14 Latin America Floating Power Plant Market Forecast 2020-2030 ($billion , AGR%)
Figure 5.15 Latin America Floating Power Plant Market, by Forecast 2020-2030
Figure 5.16 Latin America Floating Power Plant Submarket, By Power Source Forecast 2020-2030
Figure 5.17 Latin America Floating Power Plant Submarket , By Capacity Forecast 2020-2030
Figure 5.17 Latin America Floating Power Plant Submarket , By Forecast 2020-2030
Figure 5.18 Germany Floating Power Plant Market Forecast 2020-2030 ($billion, AGR%)
Figure 5.19 Germany Floating Power Plant Market, by Forecast 2020-2030
Figure 5.20 Germany Floating Power Plant Submarket, By Power Source Forecast 2020-2030
Figure 5.21 Germany Floating Power Plant Submarket , By Capacity Forecast 2020-2030
Figure 5.21 Germany Floating Power Plant Submarket , By Forecast 2020-2030
Figure 5.22 U.K. Floating Power Plant Market Forecast 2020-2030 ($billion, AGR%)
Figure 5.23 U.K. Floating Power Plant Market, by Forecast 2020-2030
Figure 5.24 U.K. Floating Power Plant Submarket, By Power Source Forecast 2020-2030
Figure 5.25 U.K. Floating Power Plant Submarket , By Capacity Forecast 2020-2030
Figure 5.25 U.K. Floating Power Plant Submarket , By Forecast 2020-2030
Figure 5.26 Spain Floating Power Plant Market Forecast 2020-2030 ($billion, AGR%)
Figure 5.27 Spain Floating Power Plant Market, by Forecast 2020-2030
Figure 5.28 Spain Floating Power Plant Submarket, By Power Source Forecast 2020-2030
Figure 5.29 Spain Floating Power Plant Submarket , By Capacity Forecast 2020-2030
Figure 5.30 UK Floating Power Plant Market Forecast 2020-2030 ($billion, AGR%)
Figure 5.31 UK Floating Power Plant Market, by Forecast 2020-2030
Figure 5.32 UK Floating Power Plant Submarket, By Power Source Forecast 2020-2030
Figure 5.33 UK Floating Power Plant Submarket , By Capacity Forecast 2020-2030
Figure 5.34 China Floating Power Plant Market Forecast 2020-2030 ($billion, AGR%)
Figure 5.35 China Floating Power Plant Submarket , By , by Forecast 2020-2030
Figure 5.36 China Floating Power Plant Submarket, By Power Source Forecast 2020-2030
Figure 5.37 China Floating Power Plant Submarket , By Capacity Forecast 2020-2030
Figure 5.38 Australia Floating Power Plant Market Forecast 2020-2030 ($billion, AGR%)
Figure 5.39 Australia Floating Power Plant Submarket , By , by Forecast 2020-2030
Figure 5.40 Australia Floating Power Plant Submarket, By Power Source Forecast 2020-2030
Figure 5.41 Australia Floating Power Plant Submarket , By Capacity Forecast 2020-2030
Figure 5.42 South Korea Floating Power Plant Market Forecast 2020-2030 ($billion, AGR%)
Figure 5.43 South Korea Floating Power Plant Submarket , By , by Forecast 2020-2030
Figure 5.44 South Korea Floating Power Plant Submarket, By Power Source Forecast 2020-2030
Figure 5.45 South Korea Floating Power Plant Submarket , By Capacity Forecast 2020-2030
Figure 5.46 Japan Floating Power Plant Market Forecast 2020-2030 ($billion, AGR%)
Figure 5.47 Japan Floating Power Plant Submarket , By , by Forecast 2020-2030
Figure 5.48 Japan Floating Power Plant Submarket, By Power Source Forecast 2020-2030
Figure 5.49 Japan Floating Power Plant Submarket , By Capacity Forecast 2020-2030
Figure 5.50 India Floating Power Plant Market Forecast 2020-2030 ($billion, AGR%)
Figure 5.51 India Floating Power Plant Submarket , By , by Forecast 2020-2030
Figure 5.52 India Floating Power Plant Submarket, By Power Source Forecast 2020-2030
Figure 5.53 India Floating Power Plant Submarket , By Capacity Forecast 2020-2030
Figure 5.54 Middle East Floating Power Plant Market Forecast 2020-2030 ($billion, AGR%)
Figure 5.55 Middle East Floating Power Plant Submarket , By , by Forecast 2020-2030
Figure 5.56 Middle East Floating Power Plant Submarket, By Power Source Forecast 2020-2030
Figure 5.57 Middle East Floating Power Plant Submarket , By Capacity Forecast 2020-2030
Figure 5.70 Rest of the World Floating Power Plant Market Forecast 2020-2030 ($billion , AGR%)
Figure 5.71 Rest of the World Floating Power Plant Submarket , By , by Forecast 2020-2030
Figure 5.72 Rest of the World Floating Power Plant Submarket, By Power Source Forecast 2020-2030
Figure 5.73 Rest of the World Floating Power Plant Submarket , By Capacity Forecast 2020-2030
Figure 7.1 Caterpillar Inc. Total Company Sales 2013-2019 (US$ million, AGR %)
Figure 7.2 Ciel & Terre International Total Company Sales 2013-2019 (US$ million, AGR %)
Figure 7.3 Floating Power Plant A/S Total Company Sales 2013-2019 (US$ Bn, AGR %)
Figure 7.6 MAN Diesel & Turbo SE Company Sales 2013-2019 (US$ bn, AGR %)
Figure 7.7 MAN Diesel & Turbo SE Revenue % Share, by Segment, 2019
Figure 7.8 MAN Diesel & Turbo SE Revenue % Share, by Geographical Trade, 2019
Figure 7.9 MAN Diesel & Turbo SE Revenue % Share, by Business Segment, 2019
Figure 7.10 Mitsubishi Corporation Revenue % Share, by Geographic Segment, 2019
Figure 7.11 Wartsila General Electric Company Company Total Company Sales 2013-2019 (US$ million, AGR %)
Figure 7.12 Siemens AG Total Company Sales 2013-2019 (US$ million, AGR %)
Figure 7.13 Siemens AG Revenue % Share, by Regional Segment, 2019
Figure 7.14 Ideol Total Company Sales 2013-2019 (US$ million, AGR %)
Figure 7.15 Ideol Revenue % Share, by Regional Segment, 2019
Figure 7.16 Ideol Revenue % Share, by Business Segment, 2019
Figure 7.17 Kyocera Corporation Total Company Sales 2013-2019 (US$ bn, AGR %)
Figure 7.18 Principle Power Inc Total Company Revenue 2013-2019 (US$ bn, AGR %)
Figure 7.19 Principle Power Inc Company Sales 2014-2019 (US$ bn, AGR %)
Figure 7.20 Principle Power Inc Revenue % Share, by Business Segment, 2019