Industries > Defence > Dynamic Positioning (DP) Systems Market Report 2021-2031
 Systems Market Report 2021-2031")
Dynamic Positioning (DP) Systems Market Report 2021-2031
Forecasts by Application (Commercial, Military, Industrial, Other), by By End-Use (Original Equipment Manufacturer, Aftermarket, Other), by Function (Power System, Control System, Computers Thruster System, Position Reference Systems, Environmental & Motion Sensors, Operator Control Stations), by Technology (Conventional Technology, Next-generation Technology, Other), by Equipment (Class Class-I, Class-II, Class-III) AND Regional and Leading National Market Analysis PLUS Analysis of Leading Companies AND COVID-19 Recovery Scenarios
The Dynamic Positioning Systems Market Report 2021-2031: This report will prove invaluable to leading firms striving for new revenue pockets if they wish to better understand the industry and its underlying dynamics. It will be useful for companies that would like to expand into different industries or to expand their existing operations in a new region.
Increase in Seaborne Trade Across the Globe
Around 90% of global trade is transported by the international shipping industry. The global economy relies heavily on shipping. Intercontinental trade, bulk transportation of raw materials, and the import/export of affordable food and manufactured commodities would all be impossible without shipping. Seaborne trade is continuing to grow, resulting in lower freight costs for consumers all around the world. The industry’s prospects for continued growth remain bright, thanks to the increasing efficiency of shipping as a mode of transportation and further economic liberalisation. Over 50,000 merchant ships trade on a global scale, transporting all types of merchandise. Over a million sailors from nearly every nationality serve in the world fleet, which is registered in over 150 countries. Ships are highly sophisticated, high-value assets (bigger hi-tech boats can cost over $200 million to build), and merchant ship operations produce an estimated annual revenue of over half a trillion dollars in freight rates
What Are These Questions You Should Ask Before Buying A Market Research Report?
• How is the dynamic positioning systems market evolving?
• What is driving and restraining the dynamic positioning systems market?
• How will each dynamic positioning systems submarket segment grow over the forecast period and how much revenue will these submarkets account for in 2031?
• How will the market shares for each dynamic positioning systems submarket develop from 2021 to 2031?
• What will be the main driver for the overall market from 2021 to 2031?
• Will leading dynamic positioning systems markets broadly follow the macroeconomic dynamics, or will individual national markets outperform others?
• How will the market shares of the national markets change by 2031 and which geographical region will lead the market in 2031?
• Who are the leading players and what are their prospects over the forecast period?
• What are the dynamic positioning systems projects for these leading companies?
• How will the industry evolve during the period between 2020 and 2031?
• What are the implication of dynamic positioning systems projects taking place now and over the next 10 years?
• Is there a greater need for product commercialisation to further scale the dynamic positioning systems market?
• Where is the dynamic positioning systems market heading? And how can you ensure you are at the forefront of the market?
• What can be the best investment options for new product and service lines?
• What are the key prospects for moving companies into a new growth path? C-suite?
You need to discover how this will impact the dynamic positioning systems market today, and over the next 10 years:
• Our 451-page report provides 340 tables and 322 charts/graphs exclusively to you.
• The report highlights key lucrative areas in the industry so you can target them – NOW.
• Contains in-depth analyse of global, regional and national sales and growth
• Highlights for you the key successful trends, changes and revenue projections made by your competitors
This report tells you TODAY how the dynamic positioning systems market will develop in the next 10 years, and in-line with the variations in COVID-19 economic recession and bounce. This market is more critical now than at any point over the last 10 years.
Delivers exclusive COVID-19 variations economic data specific to your market.
To access the data contained in this document please email contactus@visiongain.com
Forecasts to 2031 and other analyses reveal the commercial prospects
• In addition to revenue forecasting to 2031, our new study provides you with recent results, growth rates, and market shares.
• You find original analyses, with business outlooks and developments.
• Discover qualitative analyses (including market dynamics, drivers, opportunities, restraints and challenges), cost structure, impact of rising dynamic positioning systems prices and recent developments.
This report includes data analysis and invaluable insight into how COVID-19 will affect the industry and your company. Four COVID-19 recovery patterns and their impact, namely, V, L, W and U are discussed in this report.
Global Dynamic Positioning Systems Market (COVID Impact Analysis) by Equipment Class
• Class-I
• Class-II
• Class-III
Global Dynamic Positioning Systems Market (COVID Impact Analysis) by Technology
• Conventional Technology
• Next-generation Technology
• Other Technology
Global Dynamic Positioning Systems Market (COVID Impact Analysis) by Function
• Power System
• Control System Computers
• Thruster System
• Position Reference Systems
• Environmental & Motion Sensors
• Operator Control Stations
Global Dynamic Positioning Systems Market (COVID Impact Analysis) by End-Use
• Original Equipment Manufacturer (OEM)
• Aftermarket
• Other End-Use
Global Dynamic Positioning Systems Market (COVID Impact Analysis) by Application
• Commercial
• Industrial
• Military
• Other Application

In addition to the revenue predictions for the overall world market and segments, you will also find revenue forecasts for 4 regional and 20 leading national markets:
• North America Dynamic Positioning Systems Market, 2021 to 2031 Market Outlook
• U.S. Dynamic Positioning Systems Market, 2021 to 2031 Market Forecast & COVID Impact Analysis
• Canada Dynamic Positioning Systems Market, 2021 to 2031 Market Forecast & COVID Impact Analysis
• Mexico Dynamic Positioning Systems Market, 2021 to 2031 Market Forecast & COVID Impact Analysis
• Europe Dynamic Positioning Systems Market, 2021 to 2031 Market Outlook
• Germany Dynamic Positioning Systems Market, 2021 to 2031 Market Forecast & COVID Impact Analysis
• Spain Dynamic Positioning Systems Market, 2021 to 2031 Market Forecast & COVID Impact Analysis
• United Kingdom Dynamic Positioning Systems Market, 2021 to 2031 Market Forecast & COVID Impact Analysis
• France Dynamic Positioning Systems Market, 2021 to 2031 Market Forecast & COVID Impact Analysis
• Italy Dynamic Positioning Systems Market, 2021 to 2031 Market Forecast & COVID Impact Analysis
• Rest of Europe Market Forecast & COVID Impact Analysis
• Asia Pacific Dynamic Positioning Systems Market, 2021 to 2031 Market Outlook
• China Dynamic Positioning Systems Market, 2021 to 2031 Market Forecast & COVID Impact Analysis
• Japan Dynamic Positioning Systems Market, 2021 to 2031 Market Forecast & COVID Impact Analysis
• India Dynamic Positioning Systems Market, 2021 to 2031 Market Forecast & COVID Impact Analysis
• Australia Dynamic Positioning Systems Market, 2021 to 2031 Market Forecast & COVID Impact Analysis
• South Korea Dynamic Positioning Systems Market, 2021 to 2031 Market Forecast & COVID Impact Analysis
• Rest of Asia Pacific Market Forecast & COVID Impact Analysis
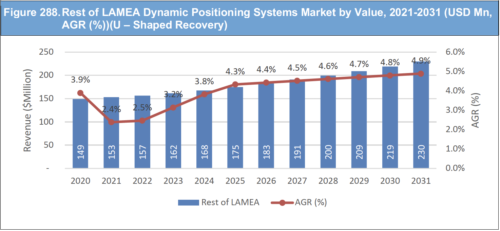
• LAMEA Dynamic Positioning Systems Market, 2021 to 2031 Market Outlook
• Brazil Dynamic Positioning Systems Market, 2021 to 2031 Market Forecast & COVID Impact Analysis
• Turkey Dynamic Positioning Systems Market, 2021 to 2031 Market Forecast & COVID Impact Analysis
• Saudi Arabia Dynamic Positioning Systems Market, 2021 to 2031 Market Forecast & COVID Impact Analysis
• South Africa Dynamic Positioning Systems Market, 2021 to 2031 Market Forecast & COVID Impact Analysis
• UAE Dynamic Positioning Systems Market, 2021 to 2031 Market Forecast & COVID Impact Analysis
• Rest of Latin America, Middle East and Africa
Need industry data? Please contact us today.
The report also includes profiles and for some of the leading companies in the Dynamic Positioning Systems Market, 2021 to 2031, with a focus on this segment of these companies’ operations.
Leading companies and the potential for market growth
• Kongsberg Gruppen Asa
• Abb Ltd
• General Electric Company
• Wartsila Oyj Abp
• Rolls-Royce Holdings PLC
• AB Volvo
• Twin Disc
• L3Harris Technologies, Inc.
• Praxis Automation Technology
• Moxa
• Sonardyne International Ltd.
• Xenta Systems
• Thrustmaster of Texas, Inc.
• Royal IHC
• Reygar
• RH Marine
• Marine Technologies plc
• Raytheon Technologies
Overall world revenue for Dynamic Positioning Systems Market, 2021 to 2031 in terms of value the market will surpass US$xx million in 2021, our work calculates. We predict strong revenue growth through to 2031. Our work identifies which organizations hold the greatest potential. Discover their capabilities, progress, and commercial prospects, helping you stay ahead.
How the Dynamic Positioning Systems Market, 2021 to 2031 Market report helps you?
In summary, our 450+ page report provides you with the following knowledge:
• Revenue forecasts to 2031 for Dynamic Positioning Systems Market, 2021 to 2031 Market, with forecasts for equipment class, end-use, function, application each forecasted at a global and regional level– discover the industry’s prospects, finding the most lucrative places for investments and revenues
• Revenue forecasts to 2031 for 4 regional and 20 key national markets – See forecasts for the Dynamic Positioning Systems Market, 2021 to 2031 market in North America, Europe, Asia-Pacific and LAMEA. Also forecasted is the market in the US, Canada, Mexico, Brazil, Germany, France, UK, Italy, China, India, Japan, and Australia among other prominent economies.
• Prospects for established firms and those seeking to enter the market– including company profiles for 18 of the major companies involved in the Dynamic Positioning Systems Market, 2021 to 2031 Market.
Find quantitative and qualitative analyses with independent predictions. Receive information that only our report contains, staying informed with this invaluable business intelligence.
Information found nowhere else
With our newly report title, you are less likely to fall behind in knowledge or miss out on opportunities. See how our work could benefit your research, analyses, and decisions.
Visiongain’s study is for everybody needing commercial analyses for the Dynamic Positioning Systems Market, 2021 to 2031 Market and leading companies. You will find data, trends and predictions.
To access the data contained in this document please email contactus@visiongain.com
Buy our report today Dynamic Positioning (DP) Systems Market Report 2021-2031: Forecasts by Application (Commercial, Military, Industrial, Other), by By End-Use (Original Equipment Manufacturer, Aftermarket, Other), by Function (Power System, Control System, Computers Thruster System, Position Reference Systems, Environmental & Motion Sensors, Operator Control Stations), by Technology (Conventional Technology, Next-generation Technology, Other), by Equipment (Class Class-I, Class-II, Class-III) AND Regional and Leading National Market Analysis PLUS Analysis of Leading Companies AND COVID-19 Recovery Scenarios. Avoid missing out by staying informed – order our report now.
Visiongain is a trading partner with the US Federal Government
CCR Ref number: KD4R6
Do you have any custom requirements we can help you with? Any need for a specific country, geo region, market segment or specific company information? Contact us today, we can discuss your needs and see how we can help: sara.peerun@visiongain.com
1.1 Introduction to Dynamic Positioning Systems Market
1.2 Global Dynamic Positioning Systems Market Overview
1.3 What are the Objectives of this Report?
1.4 What is the Scope of the Report?
1.5 Why You Should Read This Report
1.6 What This Report Delivers
1.7 Key Questions Answered By This Analytical Report Include:
1.8 Who is This Report for?
1.9 Research Methodology
1.9.1 Primary Research
1.9.2 Secondary Research
1.9.3 Market Evaluation & Forecasting Methodology
1.10 Frequently Asked Questions (FAQs)
1.11 Associated Visiongain Reports
1.12 About Visiongain
2 Executive Summary
3 Global Market Dynamics
3.1 Current Trends in the Global Market
3.2 Market Driving Factors
3.2.1 Increase in Seaborne Trade Across the Globe
3.2.2 Increasing Operations in the Offshore Shipping Industry
3.2.3 Advancements being made to make the technology ‘autonomous’ with a minimal human interface.
3.2.4 Development in controllers
3.2.5 Development in DP Technology:
3.2.6 Regulatory Development in DP :
3.3 Market Restraining Factors
3.3.1 Irrespective of the level of automation achieved, malfunctions cannot be resolved automatically and needs human interference.
3.3.2 Growing protectionism in Shipping Industry:
3.3.3 Lack of standardised infrastructure
3.4 Opportunities in the Global Market
3.4.1 Laser-Based Dynamic Positioning Systems
3.4.2 Autonomous Shipping Industry
3.5 Challenges in the Global Market
3.5.1 COVID-19 Affecting the Shipping Industry
3.5.2 Complex Systems Difficult to be Operated by Unskilled Operators
3.6 SWOT Analysis:
3.7 PEST Analysis:
3.7.1 Political Analysis:
3.7.2 Economical Analysis:
3.7.3 Socio – Analysis:
3.7.4 Technological Analysis:
3.8 Porter’s Five Forces Analysis:
3.8.1 Threat of New Entry
3.8.2 Threat of Substitution
3.8.3 Bargaining Power of Suppliers
3.8.4 Bargaining Power of Buyer
3.8.5 Competitive Rivalry/ Competitive Environment
4 Global Dynamic Positioning Systems Market Analysis
4.1 Global Market Outlook
4.2 Global Market Size Estimation and Forecast
4.2.1 Pre-COVID-19 Market Scenario
4.2.2 Post-COVID-19 Market Scenarios (V, W, U, L-Shaped Recovery Analysis)
5 Global Dynamic Positioning Systems Market Analysis By Region
5.1 North America
5.2 Europe
5.3 Asia Pacific
5.4 LAMEA
5.5 Regional Market Size Estimation and Forecast
5.5.1 Pre-COVID-19 Market Scenario
5.5.2 Post-COVID-19 Market Scenarios (V, W, U, L-Shaped Recovery Analysis)
6 Global Dynamic Positioning Systems Market Analysis By Equipment Class
6.1 Class-I
6.2 Class-II
6.3 Class-III
6.4 Global Market Size Estimation and Forecast Equipment Class
6.4.1 Pre-COVID-19 Market Scenario
6.4.2 Post-COVID-19 Market Scenarios (V, W, U, L-Shaped Recovery Analysis)
7 Global Dynamic Positioning Systems Market Analysis By Technology
7.1 Conventional Technology
7.2 Next-generation Technology
7.3 Global Market Size Estimation and Forecast Technology
7.3.1 Pre-COVID-19 Market Scenario
7.3.2 Post-COVID-19 Market Scenarios (V, W, U, L-Shaped Recovery Analysis)
8 Global Dynamic Positioning Systems Market Analysis By Function
8.1 Power System
8.2 Control System Computers
8.3 Thruster System
8.4 Position Reference Systems
8.5 Environmental & Motion Sensors
8.6 Operator Control Stations
8.7 Global Market Size Estimation and Forecast Function
8.7.1 Pre-COVID-19 Market Scenario
8.7.2 Post-COVID-19 Market Scenarios (V, W, U, L-Shaped Recovery Analysis)
9 Global Dynamic Positioning Systems Market Analysis By End-Use
9.1 Original Equipment Manufacturer
9.2 Aftermarket
9.3 Global Market Size Estimation and Forecast End-Use
9.3.1 Pre-COVID-19 Market Scenario
9.3.2 Post-COVID-19 Market Scenarios (V, W, U, L-Shaped Recovery Analysis)
10 Global Dynamic Positioning Systems Market Analysis By Application
10.1 Commercial
10.2 Military
10.3 Industrial
10.4 Global Market Size Estimation and Forecast Application
10.4.1 Pre-COVID-19 Market Scenario
10.4.2 Post-COVID-19 Market Scenarios (V, W, U, L-Shaped Recovery Analysis)
11 North America Dynamic Positioning Systems Market Analysis
11.1 Increasing investments in the naval operations
11.2 Increasing Offshore Shipping Industry
11.3 North America Market Size Estimation and Forecast
11.3.1 Pre-COVID-19 Market Scenario
11.3.2 Post-COVID-19 Market Scenarios (V, W, U, L-Shaped Recovery Analysis)
11.4 Country Market Size Estimation and Forecast
11.4.1 Pre-COVID-19 Market Scenario
11.4.2 Post-COVID-19 Market Scenarios (V, W, U, L-Shaped Recovery Analysis)
11.5 North America Market Size Estimation and Forecast Equipment Class
11.5.1 Pre-COVID-19 Market Scenario
11.5.2 Post-COVID-19 Market Scenarios (V, W, U, L-Shaped Recovery Analysis)
11.6 North America Market Size Estimation and Forecast Technology
11.6.1 Pre-COVID-19 Market Scenario
11.6.2 Post-COVID-19 Market Scenarios (V, W, U, L-Shaped Recovery Analysis)
11.7 North America Market Size Estimation and Forecast Function
11.7.1 Pre-COVID-19 Market Scenario
11.7.2 Post-COVID-19 Market Scenarios (V, W, U, L-Shaped Recovery Analysis)
11.8 North America Market Size Estimation and Forecast End-Use
11.8.1 Pre-COVID-19 Market Scenario
11.8.2 Post-COVID-19 Market Scenarios (V, W, U, L-Shaped Recovery Analysis)
11.9 North America Market Size Estimation and Forecast Application
11.9.1 Pre-COVID-19 Market Scenario
11.9.2 Post-COVID-19 Market Scenarios (V, W, U, L-Shaped Recovery Analysis)
11.10 US Dynamic Positioning Systems Market Analysis
11.10.1 Increasing Investment in naval Industry Leading to DP market Growth:
11.10.2 Increasing deep-water activities in offshore are likely to drive the US oil and gas upstream market
11.10.3 US Dynamic Positioning Systems Market Pre-COVID-19 Market Scenario
11.10.4 US Dynamic Positioning Systems Market Post-COVID-19 Market Scenarios (V, W, U, L-Shaped Recovery Analysis)
11.11 Canada Dynamic Positioning Systems Market Analysis
11.11.1 Wartsila to add retractable thrusters, DP on Canadian icebreaker
11.11.2 Canada Dynamic Positioning Systems Market Pre-COVID-19 Market Scenario
11.11.3 Canada Dynamic Positioning Systems Market Post-COVID-19 Market Scenarios (V, W, U, L-Shaped Recovery Analysis)
11.12 Mexico Dynamic Positioning Systems Market Analysis
11.12.1 Dynamic Positioning Innovator Sets to Pounce On Mexico
11.12.2 Mexico Dynamic Positioning Systems Market Pre-COVID-19 Market Scenario
11.12.3 Mexico Dynamic Positioning Systems Market Post-COVID-19 Market Scenarios (V, W, U, L-Shaped Recovery Analysis)
12 Europe Dynamic Positioning Systems Market Analysis
12.1 European shipbuilding industry is a competitive and dynamic industry.
12.2 Rise in Shipping Industry leading to Dynamic Positioning Systems Market Growth in Europe :
12.3 Europe Market Size Estimation and Forecast
12.3.1 Pre-COVID-19 Market Scenario
12.3.2 Post-COVID-19 Market Scenarios (V, W, U, L-Shaped Recovery Analysis)
12.4 Country Market Size Estimation and Forecast
12.4.1 Pre-COVID-19 Market Scenario
12.4.2 Post-COVID-19 Market Scenarios (V, W, U, L-Shaped Recovery Analysis)
12.5 Europe Market Size Estimation and Forecast Equipment Class
12.5.1 Pre-COVID-19 Market Scenario
12.5.2 Post-COVID-19 Market Scenarios (V, W, U, L-Shaped Recovery Analysis)
12.6 Europe Market Size Estimation and Forecast Technology
12.6.1 Pre-COVID-19 Market Scenario
12.6.2 Post-COVID-19 Market Scenarios (V, W, U, L-Shaped Recovery Analysis)
12.7 Europe Market Size Estimation and Forecast Function
12.7.1 Pre-COVID-19 Market Scenario
12.7.2 Post-COVID-19 Market Scenarios (V, W, U, L-Shaped Recovery Analysis)
12.8 Europe Market Size Estimation and Forecast End-Use
12.8.1 Pre-COVID-19 Market Scenario
12.8.2 Post-COVID-19 Market Scenarios (V, W, U, L-Shaped Recovery Analysis)
12.9 Europe Market Size Estimation and Forecast Application
12.9.1 Pre-COVID-19 Market Scenario
12.9.2 Post-COVID-19 Market Scenarios (V, W, U, L-Shaped Recovery Analysis)
12.10 Germany Dynamic Positioning Market Analysis
12.10.1 German maritime industry facing major challenges
12.10.2 Germany Dynamic Positioning Market Pre-COVID-19 Market Scenario
12.10.3 Germany Dynamic Positioning Market Post-COVID-19 Market Scenarios (V, W, U, L-Shaped Recovery Analysis)
12.11 UK Dynamic Positioning Market Analysis
12.11.1 UK consortium launches marine energy cost-cutting DP barge
12.11.2 UK Dynamic Positioning Market Pre-COVID-19 Market Scenario
12.11.3 UK Dynamic Positioning Market Post-COVID-19 Market Scenarios (V, W, U, L-Shaped Recovery Analysis)
12.12 France Dynamic Positioning Systems Market Analysis
12.12.1 A remote Dynamic Positioning System for the first teleoperated vessel by satellite
12.12.2 France Dynamic Positioning Systems Market Pre-COVID-19 Market Scenario
12.12.3 France Dynamic Positioning Systems Market Post-COVID-19 Market Scenarios (V, W, U, L-Shaped Recovery Analysis)
12.13 Italy Dynamic Positioning Systems Market Analysis
12.13.1 French-Italian naval joint venture invests in future technologies
12.13.2 Italy Dynamic Positioning Systems Market Pre-COVID-19 Market Scenario
12.13.3 Italy Dynamic Positioning Systems Market Post-COVID-19 Market Scenarios (V, W, U, L-Shaped Recovery Analysis)
12.14 Spain Dynamic Positioning Systems Market Analysis
12.14.1 DP & Marine Assurance are expert providers of DP Proving Trials in Spain and leaders in remote dynamic positioning testing.
12.14.2 Spain Dynamic Positioning Systems Market Pre-COVID-19 Market Scenario
12.14.3 Spain Dynamic Positioning Systems Market Post-COVID-19 Market Scenarios (V, W, U, L-Shaped Recovery Analysis)
12.15 Rest of Europe Dynamic Positioning Systems Market Analysis
12.15.1 Rest of Europe Dynamic Positioning Systems Market Pre-COVID-19 Market Scenario
12.15.2 Rest of Europe Dynamic Positioning Systems Market Post-COVID-19 Market Scenarios (V, W, U, L-Shaped Recovery Analysis)
13 Asia-Pacific Dynamic Positioning Systems Market Analysis
13.1 High Consumption of Oil and Gas in Major Countries to Help Asia Pacific Dominate
13.2 Increased recreational water activities and commercial commerce leading to market growth :
13.3 Asia-Pacific Market Size Estimation and Forecast
13.3.1 Pre-COVID-19 Market Scenario
13.3.2 Post-COVID-19 Market Scenarios (V, W, U, L-Shaped Recovery Analysis)
13.4 Country Market Size Estimation and Forecast
13.4.1 Pre-COVID-19 Market Scenario
13.4.2 Post-COVID-19 Market Scenarios (V, W, U, L-Shaped Recovery Analysis)
13.5 Asia-Pacific Market Size Estimation and Forecast By Equipment Class
13.5.1 Pre-COVID-19 Market Scenario
13.5.2 Post-COVID-19 Market Scenarios (V, W, U, L-Shaped Recovery Analysis)
13.6 Asia-Pacific Market Size Estimation and Forecast By Technology
13.6.1 Pre-COVID-19 Market Scenario
13.6.2 Post-COVID-19 Market Scenarios (V, W, U, L-Shaped Recovery Analysis)
13.7 Asia-Pacific Market Size Estimation and Forecast By Function
13.7.1 Pre-COVID-19 Market Scenario
13.7.2 Post-COVID-19 Market Scenarios (V, W, U, L-Shaped Recovery Analysis)
13.8 Asia-Pacific Market Size Estimation and Forecast By End-Use
13.8.1 Pre-COVID-19 Market Scenario
13.8.2 Post-COVID-19 Market Scenarios (V, W, U, L-Shaped Recovery Analysis)
13.9 Asia-Pacific Market Size Estimation and Forecast By Application
13.9.1 Pre-COVID-19 Market Scenario
13.9.2 Post-COVID-19 Market Scenarios (V, W, U, L-Shaped Recovery Analysis)
13.10 China Dynamic Positioning Systems Market Analysis
13.10.1 China's shipping industry has certain cost advantage on the international market.
13.10.2 China Dynamic Positioning Systems Market Pre-COVID-19 Market Scenario
13.10.3 China Dynamic Positioning Systems Market Post-COVID-19 Market Scenarios (V, W, U, L-Shaped Recovery Analysis)
13.11 India Dynamic Positioning Systems Market Analysis
13.11.1 Increased Investments in Shipping Industry driving the DP market:
13.11.2 India Dynamic Positioning Systems Market Pre-COVID-19 Market Scenario
13.11.3 India Dynamic Positioning Systems Market Post-COVID-19 Market Scenarios (V, W, U, L-Shaped Recovery Analysis)
13.12 Japan Dynamic Positioning Systems Market Analysis
13.12.1 ABB wins system contract for Japan’s first super-size wind turbine installation vessel
13.12.2 Japan Dynamic Positioning Systems Market Pre-COVID-19 Market Scenario
13.12.3 Japan Dynamic Positioning Systems Market Post-COVID-19 Market Scenarios (V, W, U, L-Shaped Recovery Analysis)
13.13 South Korea Dynamic Positioning Systems Market Analysis
13.13.1 Korea Leading Global Shipbuilding Industry
13.13.2 South Korea Dynamic Positioning Systems Market Pre-COVID-19 Market Scenario
13.13.3 South Korea Dynamic Positioning Systems Market Post-COVID-19 Market Scenarios (V, W, U, L-Shaped Recovery Analysis)
13.14 Australia Dynamic Positioning Systems Market Analysis
13.14.1 Australia to invest $770m to boost naval capabilities
13.14.2 Australia Dynamic Positioning Systems Market Pre-COVID-19 Market Scenario
13.14.3 Australia Dynamic Positioning Systems Market Post-COVID-19 Market Scenarios (V, W, U, L-Shaped Recovery Analysis)
13.15 Rest of Asia-Pacific Dynamic Positioning Systems Market Analysis
13.15.1 Rest of Asia-Pacific Dynamic Positioning Systems Market Pre-COVID-19 Market Scenario
13.15.2 Rest of Asia-Pacific Dynamic Positioning Systems Market Post-COVID-19 Market Scenarios (V, W, U, L-Shaped Recovery Analysis)
14 LAMEA Dynamic Positioning Systems Market Analysis
14.1 Increasing Sea Trade in LAMEA Market :
14.2 LAMEA Market Size Estimation and Forecast
14.2.1 Pre-COVID-19 Market Scenario
14.2.2 Post-COVID-19 Market Scenarios (V, W, U, L-Shaped Recovery Analysis)
14.3 Country Market Size Estimation and Forecast
14.3.1 Pre-COVID-19 Market Scenario
14.3.2 Post-COVID-19 Market Scenarios (V, W, U, L-Shaped Recovery Analysis)
14.4 LAMEA Market Size Estimation and Forecast Equipment Class
14.4.1 Pre-COVID-19 Market Scenario
14.4.2 Post-COVID-19 Market Scenarios (V, W, U, L-Shaped Recovery Analysis)
14.5 LAMEA Market Size Estimation and Forecast Technology
14.5.1 Pre-COVID-19 Market Scenario
14.5.2 Post-COVID-19 Market Scenarios (V, W, U, L-Shaped Recovery Analysis)
14.6 LAMEA Market Size Estimation and Forecast Function
14.6.1 Pre-COVID-19 Market Scenario
14.6.2 Post-COVID-19 Market Scenarios (V, W, U, L-Shaped Recovery Analysis)
14.7 LAMEA Market Size Estimation and Forecast End-Use
14.7.1 Pre-COVID-19 Market Scenario
14.7.2 Post-COVID-19 Market Scenarios (V, W, U, L-Shaped Recovery Analysis)
14.8 LAMEA Market Size Estimation and Forecast Application
14.8.1 Pre-COVID-19 Market Scenario
14.8.2 Post-COVID-19 Market Scenarios (V, W, U, L-Shaped Recovery Analysis)
14.9 Brazil Dynamic Positioning Systems Market Analysis
14.9.1 AET’s Eagle Pilar completes first ship-to-ship operation in Brazil
14.9.2 Brazil Dynamic Positioning Systems Market Pre-COVID-19 Market Scenario
14.9.3 Brazil Dynamic Positioning Systems Market Post-COVID-19 Market Scenarios (V, W, U, L-Shaped Recovery Analysis)
14.10 South Africa Dynamic Positioning Systems Market Analysis
14.10.1 KONGSBERG's expansion in South Africa
14.10.2 South Africa Dynamic Positioning Systems Market Pre-COVID-19 Market Scenario
14.10.3 South Africa Dynamic Positioning Systems Market Post-COVID-19 Market Scenarios (V, W, U, L-Shaped Recovery Analysis)
14.11 Saudi Arabia Dynamic Positioning Systems Market Analysis
14.11.1 KDU is Appointed as GE’s Value-Added Reseller for Its SeaStream* and SeaLyte* DP Systems
14.11.2 Saudi Arabia Dynamic Positioning Systems Market Pre-COVID-19 Market Scenario
14.11.3 Saudi Arabia Dynamic Positioning Systems Market Post-COVID-19 Market Scenarios (V, W, U, L-Shaped Recovery Analysis)
14.12 Turkey Dynamic Positioning Systems Market Analysis
14.12.1 Turkey became a strong naval power in recent years
14.12.2 Why Turkey invests much in naval forces
14.12.3 Turkey Dynamic Positioning Systems Market Pre-COVID-19 Market Scenario
14.12.4 Turkey Dynamic Positioning Systems Market Post-COVID-19 Market Scenarios (V, W, U, L-Shaped Recovery Analysis)
14.13 UAE Dynamic Positioning Systems Market Analysis
14.13.1 UAE government has maintained its efforts and goals to create conditions for the growth of the industry and increasing importance of the UAE as a major maritime centre.
14.13.2 UAE Dynamic Positioning Systems Market Pre-COVID-19 Market Scenario
14.13.3 UAE Dynamic Positioning Systems Market Post-COVID-19 Market Scenarios (V, W, U, L-Shaped Recovery Analysis)
14.14 Rest of LAMEA Dynamic Positioning Systems Market Analysis
14.14.1 Rest of LAMEA Dynamic Positioning Systems Market Pre-COVID-19 Market Scenario
14.14.2 Rest of LAMEA Dynamic Positioning Systems Market Post-COVID-19 Market Scenarios (V, W, U, L-Shaped Recovery Analysis)
15 Leading Company Profiles
15.1 Kongsberg Gruppen Asa
15.1.1 Company Snapshot
15.1.2 Company Overview
15.1.3 Company Financial Profile
15.1.4 Company Product Benchmarking
15.1.5 Company Recent Developments
15.2 Abb Group
15.2.1 Company Snapshot
15.2.2 Company Overview
15.2.3 Company Financial Profile
15.2.4 Company Product Benchmarking
15.2.5 Company Recent Developments
15.3 General Electric Company
15.3.1 Company Snapshot
15.3.2 Company Overview
15.3.3 Company Financial Profile
15.3.4 Company Product Benchmarking
15.3.5 Company Recent Developments
15.4 Wartsila Oyj Abp
15.4.1 Company Snapshot
15.4.2 Company Overview
15.4.3 Company Financial Profile
15.4.4 Company Product Benchmarking
15.4.5 Company Recent Developments
15.5 Rolls-Royce Plc.
15.5.1 Company Snapshot
15.5.2 Company Overview
15.5.3 Company Financial Profile
15.5.4 Company Product Benchmarking
15.5.5 Company Recent Developments
15.6 A.B. Volvo
15.6.1 Company Snapshot
15.6.2 Company Overview
15.6.3 Company Financial Profile
15.6.4 Company Product Benchmarking
15.7 Twin Disc
15.7.1 Company Snapshot
15.7.2 Company Overview
15.7.3 Company Financial Profile
15.7.4 Company Product Benchmarking
15.8 L3harris Technologies Inc.
15.8.1 Company Snapshot
15.8.2 Company Overview
15.8.3 Company Financial Profile
15.8.4 Company Product Benchmarking
15.9 Praxis Automation Technology
15.9.1 Company Snapshot
15.9.2 Company Overview
15.9.3 Company Product Benchmarking
15.9.4 Company Recent Developments
15.10 Moxa Inc.
15.10.1 Company Snapshot
15.10.2 Company Overview
15.10.3 Company Product Benchmarking
15.10.4 Company Recent Developments
15.11 Sonardyne
15.11.1 Company Snapshot
15.11.2 Company Overview
15.11.3 Company Product Benchmarking
15.11.4 Company Recent Developments
15.12 Xenta Systems
15.12.1 Company Snapshot
15.12.2 Company Overview
15.12.3 Company Product Benchmarking
15.12.4 Company Recent Developments
15.13 Thrustmaster of Texas
15.13.1 Company Snapshot
15.13.2 Company Overview
15.13.3 Company Product Benchmarking
15.13.4 Company Recent Developments
15.14 Royal IHC
15.14.1 Company Snapshot
15.14.2 Company Overview
15.14.3 Company Product Benchmarking
15.14.4 Company Recent Developments
15.15 Reygar
15.15.1 Company Snapshot
15.15.2 Company Overview
15.15.3 Company Product Benchmarking
15.15.4 Company Recent Developments
15.16 RH Marine
15.16.1 Company Snapshot
15.16.2 Company Overview
15.16.3 Company Product Benchmarking
15.16.4 Company Recent Developments
15.17 Marine Technologies plc
15.17.1 Company Snapshot
15.17.2 Company Overview
15.17.3 Company Product Benchmarking
15.18 Raytheon Anschutz
15.18.1 Company Snapshot
15.18.2 Company Overview
15.18.3 Company Product Benchmarking
16 Conclusion
16.1 Concluding Remarks From Visiongain:
16.2 Recommendations
16.3 Asia-Pacific Market has Highest Growth Segment :
17 Glossary Terms
List of Tables
Table 1. Global Dynamic Positioning Systems Market Forecast, 2021-2031 (USD Mn, AGR (%), CAGR(%))
Table 2. Global Dynamic Positioning Systems Market Snapshot, 2021 & 2031 (US$million, CAGR %)
Table 3. Global Dynamic Positioning Systems Market SWOT Analysis 2021-2031
Table 4. Global Dynamic Positioning Systems Market Forecast, 2021-2031 (USD Mn, AGR (%), CAGR(%))
Table 5. Global Dynamic Positioning Systems Market Forecast, 2021-2031 (USD Mn, AGR (%), CAGR(%)) (V – Shaped Recovery)
Table 6. Global Dynamic Positioning Systems Market Forecast, 2021-2031 (USD Mn, AGR (%), CAGR(%)) (W – Shaped Recovery)
Table 7. Global Dynamic Positioning Systems Market Forecast, 2021-2031 (USD Mn, AGR (%), CAGR(%)) (U – Shaped Recovery)
Table 8. Global Dynamic Positioning Systems Market Forecast, 2021-2031 (USD Mn, AGR (%), CAGR(%)) (L – Shaped Recovery)
Table 9. Global Dynamic Positioning Systems Market by Region, 2021-2031 (USD Mn, AGR (%), CAGR(%))
Table 10. Global Dynamic Positioning Systems Market by Region, 2021-2031 (USD Mn, AGR (%), CAGR(%)) (V – Shaped Recovery)
Table 11. Global Dynamic Positioning Systems Market by Region, 2021-2031 (USD Mn, AGR (%), CAGR(%)) (W – Shaped Recovery)
Table 12. Global Dynamic Positioning Systems Market by Region, 2021-2031 (USD Mn, AGR (%), CAGR(%)) (U – Shaped Recovery)
Table 13. Global Dynamic Positioning Systems Market by Region, 2021-2031 (USD Mn, AGR (%), CAGR(%)) (L – Shaped Recovery)
Table 14. Global Dynamic Positioning Systems Market by Equipment Class, 2021-2031 (USD Mn, AGR (%), CAGR(%))
Table 15. Global Dynamic Positioning Systems Market by Equipment Class, 2021-2031 (USD Mn, AGR (%), CAGR(%)) (V – Shaped Recovery)
Table 16. Global Dynamic Positioning Systems Market by Equipment Class, 2021-2031 (USD Mn, AGR (%), CAGR(%)) (W – Shaped Recovery)
Table 17. Global Dynamic Positioning Systems Market by Equipment Class, 2021-2031 (USD Mn, AGR (%), CAGR(%)) (U – Shaped Recovery)
Table 18. Global Dynamic Positioning Systems Market by Equipment Class, 2021-2031 (USD Mn, AGR (%), CAGR(%)) (L – Shaped Recovery)
Table 19. Global Dynamic Positioning Systems Market by Technology, 2021-2031 (USD Mn, AGR (%), CAGR(%))
Table 20. Global Dynamic Positioning Systems Market by Technology, 2021-2031 (USD Mn, AGR (%), CAGR(%)) (V – Shaped Recovery)
Table 21. Global Dynamic Positioning Systems Market by Technology, 2021-2031 (USD Mn, AGR (%), CAGR(%)) (W – Shaped Recovery)
Table 22. Global Dynamic Positioning Systems Market by Technology, 2021-2031 (USD Mn, AGR (%), CAGR(%)) (U – Shaped Recovery)
Table 23. Global Dynamic Positioning Systems Market by Technology, 2021-2031 (USD Mn, AGR (%), CAGR(%)) (L – Shaped Recovery)
Table 24. Global Dynamic Positioning Systems Market by Function, 2021-2031 (USD Mn, AGR (%), CAGR(%))
Table 25. Global Dynamic Positioning Systems Market by Function, 2021-2031 (USD Mn, AGR (%), CAGR(%)) (V – Shaped Recovery)
Table 26. Global Dynamic Positioning Systems Market by Function, 2021-2031 (USD Mn, AGR (%), CAGR(%)) (W – Shaped Recovery)
Table 27. Global Dynamic Positioning Systems Market by Function, 2021-2031 (USD Mn, AGR (%), CAGR(%)) (U – Shaped Recovery)
Table 28. Global Dynamic Positioning Systems Market by Function, 2021-2031 (USD Mn, AGR (%), CAGR(%)) (L – Shaped Recovery)
Table 29. Global Dynamic Positioning Systems Market by End-Use, 2021-2031 (USD Mn, AGR (%), CAGR(%))
Table 30. Global Dynamic Positioning Systems Market by End-Use, 2021-2031 (USD Mn, AGR (%), CAGR(%)) (V – Shaped Recovery)
Table 31. Global Dynamic Positioning Systems Market by End-Use, 2021-2031 (USD Mn, AGR (%), CAGR(%)) (W – Shaped Recovery)
Table 32. Global Dynamic Positioning Systems Market by End-Use, 2021-2031 (USD Mn, AGR (%), CAGR(%)) (U – Shaped Recovery)
Table 33. Global Dynamic Positioning Systems Market by End-Use, 2021-2031 (USD Mn, AGR (%), CAGR(%)) (L – Shaped Recovery)
Table 34. Global Dynamic Positioning Systems Market by Application, 2021-2031 (USD Mn, AGR (%), CAGR(%))
Table 35. Global Dynamic Positioning Systems Market by Application, 2021-2031 (USD Mn, AGR (%), CAGR(%)) (V – Shaped Recovery)
Table 36. Global Dynamic Positioning Systems Market by Application, 2021-2031 (USD Mn, AGR (%), CAGR(%)) (W – Shaped Recovery)
Table 37. Global Dynamic Positioning Systems Market by Application, 2021-2031 (USD Mn, AGR (%), CAGR(%)) (U – Shaped Recovery)
Table 38. Global Dynamic Positioning Systems Market by Application, 2021-2031 (USD Mn, AGR (%), CAGR(%)) (L – Shaped Recovery)
Table 39. North America Dynamic Positioning Systems Market by Value, 2021-2031 (USD Mn, AGR (%), CAGR(%))
Table 40. North America Dynamic Positioning Systems Market by Value, 2021-2031 (USD Mn, AGR (%), CAGR(%)) (V – Shaped Recovery)
Table 41. North America Dynamic Positioning Systems Market by Value, 2021-2031 (USD Mn, AGR (%), CAGR(%)) (W – Shaped Recovery)
Table 42. North America Dynamic Positioning Systems Market by Value, 2021-2031 (USD Mn, AGR (%), CAGR(%)) (U – Shaped Recovery)
Table 43. North America Dynamic Positioning Systems Market by Value, 2021-2031 (USD Mn, AGR (%), CAGR(%)) (L – Shaped Recovery)
Table 44. North America Dynamic Positioning Systems Market by Country, 2021-2031 (USD Mn, AGR (%), CAGR(%))
Table 45. North America Dynamic Positioning Systems Market by Country, 2021-2031 (USD Mn, AGR (%), CAGR(%)) (V – Shaped Recovery)
Table 46. North America Dynamic Positioning Systems Market by Country, 2021-2031 (USD Mn, AGR (%), CAGR(%)) (W – Shaped Recovery)
Table 47. North America Dynamic Positioning Systems Market by Country, 2021-2031 (USD Mn, AGR (%), CAGR(%)) (U – Shaped Recovery)
Table 48. North America Dynamic Positioning Systems Market by Country, 2021-2031 (USD Mn, AGR (%), CAGR(%)) (L – Shaped Recovery)
Table 49. North America Dynamic Positioning Systems Market by Equipment Class, 2021-2031 (USD Mn, AGR (%), CAGR(%))
Table 50. North America Dynamic Positioning Systems Market by Equipment Class, 2021-2031 (USD Mn, AGR (%), CAGR(%)) (V – Shaped Recovery)
Table 51. North America Dynamic Positioning Systems Market by Equipment Class, 2021-2031 (USD Mn, AGR (%), CAGR(%)) (W – Shaped Recovery)
Table 52. North America Dynamic Positioning Systems Market by Equipment Class, 2021-2031 (USD Mn, AGR (%), CAGR(%)) (U – Shaped Recovery)
Table 53. North America Dynamic Positioning Systems Market by Equipment Class, 2021-2031 (USD Mn, AGR (%), CAGR(%)) (L – Shaped Recovery)
Table 54. North America Dynamic Positioning Systems Market by Technology, 2021-2031 (USD Mn, AGR (%), CAGR(%))
Table 55. North America Dynamic Positioning Systems Market by Technology, 2021-2031 (USD Mn, AGR (%), CAGR(%)) (V – Shaped Recovery)
Table 56. North America Dynamic Positioning Systems Market by Technology, 2021-2031 (USD Mn, AGR (%), CAGR(%)) (W – Shaped Recovery)
Table 57. North America Dynamic Positioning Systems Market by Technology, 2021-2031 (USD Mn, AGR (%), CAGR(%)) (U – Shaped Recovery)
Table 58. North America Dynamic Positioning Systems Market by Technology, 2021-2031 (USD Mn, AGR (%), CAGR(%)) (L – Shaped Recovery)
Table 59. North America Dynamic Positioning Systems Market by Function, 2021-2031 (USD Mn, AGR (%), CAGR(%))
Table 60. North America Dynamic Positioning Systems Market by Function, 2021-2031 (USD Mn, AGR (%), CAGR(%)) (V – Shaped Recovery)
Table 61. North America Dynamic Positioning Systems Market by Function, 2021-2031 (USD Mn, AGR (%), CAGR(%)) (W – Shaped Recovery)
Table 62. North America Dynamic Positioning Systems Market by Function, 2021-2031 (USD Mn, AGR (%), CAGR(%)) (U – Shaped Recovery)
Table 63. North America Dynamic Positioning Systems Market by Function, 2021-2031 (USD Mn, AGR (%), CAGR(%)) (L – Shaped Recovery)
Table 64. North America Dynamic Positioning Systems Market by End-Use, 2021-2031 (USD Mn, AGR (%), CAGR(%))
Table 65. North America Dynamic Positioning Systems Market by End-Use, 2021-2031 (USD Mn, AGR (%), CAGR(%)) (V – Shaped Recovery)
Table 66. North America Dynamic Positioning Systems Market by End-Use, 2021-2031 (USD Mn, AGR (%), CAGR(%)) (W – Shaped Recovery)
Table 67. North America Dynamic Positioning Systems Market by End-Use, 2021-2031 (USD Mn, AGR (%), CAGR(%)) (U – Shaped Recovery)
Table 68. North America Dynamic Positioning Systems Market by End-Use, 2021-2031 (USD Mn, AGR (%), CAGR(%)) (L – Shaped Recovery)
Table 69. North America Dynamic Positioning Systems Market by Application, 2021-2031 (USD Mn, AGR (%), CAGR(%))
Table 70. North America Dynamic Positioning Systems Market by Application, 2021-2031 (USD Mn, AGR (%), CAGR(%)) (V – Shaped Recovery)
Table 71. North America Dynamic Positioning Systems Market by Application, 2021-2031 (USD Mn, AGR (%), CAGR(%)) (W – Shaped Recovery)
Table 72. North America Dynamic Positioning Systems Market by Application, 2021-2031 (USD Mn, AGR (%), CAGR(%)) (U – Shaped Recovery)
Table 73. North America Dynamic Positioning Systems Market by Application, 2021-2031 (USD Mn, AGR (%), CAGR(%)) (L – Shaped Recovery)
Table 74. US Dynamic Positioning Systems Market by Value, 2021-2031 (USD Mn, AGR (%), CAGR(%))
Table 75. US Dynamic Positioning Systems Market by Value, 2021-2031 (USD Mn, AGR (%), CAGR(%)) (V – Shaped Recovery)
Table 76. US Dynamic Positioning Systems Market by Value, 2021-2031 (USD Mn, AGR (%), CAGR(%)) (W – Shaped Recovery)
Table 77. US Dynamic Positioning Systems Market by Value, 2021-2031 (USD Mn, AGR (%), CAGR(%)) (U – Shaped Recovery)
Table 78. US Dynamic Positioning Systems Market by Value, 2021-2031 (USD Mn, AGR (%), CAGR(%)) (L – Shaped Recovery)
Table 79. Canada Dynamic Positioning Systems Market by Value, 2021-2031 (USD Mn, AGR (%), CAGR(%))
Table 80. Canada Dynamic Positioning Systems Market by Value, 2021-2031 (USD Mn, AGR (%), CAGR(%)) (V – Shaped Recovery)
Table 81. Canada Dynamic Positioning Systems Market by Value, 2021-2031 (USD Mn, AGR (%), CAGR(%)) (W – Shaped Recovery)
Table 82. Canada Dynamic Positioning Systems Market by Value, 2021-2031 (USD Mn, AGR (%), CAGR(%)) (U – Shaped Recovery)
Table 83. Canada Dynamic Positioning Systems Market by Value, 2021-2031 (USD Mn, AGR (%), CAGR(%)) (L – Shaped Recovery)
Table 84. Mexico Dynamic Positioning Systems Market by Value, 2021-2031 (USD Mn, AGR (%), CAGR(%))
Table 85. Mexico Dynamic Positioning Systems Market by Value, 2021-2031 (USD Mn, AGR (%), CAGR(%)) (V – Shaped Recovery)
Table 86. Mexico Dynamic Positioning Systems Market by Value, 2021-2031 (USD Mn, AGR (%), CAGR(%)) (W – Shaped Recovery)
Table 87. Mexico Dynamic Positioning Systems Market by Value, 2021-2031 (USD Mn, AGR (%), CAGR(%)) (U – Shaped Recovery)
Table 88. Mexico Dynamic Positioning Systems Market by Value, 2021-2031 (USD Mn, AGR (%), CAGR(%)) (L – Shaped Recovery)
Table 89. Europe Dynamic Positioning Systems Market by Value, 2021-2031 (USD Mn, AGR (%), CAGR(%))
Table 90. Europe Dynamic Positioning Systems Market by Value, 2021-2031 (USD Mn, AGR (%), CAGR(%)) (V – Shaped Recovery)
Table 91. Europe Dynamic Positioning Systems Market by Value, 2021-2031 (USD Mn, AGR (%), CAGR(%)) (W – Shaped Recovery)
Table 92. Europe Dynamic Positioning Systems Market by Value, 2021-2031 (USD Mn, AGR (%), CAGR(%)) (U – Shaped Recovery)
Table 93. Europe Dynamic Positioning Systems Market by Value, 2021-2031 (USD Mn, AGR (%), CAGR(%)) (L – Shaped Recovery)
Table 94. Europe Dynamic Positioning Systems Market by Country, 2021-2031 (USD Mn, AGR (%), CAGR(%))
Table 95. Europe Dynamic Positioning Systems Market by Country, 2021-2031 (USD Mn, AGR (%), CAGR(%)) (V – Shaped Recovery)
Table 96. Europe Dynamic Positioning Systems Market by Country, 2021-2031 (USD Mn, AGR (%), CAGR(%)) (W – Shaped Recovery)
Table 97. Europe Dynamic Positioning Systems Market by Country, 2021-2031 (USD Mn, AGR (%), CAGR(%)) (U – Shaped Recovery)
Table 98. Europe Dynamic Positioning Systems Market by Country, 2021-2031 (USD Mn, AGR (%), CAGR(%)) (L – Shaped Recovery)
Table 99. Europe Dynamic Positioning Systems Market by Equipment Class, 2021-2031 (USD Mn, AGR (%), CAGR(%))
Table 100. Europe Dynamic Positioning Systems Market by Equipment Class, 2021-2031 (USD Mn, AGR (%), CAGR(%)) (V – Shaped Recovery)
Table 101. Europe Dynamic Positioning Systems Market by Equipment Class, 2021-2031 (USD Mn, AGR (%), CAGR(%)) (W – Shaped Recovery)
Table 102. Europe Dynamic Positioning Systems Market by Equipment Class, 2021-2031 (USD Mn, AGR (%), CAGR(%)) (U – Shaped Recovery)
Table 103. Europe Dynamic Positioning Systems Market by Equipment Class, 2021-2031 (USD Mn, AGR (%), CAGR(%)) (L – Shaped Recovery)
Table 104. Europe Dynamic Positioning Systems Market by Technology, 2021-2031 (USD Mn, AGR (%), CAGR(%))
Table 105. Europe Dynamic Positioning Systems Market by Technology, 2021-2031 (USD Mn, AGR (%), CAGR(%)) (V – Shaped Recovery)
Table 106. Europe Dynamic Positioning Systems Market by Technology, 2021-2031 (USD Mn, AGR (%), CAGR(%)) (W – Shaped Recovery)
Table 107. Europe Dynamic Positioning Systems Market by Technology, 2021-2031 (USD Mn, AGR (%), CAGR(%)) (U – Shaped Recovery)
Table 108. Europe Dynamic Positioning Systems Market by Technology, 2021-2031 (USD Mn, AGR (%), CAGR(%)) (L – Shaped Recovery)
Table 109. Europe Dynamic Positioning Systems Market by Function, 2021-2031 (USD Mn, AGR (%), CAGR(%))
Table 110. Europe Dynamic Positioning Systems Market by Function, 2021-2031 (USD Mn, AGR (%), CAGR(%)) (V – Shaped Recovery)
Table 111. Europe Dynamic Positioning Systems Market by Function, 2021-2031 (USD Mn, AGR (%), CAGR(%)) (W – Shaped Recovery)
Table 112. Europe Dynamic Positioning Systems Market by Function, 2021-2031 (USD Mn, AGR (%), CAGR(%)) (U – Shaped Recovery)
Table 113. Europe Dynamic Positioning Systems Market by Function, 2021-2031 (USD Mn, AGR (%), CAGR(%)) (L – Shaped Recovery)
Table 114. Europe Dynamic Positioning Systems Market by End-Use, 2021-2031 (USD Mn, AGR (%), CAGR(%))
Table 115. Europe Dynamic Positioning Systems Market by End-Use, 2021-2031 (USD Mn, AGR (%), CAGR(%)) (V – Shaped Recovery)
Table 116. Europe Dynamic Positioning Systems Market by End-Use, 2021-2031 (USD Mn, AGR (%), CAGR(%)) (W – Shaped Recovery)
Table 117. Europe Dynamic Positioning Systems Market by End-Use, 2021-2031 (USD Mn, AGR (%), CAGR(%)) (U – Shaped Recovery)
Table 118. Europe Dynamic Positioning Systems Market by End-Use, 2021-2031 (USD Mn, AGR (%), CAGR(%)) (L – Shaped Recovery)
Table 119. Europe Dynamic Positioning Systems Market by Application, 2021-2031 (USD Mn, AGR (%), CAGR(%))
Table 120. Europe Dynamic Positioning Systems Market by Application, 2021-2031 (USD Mn, AGR (%), CAGR(%)) (V – Shaped Recovery)
Table 121. Europe Dynamic Positioning Systems Market by Application, 2021-2031 (USD Mn, AGR (%), CAGR(%)) (W – Shaped Recovery)
Table 122. Europe Dynamic Positioning Systems Market by Application, 2021-2031 (USD Mn, AGR (%), CAGR(%)) (U – Shaped Recovery)
Table 123. Europe Dynamic Positioning Systems Market by Application, 2021-2031 (USD Mn, AGR (%), CAGR(%)) (L – Shaped Recovery)
Table 124. Germany Dynamic Positioning Systems Market by Value, 2021-2031 (USD Mn, AGR (%), CAGR(%))
Table 125. Germany Dynamic Positioning Systems Market by Value, 2021-2031 (USD Mn, AGR (%), CAGR(%)) (V – Shaped Recovery)
Table 126. Germany Dynamic Positioning Systems Market by Value, 2021-2031 (USD Mn, AGR (%), CAGR(%)) (W – Shaped Recovery)
Table 127. Germany Dynamic Positioning Systems Market by Value, 2021-2031 (USD Mn, AGR (%), CAGR(%)) (U – Shaped Recovery)
Table 128. Germany Dynamic Positioning Systems Market by Value, 2021-2031 (USD Mn, AGR (%), CAGR(%)) (L – Shaped Recovery)
Table 129. UK Dynamic Positioning Systems Market by Value, 2021-2031 (USD Mn, AGR (%), CAGR(%))
Table 130. UK Dynamic Positioning Systems Market by Value, 2021-2031 (USD Mn, AGR (%), CAGR(%)) (V – Shaped Recovery)
Table 131. UK Dynamic Positioning Systems Market by Value, 2021-2031 (USD Mn, AGR (%), CAGR(%)) (W – Shaped Recovery)
Table 132. UK Dynamic Positioning Systems Market by Value, 2021-2031 (USD Mn, AGR (%), CAGR(%)) (U – Shaped Recovery)
Table 133. UK Dynamic Positioning Systems Market by Value, 2021-2031 (USD Mn, AGR (%), CAGR(%)) (L – Shaped Recovery)
Table 134. France Dynamic Positioning Systems Market by Value, 2021-2031 (USD Mn, AGR (%), CAGR(%))
Table 135. France Dynamic Positioning Systems Market by Value, 2021-2031 (USD Mn, AGR (%), CAGR(%)) (V – Shaped Recovery)
Table 136. France Dynamic Positioning Systems Market by Value, 2021-2031 (USD Mn, AGR (%), CAGR(%)) (W – Shaped Recovery)
Table 137. France Dynamic Positioning Systems Market by Value, 2021-2031 (USD Mn, AGR (%), CAGR(%)) (U – Shaped Recovery)
Table 138. France Dynamic Positioning Systems Market by Value, 2021-2031 (USD Mn, AGR (%), CAGR(%)) (L – Shaped Recovery)
Table 139. Italy Dynamic Positioning Systems Market by Value, 2021-2031 (USD Mn, AGR (%), CAGR(%))
Table 140. Italy Dynamic Positioning Systems Market by Value, 2021-2031 (USD Mn, AGR (%), CAGR(%)) (V – Shaped Recovery)
Table 141. Italy Dynamic Positioning Systems Market by Value, 2021-2031 (USD Mn, AGR (%), CAGR(%)) (W – Shaped Recovery)
Table 142. Italy Dynamic Positioning Systems Market by Value, 2021-2031 (USD Mn, AGR (%), CAGR(%)) (U – Shaped Recovery)
Table 143. Italy Dynamic Positioning Systems Market by Value, 2021-2031 (USD Mn, AGR (%), CAGR(%)) (L – Shaped Recovery)
Table 144. Spain Dynamic Positioning Systems Market by Value, 2021-2031 (USD Mn, AGR (%), CAGR(%))
Table 145. Spain Dynamic Positioning Systems Market by Value, 2021-2031 (USD Mn, AGR (%), CAGR(%)) (V – Shaped Recovery)
Table 146. Spain Dynamic Positioning Systems Market by Value, 2021-2031 (USD Mn, AGR (%), CAGR(%)) (W – Shaped Recovery)
Table 147. Spain Dynamic Positioning Systems Market by Value, 2021-2031 (USD Mn, AGR (%), CAGR(%)) (U – Shaped Recovery)
Table 148. Spain Dynamic Positioning Systems Market by Value, 2021-2031 (USD Mn, AGR (%), CAGR(%)) (L – Shaped Recovery)
Table 149. Rest of Europe Dynamic Positioning Systems Market by Value, 2021-2031 (USD Mn, AGR (%), CAGR(%))
Table 150. Rest of Europe Dynamic Positioning Systems Market by Value, 2021-2031 (USD Mn, AGR (%), CAGR(%)) (V – Shaped Recovery)
Table 151. Rest of Europe Dynamic Positioning Systems Market by Value, 2021-2031 (USD Mn, AGR (%), CAGR(%)) (W – Shaped Recovery)
Table 152. Rest of Europe Dynamic Positioning Systems Market by Value, 2021-2031 (USD Mn, AGR (%), CAGR(%)) (U – Shaped Recovery)
Table 153. Rest of Europe Dynamic Positioning Systems Market by Value, 2021-2031 (USD Mn, AGR (%), CAGR(%)) (L – Shaped Recovery)
Table 154. Asia-Pacific Dynamic Positioning Systems Market by Value, 2021-2031 (USD Mn, AGR (%), CAGR(%))
Table 155. Asia-Pacific Dynamic Positioning Systems Market by Value, 2021-2031 (USD Mn, AGR (%), CAGR(%)) (V – Shaped Recovery)
Table 156. Asia-Pacific Dynamic Positioning Systems Market by Value, 2021-2031 (USD Mn, AGR (%), CAGR(%)) (W – Shaped Recovery)
Table 157. Asia-Pacific Dynamic Positioning Systems Market by Value, 2021-2031 (USD Mn, AGR (%), CAGR(%)) (U – Shaped Recovery)
Table 158. Asia-Pacific Dynamic Positioning Systems Market by Value, 2021-2031 (USD Mn, AGR (%), CAGR(%)) (L – Shaped Recovery)
Table 159. Asia-Pacific Dynamic Positioning Systems Market by Country, 2021-2031 (USD Mn, AGR (%), CAGR(%))
Table 160. Asia-Pacific Dynamic Positioning Systems Market by Country, 2021-2031 (USD Mn, AGR (%), CAGR(%)) (V – Shaped Recovery)
Table 161. Asia-Pacific Dynamic Positioning Systems Market by Country, 2021-2031 (USD Mn, AGR (%), CAGR(%)) (W – Shaped Recovery)
Table 162. Asia-Pacific Dynamic Positioning Systems Market by Country, 2021-2031 (USD Mn, AGR (%), CAGR(%)) (U – Shaped Recovery)
Table 163. Asia-Pacific Dynamic Positioning Systems Market by Country, 2021-2031 (USD Mn, AGR (%), CAGR(%)) (L – Shaped Recovery)
Table 164. Asia-Pacific Dynamic Positioning Systems Market by Equipment Class, 2021-2031 (USD Mn, AGR (%), CAGR(%))
Table 165. Asia-Pacific Dynamic Positioning Systems Market by Equipment Class, 2021-2031 (USD Mn, AGR (%), CAGR(%)) (V – Shaped Recovery)
Table 166. Asia-Pacific Dynamic Positioning Systems Market by Equipment Class, 2021-2031 (USD Mn, AGR (%), CAGR(%)) (W – Shaped Recovery)
Table 167. Asia-Pacific Dynamic Positioning Systems Market by Equipment Class, 2021-2031 (USD Mn, AGR (%), CAGR(%)) (U – Shaped Recovery)
Table 168. Asia-Pacific Dynamic Positioning Systems Market by Equipment Class, 2021-2031 (USD Mn, AGR (%), CAGR(%)) (L – Shaped Recovery)
Table 169. Asia-Pacific Dynamic Positioning Systems Market by Technology, 2021-2031 (USD Mn, AGR (%), CAGR(%))
Table 170. Asia-Pacific Dynamic Positioning Systems Market by Technology, 2021-2031 (USD Mn, AGR (%), CAGR(%)) (V – Shaped Recovery)
Table 171. Asia-Pacific Dynamic Positioning Systems Market by Technology, 2021-2031 (USD Mn, AGR (%), CAGR(%)) (W – Shaped Recovery)
Table 172. Asia-Pacific Dynamic Positioning Systems Market by Technology, 2021-2031 (USD Mn, AGR (%), CAGR(%)) (U – Shaped Recovery)
Table 173. Asia-Pacific Dynamic Positioning Systems Market by Technology, 2021-2031 (USD Mn, AGR (%), CAGR(%)) (L – Shaped Recovery)
Table 174. Asia-Pacific Dynamic Positioning Systems Market by Function, 2021-2031 (USD Mn, AGR (%), CAGR(%))
Table 175. Asia-Pacific Dynamic Positioning Systems Market by Function, 2021-2031 (USD Mn, AGR (%), CAGR(%)) (V – Shaped Recovery)
Table 176. Asia-Pacific Dynamic Positioning Systems Market by Function, 2021-2031 (USD Mn, AGR (%), CAGR(%)) (W – Shaped Recovery)
Table 177. Asia-Pacific Dynamic Positioning Systems Market by Function, 2021-2031 (USD Mn, AGR (%), CAGR(%)) (U – Shaped Recovery)
Table 178. Asia-Pacific Dynamic Positioning Systems Market by Function, 2021-2031 (USD Mn, AGR (%), CAGR(%)) (L – Shaped Recovery)
Table 179. Asia-Pacific Dynamic Positioning Systems Market by End-Use, 2021-2031 (USD Mn, AGR (%), CAGR(%))
Table 180. Asia-Pacific Dynamic Positioning Systems Market by End-Use, 2021-2031 (USD Mn, AGR (%), CAGR(%)) (V – Shaped Recovery)
Table 181. Asia-Pacific Dynamic Positioning Systems Market by End-Use, 2021-2031 (USD Mn, AGR (%), CAGR(%)) (W – Shaped Recovery)
Table 182. Asia-Pacific Dynamic Positioning Systems Market by End-Use, 2021-2031 (USD Mn, AGR (%), CAGR(%)) (U – Shaped Recovery)
Table 183. Asia-Pacific Dynamic Positioning Systems Market by End-Use, 2021-2031 (USD Mn, AGR (%), CAGR(%)) (L – Shaped Recovery)
Table 184. Asia-Pacific Dynamic Positioning Systems Market by Application, 2021-2031 (USD Mn, AGR (%), CAGR(%))
Table 185. Asia-Pacific Dynamic Positioning Systems Market by Application, 2021-2031 (USD Mn, AGR (%), CAGR(%)) (V – Shaped Recovery)
Table 186. Asia-Pacific Dynamic Positioning Systems Market by Application, 2021-2031 (USD Mn, AGR (%), CAGR(%)) (W – Shaped Recovery)
Table 187. Asia-Pacific Dynamic Positioning Systems Market by Application, 2021-2031 (USD Mn, AGR (%), CAGR(%)) (U – Shaped Recovery)
Table 188. Asia-Pacific Dynamic Positioning Systems Market by Application, 2021-2031 (USD Mn, AGR (%), CAGR(%)) (L – Shaped Recovery)
Table 189. China Dynamic Positioning Systems Market by Value, 2021-2031 (USD Mn, AGR (%), CAGR(%))
Table 190. China Dynamic Positioning Systems Market by Value, 2021-2031 (USD Mn, AGR (%), CAGR(%)) (V – Shaped Recovery)
Table 191. China Dynamic Positioning Systems Market by Value, 2021-2031 (USD Mn, AGR (%), CAGR(%)) (W – Shaped Recovery)
Table 192. China Dynamic Positioning Systems Market by Value, 2021-2031 (USD Mn, AGR (%), CAGR(%)) (U – Shaped Recovery)
Table 193. China Dynamic Positioning Systems Market by Value, 2021-2031 (USD Mn, AGR (%), CAGR(%)) (L – Shaped Recovery)
Table 194. India Dynamic Positioning Systems Market by Value, 2021-2031 (USD Mn, AGR (%), CAGR(%))
Table 195. India Dynamic Positioning Systems Market by Value, 2021-2031 (USD Mn, AGR (%), CAGR(%)) (V – Shaped Recovery)
Table 196. India Dynamic Positioning Systems Market by Value, 2021-2031 (USD Mn, AGR (%), CAGR(%)) (W – Shaped Recovery)
Table 197. India Dynamic Positioning Systems Market by Value, 2021-2031 (USD Mn, AGR (%), CAGR(%)) (U – Shaped Recovery)
Table 198. India Dynamic Positioning Systems Market by Value, 2021-2031 (USD Mn, AGR (%), CAGR(%)) (L – Shaped Recovery)
Table 199. Japan Dynamic Positioning Systems Market by Value, 2021-2031 (USD Mn, AGR (%), CAGR(%))
Table 200. Japan Dynamic Positioning Systems Market by Value, 2021-2031 (USD Mn, AGR (%), CAGR(%)) (V – Shaped Recovery)
Table 201. Japan Dynamic Positioning Systems Market by Value, 2021-2031 (USD Mn, AGR (%), CAGR(%)) (W – Shaped Recovery)
Table 202. Japan Dynamic Positioning Systems Market by Value, 2021-2031 (USD Mn, AGR (%), CAGR(%)) (U – Shaped Recovery)
Table 203. Japan Dynamic Positioning Systems Market by Value, 2021-2031 (USD Mn, AGR (%), CAGR(%)) (L – Shaped Recovery)
Table 204. South Korea Dynamic Positioning Systems Market by Value, 2021-2031 (USD Mn, AGR (%), CAGR(%))
Table 205. South Korea Dynamic Positioning Systems Market by Value, 2021-2031 (USD Mn, AGR (%), CAGR(%)) (V – Shaped Recovery)
Table 206. South Korea Dynamic Positioning Systems Market by Value, 2021-2031 (USD Mn, AGR (%), CAGR(%)) (W – Shaped Recovery)
Table 207. South Korea Dynamic Positioning Systems Market by Value, 2021-2031 (USD Mn, AGR (%), CAGR(%)) (U – Shaped Recovery)
Table 208. South Korea Dynamic Positioning Systems Market by Value, 2021-2031 (USD Mn, AGR (%), CAGR(%)) (L – Shaped Recovery)
Table 209. Australia Dynamic Positioning Systems Market by Value, 2021-2031 (USD Mn, AGR (%), CAGR(%))
Table 210. Australia Dynamic Positioning Systems Market by Value, 2021-2031 (USD Mn, AGR (%), CAGR(%)) (V – Shaped Recovery)
Table 211. Australia Dynamic Positioning Systems Market by Value, 2021-2031 (USD Mn, AGR (%), CAGR(%)) (W – Shaped Recovery)
Table 212. Australia Dynamic Positioning Systems Market by Value, 2021-2031 (USD Mn, AGR (%), CAGR(%)) (U – Shaped Recovery)
Table 213. Australia Dynamic Positioning Systems Market by Value, 2021-2031 (USD Mn, AGR (%), CAGR(%)) (L – Shaped Recovery)
Table 214. Rest of Asia-Pacific Dynamic Positioning Systems Market by Value, 2021-2031 (USD Mn, AGR (%), CAGR(%))
Table 215. Rest of Asia-Pacific Dynamic Positioning Systems Market by Value, 2021-2031 (USD Mn, AGR (%), CAGR(%)) (V – Shaped Recovery)
Table 216. Rest of Asia-Pacific Dynamic Positioning Systems Market by Value, 2021-2031 (USD Mn, AGR (%), CAGR(%)) (W – Shaped Recovery)
Table 217. Rest of Asia-Pacific Dynamic Positioning Systems Market by Value, 2021-2031 (USD Mn, AGR (%), CAGR(%)) (U – Shaped Recovery)
Table 218. Rest of Asia-Pacific Dynamic Positioning Systems Market by Value, 2021-2031 (USD Mn, AGR (%), CAGR(%)) (L – Shaped Recovery)
Table 219. LAMEA Dynamic Positioning Systems Market by Value, 2021-2031 (USD Mn, AGR (%), CAGR(%))
Table 220. LAMEA Dynamic Positioning Systems Market by Value, 2021-2031 (USD Mn, AGR (%), CAGR(%)) (V – Shaped Recovery)
Table 221. LAMEA Dynamic Positioning Systems Market by Value, 2021-2031 (USD Mn, AGR (%), CAGR(%)) (W – Shaped Recovery)
Table 222. LAMEA Dynamic Positioning Systems Market by Value, 2021-2031 (USD Mn, AGR (%), CAGR(%)) (U – Shaped Recovery)
Table 223. LAMEA Dynamic Positioning Systems Market by Value, 2021-2031 (USD Mn, AGR (%), CAGR(%)) (L – Shaped Recovery)
Table 224. LAMEA Dynamic Positioning Systems Market by Country, 2021-2031 (USD Mn, AGR (%), CAGR(%))
Table 225. LAMEA Dynamic Positioning Systems Market by Country, 2021-2031 (USD Mn, AGR (%), CAGR(%)) (V – Shaped Recovery)
Table 226. LAMEA Dynamic Positioning Systems Market by Country, 2021-2031 (USD Mn, AGR (%), CAGR(%)) (W – Shaped Recovery)
Table 227. LAMEA Dynamic Positioning Systems Market by Country, 2021-2031 (USD Mn, AGR (%), CAGR(%)) (U – Shaped Recovery)
Table 228. LAMEA Dynamic Positioning Systems Market by Country, 2021-2031 (USD Mn, AGR (%), CAGR(%)) (L – Shaped Recovery)
Table 229. LAMEA Dynamic Positioning Systems Market by Equipment Class, 2021-2031 (USD Mn, AGR (%), CAGR(%))
Table 230. LAMEA Dynamic Positioning Systems Market by Equipment Class, 2021-2031 (USD Mn, AGR (%), CAGR(%)) (V – Shaped Recovery)
Table 231. LAMEA Dynamic Positioning Systems Market by Equipment Class, 2021-2031 (USD Mn, AGR (%), CAGR(%)) (W – Shaped Recovery)
Table 232. LAMEA Dynamic Positioning Systems Market by Equipment Class, 2021-2031 (USD Mn, AGR (%), CAGR(%)) (U – Shaped Recovery)
Table 233. LAMEA Dynamic Positioning Systems Market by Equipment Class, 2021-2031 (USD Mn, AGR (%), CAGR(%)) (L – Shaped Recovery)
Table 234. LAMEA Dynamic Positioning Systems Market by Technology, 2021-2031 (USD Mn, AGR (%), CAGR(%))
Table 235. LAMEA Dynamic Positioning Systems Market by Technology, 2021-2031 (USD Mn, AGR (%), CAGR(%)) (V – Shaped Recovery)
Table 236. LAMEA Dynamic Positioning Systems Market by Technology, 2021-2031 (USD Mn, AGR (%), CAGR(%)) (W – Shaped Recovery)
Table 237. LAMEA Dynamic Positioning Systems Market by Technology, 2021-2031 (USD Mn, AGR (%), CAGR(%)) (U – Shaped Recovery)
Table 238. LAMEA Dynamic Positioning Systems Market by Technology, 2021-2031 (USD Mn, AGR (%), CAGR(%)) (L – Shaped Recovery)
Table 239. LAMEA Dynamic Positioning Systems Market by Function, 2021-2031 (USD Mn, AGR (%), CAGR(%))
Table 240. LAMEA Dynamic Positioning Systems Market by Function, 2021-2031 (USD Mn, AGR (%), CAGR(%)) (V – Shaped Recovery)
Table 241. LAMEA Dynamic Positioning Systems Market by Function, 2021-2031 (USD Mn, AGR (%), CAGR(%)) (W – Shaped Recovery)
Table 242. LAMEA Dynamic Positioning Systems Market by Function, 2021-2031 (USD Mn, AGR (%), CAGR(%)) (U – Shaped Recovery)
Table 243. LAMEA Dynamic Positioning Systems Market by Function, 2021-2031 (USD Mn, AGR (%), CAGR(%)) (L – Shaped Recovery)
Table 244. LAMEA Dynamic Positioning Systems Market by End-Use, 2021-2031 (USD Mn, AGR (%), CAGR(%))
Table 245. LAMEA Dynamic Positioning Systems Market by End-Use, 2021-2031 (USD Mn, AGR (%), CAGR(%)) (V – Shaped Recovery)
Table 246. LAMEA Dynamic Positioning Systems Market by End-Use, 2021-2031 (USD Mn, AGR (%), CAGR(%)) (W – Shaped Recovery)
Table 247. LAMEA Dynamic Positioning Systems Market by End-Use, 2021-2031 (USD Mn, AGR (%), CAGR(%)) (U – Shaped Recovery)
Table 248. LAMEA Dynamic Positioning Systems Market by End-Use, 2021-2031 (USD Mn, AGR (%), CAGR(%)) (L – Shaped Recovery)
Table 249. LAMEA Dynamic Positioning Systems Market by Application, 2021-2031 (USD Mn, AGR (%), CAGR(%))
Table 250. LAMEA Dynamic Positioning Systems Market by Application, 2021-2031 (USD Mn, AGR (%), CAGR(%)) (V – Shaped Recovery)
Table 251. LAMEA Dynamic Positioning Systems Market by Application, 2021-2031 (USD Mn, AGR (%), CAGR(%)) (W – Shaped Recovery)
Table 252. LAMEA Dynamic Positioning Systems Market by Application, 2021-2031 (USD Mn, AGR (%), CAGR(%)) (U – Shaped Recovery)
Table 253. LAMEA Dynamic Positioning Systems Market by Application, 2021-2031 (USD Mn, AGR (%), CAGR(%)) (L – Shaped Recovery)
Table 254. Brazil Dynamic Positioning Systems Market by Value, 2021-2031 (USD Mn, AGR (%), CAGR(%))
Table 255. Brazil Dynamic Positioning Systems Market by Value, 2021-2031 (USD Mn, AGR (%), CAGR(%)) (V – Shaped Recovery)
Table 256. Brazil Dynamic Positioning Systems Market by Value, 2021-2031 (USD Mn, AGR (%), CAGR(%)) (W – Shaped Recovery)
Table 257. Brazil Dynamic Positioning Systems Market by Value, 2021-2031 (USD Mn, AGR (%), CAGR(%)) (U – Shaped Recovery)
Table 258. Brazil Dynamic Positioning Systems Market by Value, 2021-2031 (USD Mn, AGR (%), CAGR(%)) (L – Shaped Recovery)
Table 259. South Africa Dynamic Positioning Systems Market by Value, 2021-2031 (USD Mn, AGR (%), CAGR(%))
Table 260. South Africa Dynamic Positioning Systems Market by Value, 2021-2031 (USD Mn, AGR (%), CAGR(%)) (V – Shaped Recovery)
Table 261. South Africa Dynamic Positioning Systems Market by Value, 2021-2031 (USD Mn, AGR (%), CAGR(%)) (W – Shaped Recovery)
Table 262. South Africa Dynamic Positioning Systems Market by Value, 2021-2031 (USD Mn, AGR (%), CAGR(%)) (U – Shaped Recovery)
Table 263. South Africa Dynamic Positioning Systems Market by Value, 2021-2031 (USD Mn, AGR (%), CAGR(%)) (L – Shaped Recovery)
Table 264. Saudi Arabia Dynamic Positioning Systems Market by Value, 2021-2031 (USD Mn, AGR (%), CAGR(%))
Table 265. Saudi Arabia Dynamic Positioning Systems Market by Value, 2021-2031 (USD Mn, AGR (%), CAGR(%)) (V – Shaped Recovery)
Table 266. Saudi Arabia Dynamic Positioning Systems Market by Value, 2021-2031 (USD Mn, AGR (%), CAGR(%)) (W – Shaped Recovery)
Table 267. Saudi Arabia Dynamic Positioning Systems Market by Value, 2021-2031 (USD Mn, AGR (%), CAGR(%)) (U – Shaped Recovery)
Table 268. Saudi Arabia Dynamic Positioning Systems Market by Value, 2021-2031 (USD Mn, AGR (%), CAGR(%)) (L – Shaped Recovery)
Table 269. Turkey Dynamic Positioning Systems Market by Value, 2021-2031 (USD Mn, AGR (%), CAGR(%))
Table 270. Turkey Dynamic Positioning Systems Market by Value, 2021-2031 (USD Mn, AGR (%), CAGR(%)) (V – Shaped Recovery)
Table 271. Turkey Dynamic Positioning Systems Market by Value, 2021-2031 (USD Mn, AGR (%), CAGR(%)) (W – Shaped Recovery)
Table 272. Turkey Dynamic Positioning Systems Market by Value, 2021-2031 (USD Mn, AGR (%), CAGR(%)) (U – Shaped Recovery)
Table 273. Turkey Dynamic Positioning Systems Market by Value, 2021-2031 (USD Mn, AGR (%), CAGR(%)) (L – Shaped Recovery)
Table 274. UAE Dynamic Positioning Systems Market by Value, 2021-2031 (USD Mn, AGR (%), CAGR(%))
Table 275. UAE Dynamic Positioning Systems Market by Value, 2021-2031 (USD Mn, AGR (%), CAGR(%)) (V – Shaped Recovery)
Table 276. UAE Dynamic Positioning Systems Market by Value, 2021-2031 (USD Mn, AGR (%), CAGR(%)) (W – Shaped Recovery)
Table 277. UAE Dynamic Positioning Systems Market by Value, 2021-2031 (USD Mn, AGR (%), CAGR(%)) (U – Shaped Recovery)
Table 278. UAE Dynamic Positioning Systems Market by Value, 2021-2031 (USD Mn, AGR (%), CAGR(%)) (L – Shaped Recovery)
Table 279. Rest of LAMEA Dynamic Positioning Systems Market by Value, 2021-2031 (USD Mn, AGR (%), CAGR(%))
Table 280. Rest of LAMEA Dynamic Positioning Systems Market by Value, 2021-2031 (USD Mn, AGR (%), CAGR(%)) (V – Shaped Recovery)
Table 281. Rest of LAMEA Dynamic Positioning Systems Market by Value, 2021-2031 (USD Mn, AGR (%), CAGR(%)) (W – Shaped Recovery)
Table 282. Rest of LAMEA Dynamic Positioning Systems Market by Value, 2021-2031 (USD Mn, AGR (%), CAGR(%)) (U – Shaped Recovery)
Table 283. Rest of LAMEA Dynamic Positioning Systems Market by Value, 2021-2031 (USD Mn, AGR (%), CAGR(%)) (L – Shaped Recovery)
Table 284. Kongsberg Gruppen Asa: Company Information
Table 285. Kongsberg Gruppen Asa: Company Revenue 2016-2020 (US$Mn, AGR %)
Table 286. Kongsberg Gruppen Asa: Company Product and Service Benchmarking
Table 287. Kongsberg Gruppen Asa: Company Recent Developments till Feb,2021
Table 288. Abb Group: Company Information
Table 289. Abb Group: Company Revenue 2016-2020 (US$Mn, AGR %)
Table 290. Abb Group: Company Product and Service Benchmarking
Table 291. Abb Group: Company Recent Developments till Feb,2021
Table 292. General Electric Company: Company Information
Table 293. General Electric Company: Company Revenue 2016-2020 (US$Mn, AGR %)
Table 294. General Electric Company: Company Product and Service Benchmarking
Table 295. General Electric Company: Company Recent Developments till Feb,2021
Table 296. Wartsila Oyj Abp: Company Information
Table 297. Wartsila Oyj Abp: Company Revenue 2016-2020 (US$Mn, AGR %)
Table 298. Wartsila Oyj Abp: Company Product and Service Benchmarking
Table 299. Wartsila Oyj Abp: Company Recent Developments till Feb,2021
Table 300. Rolls-Royce Plc.: Company Information
Table 301. Rolls-Royce Plc.: Company Revenue 2016-2020 (US$Mn, AGR %)
Table 302. Rolls-Royce Plc.: Company Product and Service Benchmarking
Table 303. Rolls-Royce Plc.: Company Recent Developments till Feb,2021
Table 304. A.B. Volvo: Company Information
Table 305. A.B. Volvo: Company Revenue 2016-2020 (US$Mn, AGR %)
Table 306. A.B. Volvo: Company Product and Service Benchmarking
Table 307. Twin Disc: Company Information
Table 308. Twin Disc: Company Revenue 2016-2020 (US$Mn, AGR %)
Table 309. Twin Disc: Company Product and Service Benchmarking
Table 310. L3harris Technologies Inc.: Company Information
Table 311. L3harris Technologies Inc.: Company Revenue 2017-2021 (US$Mn, AGR %)
Table 312. L3harris Technologies Inc.: Company Product and Service Benchmarking
Table 313. Praxis Automation Technology : Company Information
Table 314. Praxis Automation Technology : Company Product and Service Benchmarking
Table 315. Praxis Automation Technology : Company Recent Developments till Feb,2021
Table 316. Moxa Inc.: Company Information
Table 317. Moxa Inc.: Company Product and Service Benchmarking
Table 318. Moxa Inc.: Company Recent Developments till Feb,2021
Table 319. Sonardyne: Company Information
Table 320. Sonardyne: Company Product and Service Benchmarking
Table 321. Sonardyne: Company Recent Developments till Feb,2021
Table 322. Xenta Systems : Company Information
Table 323. Xenta Systems : Company Product and Service Benchmarking
Table 324. Xenta Systems : Company Recent Developments till Feb,2021
Table 325. Thrustmaster of Texas: Company Information
Table 326. Thrustmaster of Texas: Company Product and Service Benchmarking
Table 327. Thrustmaster of Texas: Company Recent Developments till Feb,2021
Table 328. Royal IHC: Company Information
Table 329. Royal IHC: Company Product and Service Benchmarking
Table 330. Royal IHC: Company Recent Developments till Feb,2021
Table 331. Reygar: Company Information
Table 332. Reygar: Company Product and Service Benchmarking
Table 333. Reygar: Company Recent Developments till Feb,2021
Table 334. RH Marine: Company Information
Table 335. RH Marine: Company Product and Service Benchmarking
Table 336. RH Marine: Company Recent Developments till Feb,2021
Table 337. Marine Technologies plc: Company Information
Table 338. Marine Technologies plc: Company Product and Service Benchmarking
Table 339. Raytheon Anschutz: Company Information
Table 340. Raytheon Anschutz: Company Product and Service Benchmarking
List of Figures
Figure 1. Global Dynamic Positioning Systems Market by Value, 2021-2031 (USD Mn, AGR (%), CAGR (%))
Figure 2. Global Dynamic Positioning Systems Market Segmentation
Figure 3. Global Dynamic Positioning Systems Market Trends :
Figure 4. Global Dynamic Positioning Systems Market by Value, 2021-2031 (USD Mn, AGR (%), CAGR (%))
Figure 5. Global Dynamic Positioning Systems Market by Value, 2021-2031 (USD Mn, AGR (%), CAGR (%)) (V – Shaped Recovery)
Figure 6. Global Dynamic Positioning Systems Market by Value, 2021-2031 (USD Mn, AGR (%), CAGR (%)) (W – Shaped Recovery)
Figure 7. Global Dynamic Positioning Systems Market by Value, 2021-2031 (USD Mn, AGR (%), CAGR (%)) (U – Shaped Recovery)
Figure 8. Global Dynamic Positioning Systems Market by Value, 2021-2031 (USD Mn, AGR (%), CAGR (%)) (L – Shaped Recovery)
Figure 9. Global Dynamic Positioning Systems Market Share Forecast by Region 2021, 2026, 2031 (%)
Figure 10. Global Dynamic Positioning Systems Market by Region, 2021-2031 (USD Mn, AGR (%), CAGR (%))
Figure 11. Global Dynamic Positioning Systems Market by Region, 2021-2031 (USD Mn, AGR (%), CAGR(%)) (V – Shaped Recovery)
Figure 12. Global Dynamic Positioning Systems Market by Region, 2021-2031 (USD Mn, AGR (%), CAGR(%)) (W – Shaped Recovery)
Figure 13. Global Dynamic Positioning Systems Market by Region, 2021-2031 (USD Mn, AGR (%), CAGR(%)) (U – Shaped Recovery)
Figure 14. Global Dynamic Positioning Systems Market by Region, 2021-2031 (USD Mn, AGR (%), CAGR(%)) (L – Shaped Recovery)
Figure 15. Global Dynamic Positioning Systems Market Share Forecast by Equipment Class 2021, 2026, 2031 (%)
Figure 16. Global Dynamic Positioning Systems Market by Equipment Class, 2021-2031 (USD Mn, AGR (%), CAGR (%))
Figure 17. Global Dynamic Positioning Systems Market by Equipment Class, 2021-2031 (USD Mn, AGR (%), CAGR (%)) (V – Shaped Recovery)
Figure 18. Global Dynamic Positioning Systems Market by Equipment Class, 2021-2031 (USD Mn, AGR (%), CAGR (%)) (W – Shaped Recovery)
Figure 19. Global Dynamic Positioning Systems Market by Equipment Class, 2021-2031 (USD Mn, AGR (%), CAGR (%)) (U – Shaped Recovery)
Figure 20. Global Dynamic Positioning Systems Market by Equipment Class, 2021-2031 (USD Mn, AGR (%), CAGR (%)) (L – Shaped Recovery)
Figure 21. Global Dynamic Positioning Systems Market Share Forecast by Technology 2021, 2026, 2031 (%)
Figure 22. Global Dynamic Positioning Systems Market Technology, 2021-2031 (USD Mn, AGR (%), CAGR (%))
Figure 23. Global Dynamic Positioning Systems Market Technology, 2021-2031 (USD Mn, AGR (%), CAGR (%)) (V – Shaped Recovery)
Figure 24. Global Dynamic Positioning Systems Market Technology, 2021-2031 (USD Mn, AGR (%), CAGR (%)) (W – Shaped Recovery)
Figure 25. Global Dynamic Positioning Systems Market Technology, 2021-2031 (USD Mn, AGR (%), CAGR (%)) (U – Shaped Recovery)
Figure 26. Global Dynamic Positioning Systems Market Technology, 2021-2031 (USD Mn, AGR (%), CAGR (%)) (L – Shaped Recovery)
Figure 27. Global Dynamic Positioning Systems Market Share Forecast by Function 2021, 2026, 2031 (%)
Figure 28. Global Dynamic Positioning Systems Market Function, 2021-2031 (USD Mn, AGR (%), CAGR (%))
Figure 29. Global Dynamic Positioning Systems Market Function, 2021-2031 (USD Mn, AGR (%), CAGR (%)) (V – Shaped Recovery)
Figure 30. Global Dynamic Positioning Systems Market Function, 2021-2031 (USD Mn, AGR (%), CAGR (%)) (W – Shaped Recovery)
Figure 31. Global Dynamic Positioning Systems Market Function, 2021-2031 (USD Mn, AGR (%), CAGR (%)) (U – Shaped Recovery)
Figure 32. Global Dynamic Positioning Systems Market Function, 2021-2031 (USD Mn, AGR (%), CAGR (%)) (L – Shaped Recovery)
Figure 33. Global Dynamic Positioning Systems Market Share Forecast by End-Use 2021, 2026, 2031 (%)
Figure 34. Global Dynamic Positioning Systems Market End-Use, 2021-2031 (USD Mn, AGR (%), CAGR (%))
Figure 35. Global Dynamic Positioning Systems Market End-Use, 2021-2031 (USD Mn, AGR (%), CAGR (%)) (V – Shaped Recovery)
Figure 36. Global Dynamic Positioning Systems Market End-Use, 2021-2031 (USD Mn, AGR (%), CAGR (%)) (W – Shaped Recovery)
Figure 37. Global Dynamic Positioning Systems Market End-Use, 2021-2031 (USD Mn, AGR (%), CAGR (%)) (U – Shaped Recovery)
Figure 38. Global Dynamic Positioning Systems Market End-Use, 2021-2031 (USD Mn, AGR (%), CAGR (%)) (L – Shaped Recovery)
Figure 39. Global Dynamic Positioning Systems Market Share Forecast by Application 2021, 2026, 2031 (%)
Figure 40. Global Dynamic Positioning Systems Market Application, 2021-2031 (USD Mn, AGR (%), CAGR (%))
Figure 41. Global Dynamic Positioning Systems Market Application, 2021-2031 (USD Mn, AGR (%), CAGR (%)) (V – Shaped Recovery)
Figure 42. Global Dynamic Positioning Systems Market Application, 2021-2031 (USD Mn, AGR (%), CAGR (%)) (W – Shaped Recovery)
Figure 43. Global Dynamic Positioning Systems Market Application, 2021-2031 (USD Mn, AGR (%), CAGR (%)) (U – Shaped Recovery)
Figure 44. Global Dynamic Positioning Systems Market Application, 2021-2031 (USD Mn, AGR (%), CAGR (%)) (L – Shaped Recovery)
Figure 45. North America Dynamic Positioning Systems Market by Value, 2021-2031 (USD Mn, AGR (%), CAGR (%))
Figure 46. North America Dynamic Positioning Systems Market by Value, 2021-2031 (USD Mn, AGR (%), CAGR (%)) (V – Shaped Recovery)
Figure 47. North America Dynamic Positioning Systems Market by Value, 2021-2031 (USD Mn, AGR (%), CAGR (%)) (W – Shaped Recovery)
Figure 48. North America Dynamic Positioning Systems Market by Value, 2021-2031 (USD Mn, AGR (%), CAGR (%)) (U – Shaped Recovery)
Figure 49. North America Dynamic Positioning Systems Market by Value, 2021-2031 (USD Mn, AGR (%), CAGR (%)) (L – Shaped Recovery)
Figure 50. North America Dynamic Positioning Systems Market by Country, 2021-2031 (USD Mn, AGR (%), CAGR (%))
Figure 51. North America Dynamic Positioning Systems Market by Country, 2021-2031 (USD Mn, AGR (%), CAGR(%)) (V – Shaped Recovery)
Figure 52. North America Dynamic Positioning Systems Market by Country, 2021-2031 (USD Mn, AGR (%), CAGR(%)) (W – Shaped Recovery)
Figure 53. North America Dynamic Positioning Systems Market by Country, 2021-2031 (USD Mn, AGR (%), CAGR(%)) (U – Shaped Recovery)
Figure 54. North America Dynamic Positioning Systems Market by Country, 2021-2031 (USD Mn, AGR (%), CAGR(%)) (L – Shaped Recovery)
Figure 55. North America Dynamic Positioning Systems Market by Equipment Class, 2021-2031 (USD Mn, AGR (%), CAGR (%))
Figure 56. North America Dynamic Positioning Systems Market by Equipment Class, 2021-2031 (USD Mn, AGR (%), CAGR (%)) (V – Shaped Recovery)
Figure 57. North America Dynamic Positioning Systems Market by Equipment Class, 2021-2031 (USD Mn, AGR (%), CAGR (%)) (W – Shaped Recovery)
Figure 58. North America Dynamic Positioning Systems Market by Equipment Class, 2021-2031 (USD Mn, AGR (%), CAGR (%)) (U – Shaped Recovery)
Figure 59. North America Dynamic Positioning Systems Market by Equipment Class, 2021-2031 (USD Mn, AGR (%), CAGR (%)) (L – Shaped Recovery)
Figure 60. North America Dynamic Positioning Systems Market Technology, 2021-2031 (USD Mn, AGR (%), CAGR (%))
Figure 61. North America Dynamic Positioning Systems Market Technology, 2021-2031 (USD Mn, AGR (%), CAGR (%)) (V – Shaped Recovery)
Figure 62. North America Dynamic Positioning Systems Market Technology, 2021-2031 (USD Mn, AGR (%), CAGR (%)) (W – Shaped Recovery)
Figure 63. North America Dynamic Positioning Systems Market Technology, 2021-2031 (USD Mn, AGR (%), CAGR (%)) (U – Shaped Recovery)
Figure 64. North America Dynamic Positioning Systems Market Technology, 2021-2031 (USD Mn, AGR (%), CAGR (%)) (L – Shaped Recovery)
Figure 65. North America Dynamic Positioning Systems Market Function, 2021-2031 (USD Mn, AGR (%), CAGR (%))
Figure 66. North America Dynamic Positioning Systems Market Function, 2021-2031 (USD Mn, AGR (%), CAGR (%)) (V – Shaped Recovery)
Figure 67. North America Dynamic Positioning Systems Market Function, 2021-2031 (USD Mn, AGR (%), CAGR (%)) (W – Shaped Recovery)
Figure 68. North America Dynamic Positioning Systems Market Function, 2021-2031 (USD Mn, AGR (%), CAGR (%)) (U – Shaped Recovery)
Figure 69. North America Dynamic Positioning Systems Market Function, 2021-2031 (USD Mn, AGR (%), CAGR (%)) (L – Shaped Recovery)
Figure 70. North America Dynamic Positioning Systems Market End-Use, 2021-2031 (USD Mn, AGR (%), CAGR (%))
Figure 71. North America Dynamic Positioning Systems Market End-Use, 2021-2031 (USD Mn, AGR (%), CAGR (%)) (V – Shaped Recovery)
Figure 72. North America Dynamic Positioning Systems Market End-Use, 2021-2031 (USD Mn, AGR (%), CAGR (%)) (W – Shaped Recovery)
Figure 73. North America Dynamic Positioning Systems Market End-Use, 2021-2031 (USD Mn, AGR (%), CAGR (%)) (U – Shaped Recovery)
Figure 74. North America Dynamic Positioning Systems Market End-Use, 2021-2031 (USD Mn, AGR (%), CAGR (%)) (L – Shaped Recovery)
Figure 75. North America Dynamic Positioning Systems Market Application, 2021-2031 (USD Mn, AGR (%), CAGR (%))
Figure 76. North America Dynamic Positioning Systems Market Application, 2021-2031 (USD Mn, AGR (%), CAGR (%)) (V – Shaped Recovery)
Figure 77. North America Dynamic Positioning Systems Market Application, 2021-2031 (USD Mn, AGR (%), CAGR (%)) (W – Shaped Recovery)
Figure 78. North America Dynamic Positioning Systems Market Application, 2021-2031 (USD Mn, AGR (%), CAGR (%)) (U – Shaped Recovery)
Figure 79. North America Dynamic Positioning Systems Market Application, 2021-2031 (USD Mn, AGR (%), CAGR (%)) (L – Shaped Recovery)
Figure 80. US Dynamic Positioning Systems Market by Value, 2021-2031 (USD Mn, AGR (%), CAGR (%))
Figure 81. US Dynamic Positioning Systems Market by Value, 2021-2031 (USD Mn, AGR (%), CAGR (%)) (V – Shaped Recovery)
Figure 82. US Dynamic Positioning Systems Market by Value, 2021-2031 (USD Mn, AGR (%), CAGR (%)) (W – Shaped Recovery)
Figure 83. US Dynamic Positioning Systems Market by Value, 2021-2031 (USD Mn, AGR (%), CAGR (%)) (U – Shaped Recovery)
Figure 84. US Dynamic Positioning Systems Market by Value, 2021-2031 (USD Mn, AGR (%), CAGR (%)) (L – Shaped Recovery)
Figure 85. Canada Dynamic Positioning Systems Market by Value, 2021-2031 (USD Mn, AGR (%), CAGR (%))
Figure 86. Canada Dynamic Positioning Systems Market by Value, 2021-2031 (USD Mn, AGR (%), CAGR (%)) (V – Shaped Recovery)
Figure 87. Canada Dynamic Positioning Systems Market by Value, 2021-2031 (USD Mn, AGR (%), CAGR (%)) (W – Shaped Recovery)
Figure 88. Canada Dynamic Positioning Systems Market by Value, 2021-2031 (USD Mn, AGR (%), CAGR (%)) (U – Shaped Recovery)
Figure 89. Canada Dynamic Positioning Systems Market by Value, 2021-2031 (USD Mn, AGR (%), CAGR (%)) (L – Shaped Recovery)
Figure 90. Mexico Dynamic Positioning Systems Market by Value, 2021-2031 (USD Mn, AGR (%), CAGR (%))
Figure 91. Mexico Dynamic Positioning Systems Market by Value, 2021-2031 (USD Mn, AGR (%), CAGR (%)) (V – Shaped Recovery)
Figure 92. Mexico Dynamic Positioning Systems Market by Value, 2021-2031 (USD Mn, AGR (%), CAGR (%)) (W – Shaped Recovery)
Figure 93. Mexico Dynamic Positioning Systems Market by Value, 2021-2031 (USD Mn, AGR (%), CAGR (%)) (U – Shaped Recovery)
Figure 94. Mexico Dynamic Positioning Systems Market by Value, 2021-2031 (USD Mn, AGR (%), CAGR (%)) (L – Shaped Recovery)
Figure 95. Europe Dynamic Positioning Market by Value, 2021-2031 (USD Mn, AGR (%), CAGR (%))
Figure 96. Europe Dynamic Positioning Market by Value, 2021-2031 (USD Mn, AGR (%), CAGR (%)) (V – Shaped Recovery)
Figure 97. Europe Dynamic Positioning Market by Value, 2021-2031 (USD Mn, AGR (%), CAGR (%)) (W – Shaped Recovery)
Figure 98. Europe Dynamic Positioning Market by Value, 2021-2031 (USD Mn, AGR (%), CAGR (%)) (U – Shaped Recovery)
Figure 99. Europe Dynamic Positioning Market by Value, 2021-2031 (USD Mn, AGR (%), CAGR (%)) (L – Shaped Recovery)
Figure 100. Europe Dynamic Positioning Market by Country, 2021-2031 (USD Mn, AGR (%), CAGR (%))
Figure 101. Europe Dynamic Positioning Market by Country, 2021-2031 (USD Mn, AGR (%), CAGR(%)) (V – Shaped Recovery)
Figure 102. Europe Dynamic Positioning Market by Country, 2021-2031 (USD Mn, AGR (%), CAGR(%)) (W – Shaped Recovery)
Figure 103. Europe Dynamic Positioning Market by Country, 2021-2031 (USD Mn, AGR (%), CAGR(%)) (U – Shaped Recovery)
Figure 104. Europe Dynamic Positioning Market by Country, 2021-2031 (USD Mn, AGR (%), CAGR(%)) (L – Shaped Recovery)
Figure 105. Europe Dynamic Positioning Market by Equipment Class, 2021-2031 (USD Mn, AGR (%), CAGR (%))
Figure 106. Europe Dynamic Positioning Market by Equipment Class, 2021-2031 (USD Mn, AGR (%), CAGR (%)) (V – Shaped Recovery)
Figure 107. Europe Dynamic Positioning Market by Equipment Class, 2021-2031 (USD Mn, AGR (%), CAGR (%)) (W – Shaped Recovery)
Figure 108. Europe Dynamic Positioning Market by Equipment Class, 2021-2031 (USD Mn, AGR (%), CAGR (%)) (U – Shaped Recovery)
Figure 109. Europe Dynamic Positioning Market by Equipment Class, 2021-2031 (USD Mn, AGR (%), CAGR (%)) (L – Shaped Recovery)
Figure 110. Europe Dynamic Positioning Market Technology, 2021-2031 (USD Mn, AGR (%), CAGR (%))
Figure 111. Europe Dynamic Positioning Market Technology, 2021-2031 (USD Mn, AGR (%), CAGR (%)) (V – Shaped Recovery)
Figure 112. Europe Dynamic Positioning Market Technology, 2021-2031 (USD Mn, AGR (%), CAGR (%)) (W – Shaped Recovery)
Figure 113. Europe Dynamic Positioning Market Technology, 2021-2031 (USD Mn, AGR (%), CAGR (%)) (U – Shaped Recovery)
Figure 114. Europe Dynamic Positioning Market Technology, 2021-2031 (USD Mn, AGR (%), CAGR (%)) (L – Shaped Recovery)
Figure 115. Europe Dynamic Positioning Market Function, 2021-2031 (USD Mn, AGR (%), CAGR (%))
Figure 116. Europe Dynamic Positioning Market Function, 2021-2031 (USD Mn, AGR (%), CAGR (%)) (V – Shaped Recovery)
Figure 117. Europe Dynamic Positioning Market Function, 2021-2031 (USD Mn, AGR (%), CAGR (%)) (W – Shaped Recovery)
Figure 118. Europe Dynamic Positioning Market Function, 2021-2031 (USD Mn, AGR (%), CAGR (%)) (U – Shaped Recovery)
Figure 119. Europe Dynamic Positioning Market Function, 2021-2031 (USD Mn, AGR (%), CAGR (%)) (L – Shaped Recovery)
Figure 120. Europe Dynamic Positioning Market End-Use, 2021-2031 (USD Mn, AGR (%), CAGR (%))
Figure 121. Europe Dynamic Positioning Market End-Use, 2021-2031 (USD Mn, AGR (%), CAGR (%)) (V – Shaped Recovery)
Figure 122. Europe Dynamic Positioning Market End-Use, 2021-2031 (USD Mn, AGR (%), CAGR (%)) (W – Shaped Recovery)
Figure 123. Europe Dynamic Positioning Market End-Use, 2021-2031 (USD Mn, AGR (%), CAGR (%)) (U – Shaped Recovery)
Figure 124. Europe Dynamic Positioning Market End-Use, 2021-2031 (USD Mn, AGR (%), CAGR (%)) (L – Shaped Recovery)
Figure 125. Europe Dynamic Positioning Market Application, 2021-2031 (USD Mn, AGR (%), CAGR (%))
Figure 126. Europe Dynamic Positioning Market Application, 2021-2031 (USD Mn, AGR (%), CAGR (%)) (V – Shaped Recovery)
Figure 127. Europe Dynamic Positioning Market Application, 2021-2031 (USD Mn, AGR (%), CAGR (%)) (W – Shaped Recovery)
Figure 128. Europe Dynamic Positioning Market Application, 2021-2031 (USD Mn, AGR (%), CAGR (%)) (U – Shaped Recovery)
Figure 129. Europe Dynamic Positioning Market Application, 2021-2031 (USD Mn, AGR (%), CAGR (%)) (L – Shaped Recovery)
Figure 130. Germany Dynamic Positioning Market by Value, 2021-2031 (USD Mn, AGR (%), CAGR (%))
Figure 131. Germany Dynamic Positioning Market by Value, 2021-2031 (USD Mn, AGR (%), CAGR (%)) (V – Shaped Recovery)
Figure 132. Germany Dynamic Positioning Market by Value, 2021-2031 (USD Mn, AGR (%), CAGR (%)) (W – Shaped Recovery)
Figure 133. Germany Dynamic Positioning Market by Value, 2021-2031 (USD Mn, AGR (%), CAGR (%)) (U – Shaped Recovery)
Figure 134. Germany Dynamic Positioning Market by Value, 2021-2031 (USD Mn, AGR (%), CAGR (%)) (L – Shaped Recovery)
Figure 135. UK Dynamic Positioning Market by Value, 2021-2031 (USD Mn, AGR (%), CAGR (%))
Figure 136. UK Dynamic Positioning Market by Value, 2021-2031 (USD Mn, AGR (%), CAGR (%)) (V – Shaped Recovery)
Figure 137. UK Dynamic Positioning Market by Value, 2021-2031 (USD Mn, AGR (%), CAGR (%)) (W – Shaped Recovery)
Figure 138. UK Dynamic Positioning Market by Value, 2021-2031 (USD Mn, AGR (%), CAGR (%)) (U – Shaped Recovery)
Figure 139. UK Dynamic Positioning Systems Market by Value, 2021-2031 (USD Mn, AGR (%), CAGR (%)) (L – Shaped Recovery)
Figure 140. France Dynamic Positioning Systems Market by Value, 2021-2031 (USD Mn, AGR (%), CAGR (%))
Figure 141. France Dynamic Positioning Systems Market by Value, 2021-2031 (USD Mn, AGR (%), CAGR (%)) (V – Shaped Recovery)
Figure 142. France Dynamic Positioning Systems Market by Value, 2021-2031 (USD Mn, AGR (%), CAGR (%)) (W – Shaped Recovery)
Figure 143. France Dynamic Positioning Systems Market by Value, 2021-2031 (USD Mn, AGR (%), CAGR (%)) (U – Shaped Recovery)
Figure 144. France Dynamic Positioning Systems Market by Value, 2021-2031 (USD Mn, AGR (%), CAGR (%)) (L – Shaped Recovery)
Figure 145. Italy Dynamic Positioning Systems Market by Value, 2021-2031 (USD Mn, AGR (%), CAGR (%))
Figure 146. Italy Dynamic Positioning Systems Market by Value, 2021-2031 (USD Mn, AGR (%), CAGR (%)) (V – Shaped Recovery)
Figure 147. Italy Dynamic Positioning Systems Market by Value, 2021-2031 (USD Mn, AGR (%), CAGR (%)) (W – Shaped Recovery)
Figure 148. Italy Dynamic Positioning Systems Market by Value, 2021-2031 (USD Mn, AGR (%), CAGR (%)) (U – Shaped Recovery)
Figure 149. Italy Dynamic Positioning Systems Market by Value, 2021-2031 (USD Mn, AGR (%), CAGR (%)) (L – Shaped Recovery)
Figure 150. Spain Dynamic Positioning Systems Market by Value, 2021-2031 (USD Mn, AGR (%), CAGR (%))
Figure 151. Spain Dynamic Positioning Systems Market by Value, 2021-2031 (USD Mn, AGR (%), CAGR (%)) (V – Shaped Recovery)
Figure 152. Spain Dynamic Positioning Systems Market by Value, 2021-2031 (USD Mn, AGR (%), CAGR (%)) (W – Shaped Recovery)
Figure 153. Spain Dynamic Positioning Systems Market by Value, 2021-2031 (USD Mn, AGR (%), CAGR (%)) (U – Shaped Recovery)
Figure 154. Spain Dynamic Positioning Systems Market by Value, 2021-2031 (USD Mn, AGR (%), CAGR (%)) (L – Shaped Recovery)
Figure 155. Rest of Europe Dynamic Positioning Systems Market by Value, 2021-2031 (USD Mn, AGR (%), CAGR (%))
Figure 156. Rest of Europe Dynamic Positioning Systems Market by Value, 2021-2031 (USD Mn, AGR (%), CAGR (%)) (V – Shaped Recovery)
Figure 157. Rest of Europe Dynamic Positioning Systems Market by Value, 2021-2031 (USD Mn, AGR (%), CAGR (%)) (W – Shaped Recovery)
Figure 158. Rest of Europe Dynamic Positioning Systems Market by Value, 2021-2031 (USD Mn, AGR (%), CAGR (%)) (U – Shaped Recovery)
Figure 159. Rest of Europe Dynamic Positioning Systems Market by Value, 2021-2031 (USD Mn, AGR (%), CAGR (%)) (L – Shaped Recovery)
Figure 160. Asia-Pacific Dynamic Positioning Systems Market by Value, 2021-2031 (USD Mn, AGR (%), CAGR (%))
Figure 161. Asia-Pacific Dynamic Positioning Systems Market by Value, 2021-2031 (USD Mn, AGR (%), CAGR (%)) (V – Shaped Recovery)
Figure 162. Asia-Pacific Dynamic Positioning Systems Market by Value, 2021-2031 (USD Mn, AGR (%), CAGR (%)) (W – Shaped Recovery)
Figure 163. Asia-Pacific Dynamic Positioning Systems Market by Value, 2021-2031 (USD Mn, AGR (%), CAGR (%)) (U – Shaped Recovery)
Figure 164. Asia-Pacific Dynamic Positioning Systems Market by Value, 2021-2031 (USD Mn, AGR (%), CAGR (%)) (L – Shaped Recovery)
Figure 165. Asia-Pacific Dynamic Positioning Systems Market by Country, 2021-2031 (USD Mn, AGR (%), CAGR (%))
Figure 166. Asia-Pacific Dynamic Positioning Systems Market by Country, 2021-2031 (USD Mn, AGR (%), CAGR(%)) (V – Shaped Recovery)
Figure 167. Asia-Pacific Dynamic Positioning Systems Market by Country, 2021-2031 (USD Mn, AGR (%), CAGR(%)) (W – Shaped Recovery)
Figure 168. Asia-Pacific Dynamic Positioning Systems Market by Country, 2021-2031 (USD Mn, AGR (%), CAGR(%)) (U – Shaped Recovery)
Figure 169. Asia-Pacific Dynamic Positioning Systems Market by Country, 2021-2031 (USD Mn, AGR (%), CAGR(%)) (L – Shaped Recovery)
Figure 170. Asia-Pacific Dynamic Positioning Systems Market by By Equipment Class, 2021-2031 (USD Mn, AGR (%), CAGR (%))
Figure 171. Asia-Pacific Dynamic Positioning Systems Market by By Equipment Class, 2021-2031 (USD Mn, AGR (%), CAGR (%)) (V – Shaped Recovery)
Figure 172. Asia-Pacific Dynamic Positioning Systems Market by By Equipment Class, 2021-2031 (USD Mn, AGR (%), CAGR (%)) (W – Shaped Recovery)
Figure 173. Asia-Pacific Dynamic Positioning Systems Market by By Equipment Class, 2021-2031 (USD Mn, AGR (%), CAGR (%)) (U – Shaped Recovery)
Figure 174. Asia-Pacific Dynamic Positioning Systems Market by By Equipment Class, 2021-2031 (USD Mn, AGR (%), CAGR (%)) (L – Shaped Recovery)
Figure 175. Asia-Pacific Dynamic Positioning Systems Market By Technology, 2021-2031 (USD Mn, AGR (%), CAGR (%))
Figure 176. Asia-Pacific Dynamic Positioning Systems Market By Technology, 2021-2031 (USD Mn, AGR (%), CAGR (%)) (V – Shaped Recovery)
Figure 177. Asia-Pacific Dynamic Positioning Systems Market By Technology, 2021-2031 (USD Mn, AGR (%), CAGR (%)) (W – Shaped Recovery)
Figure 178. Asia-Pacific Dynamic Positioning Systems Market By Technology, 2021-2031 (USD Mn, AGR (%), CAGR (%)) (U – Shaped Recovery)
Figure 179. Asia-Pacific Dynamic Positioning Systems Market By Technology, 2021-2031 (USD Mn, AGR (%), CAGR (%)) (L – Shaped Recovery)
Figure 180. Asia-Pacific Dynamic Positioning Systems Market By Function, 2021-2031 (USD Mn, AGR (%), CAGR (%))
Figure 181. Asia-Pacific Dynamic Positioning Systems Market By Function, 2021-2031 (USD Mn, AGR (%), CAGR (%)) (V – Shaped Recovery)
Figure 182. Asia-Pacific Dynamic Positioning Systems Market By Function, 2021-2031 (USD Mn, AGR (%), CAGR (%)) (W – Shaped Recovery)
Figure 183. Asia-Pacific Dynamic Positioning Systems Market By Function, 2021-2031 (USD Mn, AGR (%), CAGR (%)) (U – Shaped Recovery)
Figure 184. Asia-Pacific Dynamic Positioning Systems Market By Function, 2021-2031 (USD Mn, AGR (%), CAGR (%)) (L – Shaped Recovery)
Figure 185. Asia-Pacific Dynamic Positioning Systems Market By End-Use, 2021-2031 (USD Mn, AGR (%), CAGR (%))
Figure 186. Asia-Pacific Dynamic Positioning Systems Market By End-Use, 2021-2031 (USD Mn, AGR (%), CAGR (%)) (V – Shaped Recovery)
Figure 187. Asia-Pacific Dynamic Positioning Systems Market By End-Use, 2021-2031 (USD Mn, AGR (%), CAGR (%)) (W – Shaped Recovery)
Figure 188. Asia-Pacific Dynamic Positioning Systems Market By End-Use, 2021-2031 (USD Mn, AGR (%), CAGR (%)) (U – Shaped Recovery)
Figure 189. Asia-Pacific Dynamic Positioning Systems Market By End-Use, 2021-2031 (USD Mn, AGR (%), CAGR (%)) (L – Shaped Recovery)
Figure 190. Asia-Pacific Dynamic Positioning Systems Market By Application, 2021-2031 (USD Mn, AGR (%), CAGR (%))
Figure 191. Asia-Pacific Dynamic Positioning Systems Market By Application, 2021-2031 (USD Mn, AGR (%), CAGR (%)) (V – Shaped Recovery)
Figure 192. Asia-Pacific Dynamic Positioning Systems Market By Application, 2021-2031 (USD Mn, AGR (%), CAGR (%)) (W – Shaped Recovery)
Figure 193. Asia-Pacific Dynamic Positioning Systems Market By Application, 2021-2031 (USD Mn, AGR (%), CAGR (%)) (U – Shaped Recovery)
Figure 194. Asia-Pacific Dynamic Positioning Systems Market By Application, 2021-2031 (USD Mn, AGR (%), CAGR (%)) (L – Shaped Recovery)
Figure 195. China Asia-Pacific Dynamic Positioning Systems Market by Value, 2021-2031 (USD Mn, AGR (%), CAGR (%))
Figure 196. China Dynamic Positioning Systems Market by Value, 2021-2031 (USD Mn, AGR (%), CAGR (%)) (V – Shaped Recovery)
Figure 197. China Dynamic Positioning Systems Market by Value, 2021-2031 (USD Mn, AGR (%), CAGR (%)) (W – Shaped Recovery)
Figure 198. China Dynamic Positioning Systems Market by Value, 2021-2031 (USD Mn, AGR (%), CAGR (%)) (U – Shaped Recovery)
Figure 199. China Dynamic Positioning Systems Market by Value, 2021-2031 (USD Mn, AGR (%), CAGR (%)) (L – Shaped Recovery)
Figure 200. India Asia-Pacific Dynamic Positioning Systems Market by Value, 2021-2031 (USD Mn, AGR (%), CAGR (%))
Figure 201. India Dynamic Positioning Systems Market by Value, 2021-2031 (USD Mn, AGR (%), CAGR (%)) (V – Shaped Recovery)
Figure 202. India Dynamic Positioning Systems Market by Value, 2021-2031 (USD Mn, AGR (%), CAGR (%)) (W – Shaped Recovery)
Figure 203. India Dynamic Positioning Systems Market by Value, 2021-2031 (USD Mn, AGR (%), CAGR (%)) (U – Shaped Recovery)
Figure 204. India Dynamic Positioning Systems Market by Value, 2021-2031 (USD Mn, AGR (%), CAGR (%)) (L – Shaped Recovery)
Figure 205. Japan Dynamic Positioning Systems Market by Value, 2021-2031 (USD Mn, AGR (%), CAGR (%))
Figure 206. Japan Dynamic Positioning Systems Market by Value, 2021-2031 (USD Mn, AGR (%), CAGR (%)) (V – Shaped Recovery)
Figure 207. Japan Dynamic Positioning Systems Market by Value, 2021-2031 (USD Mn, AGR (%), CAGR (%)) (W – Shaped Recovery)
Figure 208. Japan Dynamic Positioning Systems Market by Value, 2021-2031 (USD Mn, AGR (%), CAGR (%)) (U – Shaped Recovery)
Figure 209. Japan Dynamic Positioning Systems Market by Value, 2021-2031 (USD Mn, AGR (%), CAGR (%)) (L – Shaped Recovery)
Figure 210. South Korea Dynamic Positioning Systems Market by Value, 2021-2031 (USD Mn, AGR (%), CAGR (%))
Figure 211. South Korea Dynamic Positioning Systems Market by Value, 2021-2031 (USD Mn, AGR (%), CAGR (%)) (V – Shaped Recovery)
Figure 212. South Korea Dynamic Positioning Systems Market by Value, 2021-2031 (USD Mn, AGR (%), CAGR (%)) (W – Shaped Recovery)
Figure 213. South Korea Dynamic Positioning Systems Market by Value, 2021-2031 (USD Mn, AGR (%), CAGR (%)) (U – Shaped Recovery)
Figure 214. South Korea Dynamic Positioning Systems Market by Value, 2021-2031 (USD Mn, AGR (%), CAGR (%)) (L – Shaped Recovery)
Figure 215. Australia Dynamic Positioning Systems Market by Value, 2021-2031 (USD Mn, AGR (%), CAGR (%))
Figure 216. Australia Dynamic Positioning Systems Market by Value, 2021-2031 (USD Mn, AGR (%), CAGR (%)) (V – Shaped Recovery)
Figure 217. Australia Dynamic Positioning Systems Market by Value, 2021-2031 (USD Mn, AGR (%), CAGR (%)) (W – Shaped Recovery)
Figure 218. Australia Dynamic Positioning Systems Market by Value, 2021-2031 (USD Mn, AGR (%), CAGR (%)) (U – Shaped Recovery)
Figure 219. Australia Dynamic Positioning Systems Market by Value, 2021-2031 (USD Mn, AGR (%), CAGR (%)) (L – Shaped Recovery)
Figure 220. Rest of Asia-Pacific Dynamic Positioning Systems Market by Value, 2021-2031 (USD Mn, AGR (%), CAGR (%))
Figure 221. Rest of Asia-Pacific Dynamic Positioning Systems Market by Value, 2021-2031 (USD Mn, AGR (%), CAGR (%)) (V – Shaped Recovery)
Figure 222. Rest of Asia-Pacific Dynamic Positioning Systems Market by Value, 2021-2031 (USD Mn, AGR (%), CAGR (%)) (W – Shaped Recovery)
Figure 223. Rest of Asia-Pacific Dynamic Positioning Systems Market by Value, 2021-2031 (USD Mn, AGR (%), CAGR (%)) (U – Shaped Recovery)
Figure 224. Rest of Asia-Pacific Dynamic Positioning Systems Market by Value, 2021-2031 (USD Mn, AGR (%), CAGR (%)) (L – Shaped Recovery)
Figure 225. LAMEA Dynamic Positioning Systems Market by Value, 2021-2031 (USD Mn, AGR (%), CAGR (%))
Figure 226. LAMEA Dynamic Positioning Systems Market by Value, 2021-2031 (USD Mn, AGR (%), CAGR (%)) (V – Shaped Recovery)
Figure 227. LAMEA Dynamic Positioning Systems Market by Value, 2021-2031 (USD Mn, AGR (%), CAGR (%)) (W – Shaped Recovery)
Figure 228. LAMEA Dynamic Positioning Systems Market by Value, 2021-2031 (USD Mn, AGR (%), CAGR (%)) (U – Shaped Recovery)
Figure 229. LAMEA Dynamic Positioning Systems Market by Value, 2021-2031 (USD Mn, AGR (%), CAGR (%)) (L – Shaped Recovery)
Figure 230. LAMEA Dynamic Positioning Systems Market by Country, 2021-2031 (USD Mn, AGR (%), CAGR (%))
Figure 231. LAMEA Dynamic Positioning Systems Market by Country, 2021-2031 (USD Mn, AGR (%), CAGR(%)) (V – Shaped Recovery)
Figure 232. LAMEA Dynamic Positioning Systems Market by Country, 2021-2031 (USD Mn, AGR (%), CAGR(%)) (W – Shaped Recovery)
Figure 233. LAMEA Dynamic Positioning Systems Market by Country, 2021-2031 (USD Mn, AGR (%), CAGR(%)) (U – Shaped Recovery)
Figure 234. LAMEA Dynamic Positioning Systems Market by Country, 2021-2031 (USD Mn, AGR (%), CAGR(%)) (L – Shaped Recovery)
Figure 235. LAMEA Dynamic Positioning Systems Market by Equipment Class, 2021-2031 (USD Mn, AGR (%), CAGR (%))
Figure 236. LAMEA Dynamic Positioning Systems Market by Equipment Class, 2021-2031 (USD Mn, AGR (%), CAGR (%)) (V – Shaped Recovery)
Figure 237. LAMEA Dynamic Positioning Systems Market by Equipment Class, 2021-2031 (USD Mn, AGR (%), CAGR (%)) (W – Shaped Recovery)
Figure 238. LAMEA Dynamic Positioning Systems Market by Equipment Class, 2021-2031 (USD Mn, AGR (%), CAGR (%)) (U – Shaped Recovery)
Figure 239. LAMEA Dynamic Positioning Systems Market by Equipment Class, 2021-2031 (USD Mn, AGR (%), CAGR (%)) (L – Shaped Recovery)
Figure 240. LAMEA Dynamic Positioning Systems Market Technology, 2021-2031 (USD Mn, AGR (%), CAGR (%))
Figure 241. LAMEA Dynamic Positioning Systems Market Technology, 2021-2031 (USD Mn, AGR (%), CAGR (%)) (V – Shaped Recovery)
Figure 242. LAMEA Dynamic Positioning Systems Market Technology, 2021-2031 (USD Mn, AGR (%), CAGR (%)) (W – Shaped Recovery)
Figure 243. LAMEA Dynamic Positioning Systems Market Technology, 2021-2031 (USD Mn, AGR (%), CAGR (%)) (U – Shaped Recovery)
Figure 244. LAMEA Dynamic Positioning Systems Market Technology, 2021-2031 (USD Mn, AGR (%), CAGR (%)) (L – Shaped Recovery)
Figure 245. LAMEA Dynamic Positioning Systems Market Function, 2021-2031 (USD Mn, AGR (%), CAGR (%))
Figure 246. LAMEA Dynamic Positioning Systems Market Function, 2021-2031 (USD Mn, AGR (%), CAGR (%)) (V – Shaped Recovery)
Figure 247. LAMEA Dynamic Positioning Systems Market Function, 2021-2031 (USD Mn, AGR (%), CAGR (%)) (W – Shaped Recovery)
Figure 248. LAMEA Dynamic Positioning Systems Market Function, 2021-2031 (USD Mn, AGR (%), CAGR (%)) (U – Shaped Recovery)
Figure 249. LAMEA Dynamic Positioning Systems Market Function, 2021-2031 (USD Mn, AGR (%), CAGR (%)) (L – Shaped Recovery)
Figure 250. LAMEA Dynamic Positioning Systems Market End-Use, 2021-2031 (USD Mn, AGR (%), CAGR (%))
Figure 251. LAMEA Dynamic Positioning Systems Market End-Use, 2021-2031 (USD Mn, AGR (%), CAGR (%)) (V – Shaped Recovery)
Figure 252. LAMEA Dynamic Positioning Systems Market End-Use, 2021-2031 (USD Mn, AGR (%), CAGR (%)) (W – Shaped Recovery)
Figure 253. LAMEA Dynamic Positioning Systems Market End-Use, 2021-2031 (USD Mn, AGR (%), CAGR (%)) (U – Shaped Recovery)
Figure 254. LAMEA Dynamic Positioning Systems Market End-Use, 2021-2031 (USD Mn, AGR (%), CAGR (%)) (L – Shaped Recovery)
Figure 255. LAMEA Dynamic Positioning Systems Market Application, 2021-2031 (USD Mn, AGR (%), CAGR (%))
Figure 256. LAMEA Dynamic Positioning Systems Market Application, 2021-2031 (USD Mn, AGR (%), CAGR (%)) (V – Shaped Recovery)
Figure 257. LAMEA Dynamic Positioning Systems Market Application, 2021-2031 (USD Mn, AGR (%), CAGR (%)) (W – Shaped Recovery)
Figure 258. LAMEA Dynamic Positioning Systems Market Application, 2021-2031 (USD Mn, AGR (%), CAGR (%)) (U – Shaped Recovery)
Figure 259. LAMEA Dynamic Positioning Systems Market Application, 2021-2031 (USD Mn, AGR (%), CAGR (%)) (L – Shaped Recovery)
Figure 260. Brazil Dynamic Positioning Systems Market by Value, 2021-2031 (USD Mn, AGR (%), CAGR (%))
Figure 261. Brazil Dynamic Positioning Systems Market by Value, 2021-2031 (USD Mn, AGR (%), CAGR (%)) (V – Shaped Recovery)
Figure 262. Brazil Dynamic Positioning Systems Market by Value, 2021-2031 (USD Mn, AGR (%), CAGR (%)) (W – Shaped Recovery)
Figure 263. Brazil Dynamic Positioning Systems Market by Value, 2021-2031 (USD Mn, AGR (%), CAGR (%)) (U – Shaped Recovery)
Figure 264. Brazil Dynamic Positioning Systems Market by Value, 2021-2031 (USD Mn, AGR (%), CAGR (%)) (L – Shaped Recovery)
Figure 265. South Africa Dynamic Positioning Systems Market by Value, 2021-2031 (USD Mn, AGR (%), CAGR (%))
Figure 266. South Africa Dynamic Positioning Systems Market by Value, 2021-2031 (USD Mn, AGR (%), CAGR (%)) (V – Shaped Recovery)
Figure 267. South Africa Dynamic Positioning Systems Market by Value, 2021-2031 (USD Mn, AGR (%), CAGR (%)) (W – Shaped Recovery)
Figure 268. South Africa Dynamic Positioning Systems Market by Value, 2021-2031 (USD Mn, AGR (%), CAGR (%)) (U – Shaped Recovery)
Figure 269. South Africa Dynamic Positioning Systems Market by Value, 2021-2031 (USD Mn, AGR (%), CAGR (%)) (L – Shaped Recovery)
Figure 270. Saudi Arabia Dynamic Positioning Systems Market by Value, 2021-2031 (USD Mn, AGR (%), CAGR (%))
Figure 271. Saudi Arabia Dynamic Positioning Systems Market by Value, 2021-2031 (USD Mn, AGR (%), CAGR (%)) (V – Shaped Recovery)
Figure 272. Saudi Arabia Dynamic Positioning Systems Market by Value, 2021-2031 (USD Mn, AGR (%), CAGR (%)) (W – Shaped Recovery)
Figure 273. Saudi Arabia Dynamic Positioning Systems Market by Value, 2021-2031 (USD Mn, AGR (%), CAGR (%)) (U – Shaped Recovery)
Figure 274. Saudi Arabia Dynamic Positioning Systems Market by Value, 2021-2031 (USD Mn, AGR (%), CAGR (%)) (L – Shaped Recovery)
Figure 275. Turkey Dynamic Positioning Systems Market by Value, 2021-2031 (USD Mn, AGR (%), CAGR (%))
Figure 276. Turkey Dynamic Positioning Systems Market by Value, 2021-2031 (USD Mn, AGR (%), CAGR (%)) (V – Shaped Recovery)
Figure 277. Turkey Dynamic Positioning Systems Market by Value, 2021-2031 (USD Mn, AGR (%), CAGR (%)) (W – Shaped Recovery)
Figure 278. Turkey Dynamic Positioning Systems Market by Value, 2021-2031 (USD Mn, AGR (%), CAGR (%)) (U – Shaped Recovery)
Figure 279. Turkey Dynamic Positioning Systems Market by Value, 2021-2031 (USD Mn, AGR (%), CAGR (%)) (L – Shaped Recovery)
Figure 280. UAE Dynamic Positioning Systems Market by Value, 2021-2031 (USD Mn, AGR (%), CAGR (%))
Figure 281. UAE Dynamic Positioning Systems Market by Value, 2021-2031 (USD Mn, AGR (%), CAGR (%)) (V – Shaped Recovery)
Figure 282. UAE Dynamic Positioning Systems Market by Value, 2021-2031 (USD Mn, AGR (%), CAGR (%)) (W – Shaped Recovery)
Figure 283. UAE Dynamic Positioning Systems Market by Value, 2021-2031 (USD Mn, AGR (%), CAGR (%)) (U – Shaped Recovery)
Figure 284. UAE Dynamic Positioning Systems Market by Value, 2021-2031 (USD Mn, AGR (%), CAGR (%)) (L – Shaped Recovery)
Figure 285. Rest of LAMEA Dynamic Positioning Systems Market by Value, 2021-2031 (USD Mn, AGR (%), CAGR (%))
Figure 286. Rest of LAMEA Dynamic Positioning Systems Market by Value, 2021-2031 (USD Mn, AGR (%), CAGR (%)) (V – Shaped Recovery)
Figure 287. Rest of LAMEA Dynamic Positioning Systems Market by Value, 2021-2031 (USD Mn, AGR (%), CAGR (%)) (W – Shaped Recovery)
Figure 288. Rest of LAMEA Dynamic Positioning Systems Market by Value, 2021-2031 (USD Mn, AGR (%), CAGR (%)) (U – Shaped Recovery)
Figure 289. Rest of LAMEA Dynamic Positioning Systems Market by Value, 2021-2031 (USD Mn, AGR (%), CAGR (%)) (L – Shaped Recovery)
Figure 290. Kongsberg Gruppen Asa: Company Revenue 2016-2020 (US$Mn, AGR %)
Figure 291. Kongsberg Gruppen Asa: Company Operating Income 2016-2020 (US$Mn, AGR %)
Figure 292. Kongsberg Gruppen Asa: Company Net Income 2016-2020 (US$Mn, AGR %)
Figure 293. Kongsberg Gruppen Asa: Company EBITDA 2016-2020 (US$Mn, AGR %)
Figure 294. Abb Group: Company Revenue 2016-2020 (US$Mn, AGR %)
Figure 295. Abb Group: Company Operating Income 2016-2020 (US$Mn, AGR %)
Figure 296. Abb Group: Company Net Income 2016-2020 (US$Mn, AGR %)
Figure 297. Abb Group: Company EBITDA 2016-2020 (US$Mn, AGR %)
Figure 298. General Electric Company: Company Revenue 2016-2020 (US$Mn, AGR %)
Figure 299. General Electric Company: Company Operating Income 2016-2020 (US$Mn, AGR %)
Figure 300. General Electric Company: Company Net Income 2016-2020 (US$Mn, AGR %)
Figure 301. General Electric Company: Company EBITDA 2016-2020 (US$Mn, AGR %)
Figure 302. Wartsila Oyj Abp: Company Revenue 2016-2020 (US$Mn, AGR %)
Figure 303. Wartsila Oyj Abp: Company Operating Income 2016-2020 (US$Mn, AGR %)
Figure 304. Wartsila Oyj Abp: Company Net Income 2016-2020 (US$Mn, AGR %)
Figure 305. Wartsila Oyj Abp: Company EBITDA 2016-2020 (US$Mn, AGR %)
Figure 306. Rolls-Royce Plc.: Company Revenue 2016-2020 (US$Mn, AGR %)
Figure 307. Rolls-Royce Plc.: Company Operating Income 2016-2020 (US$Mn, AGR %)
Figure 308. Rolls-Royce Plc.: Company Net Income 2016-2020 (US$Mn, AGR %)
Figure 309. Rolls-Royce Plc.: Company EBITDA 2016-2020 (US$Mn, AGR %)
Figure 310. A.B. Volvo: Company Revenue 2016-2020 (US$Mn, AGR %)
Figure 311. A.B. Volvo: Company Operating Income 2016-2020 (US$Mn, AGR %)
Figure 312. A.B. Volvo: Company Net Income 2016-2020 (US$Mn, AGR %)
Figure 313. A.B. Volvo: Company EBITDA 2016-2020 (US$Mn, AGR %)
Figure 314. Twin Disc: Company Revenue 2016-2020 (US$Mn, AGR %)
Figure 315. Twin Disc: Company Operating Income 2016-2020 (US$Mn, AGR %)
Figure 316. Twin Disc: Company Net Income 2016-2020 (US$Mn, AGR %)
Figure 317. Twin Disc: Company EBITDA 2016-2020 (US$Mn, AGR %)
Figure 318. L3harris Technologies Inc.: Company Revenue 2017-2021 (US$Mn, AGR %)
Figure 319. L3harris Technologies Inc.: Company Operating Income 2017-2021 (US$Mn, AGR %)
Figure 320. L3harris Technologies Inc.: Company Net Income 2017-2021 (US$Mn, AGR %)
Figure 321. L3harris Technologies Inc.: Company EBITDA 2017-2021 (US$Mn, AGR %)
Figure 322. Global Dynamic Positioning Systems Market Share Forecast by Region 2021, 2026, 2031 (%)
AB Volvo
Abb Ltd
General Electric Company
Kongsberg Gruppen Asa
L3Harris Technologies, Inc.
Marine Technologies plc
Moxa
Praxis Automation Technology
Raytheon Technologies
Reygar
RH Marine
Rolls-Royce Holdings PLC
Royal IHC
Sonardyne International Ltd.
Thrustmaster of Texas, Inc.
Twin Disc
Wartsila Oyj Abp
Xenta Systems
List of Other Companies Mentioned in the report
Alphatron Marine
Caliber Company
California Microwave Inc
CDL Systems Ltd.
Chandler/May, Inc.
Chief of Staff of the Israeli Defence Force
China Academy of Defence Technology (CADT)
China Aerospace Science and Industry Corporation (CASIC)
China National Precision Machinery Import and Export
China North Industries Corporation (NORINCO)
China People’s Liberation Army (PLA)
China Precision Machinery Import-Export Corp
Christian Democratic Union (CDU)
Christian Social Union of Bavaria (CSU)
Chung Shan Institute of Science and Technology (CSIST)
CNPEP Radwar SA (Bumar Group)
COI Ceramics, Inc.
Combitech AB,
COMEX
Commercial Armored Vehicles LLC
Comptek Research Inc
Compucat Research Pty. Ltd,
Congress of the United States of America
CONTROP Precision Technologies Ltd
Corporation (CNPMIEC)
D.T.S. Ltda
Daewoo Heavy Industries Limited
Defence Electronics (Singapore)
Defence Research and Development Organisation (DRDO)
Defence Systems)
Defence Technologies Sdn Bhd (Deftech)
Denel (Pty) Ltd
Deposition Sciences Inc
Detica Group plc
DEW Engineering and Development ULC
Diehl Bodenseewerk Gerätetechnik GmbH & Co KG (Diehl
DRB-HICOM
Dutch Ministry of Defence
E-Systems Technologies Holding, Inc.
EADS Aerospatiale Matra Missiles
EADS LFK-Lenkflugkörpersysteme GmbH
EADS/LFK GmbH (MBDA)
Eclipse Electronic Systems
EIG
Elbatech Ltd
Electronica Nayarit, S.A.
Elta (IAI)
Elta North America Inc
Elta Systems Ltd
Enertec Systems 2001
Ericsson Microwave Systems AB
ETI
EUREST Raytheon Support Services
Euromissile (EADS)
European Advanced Technology (EAT)
European Advanced Technology S.A.
Eurosam
Eurosam GIE
Evotec AS
Exelis
Fairchild Imaging Inc
Fakel
Federal Data Corporation
Federal German Cabinet
Federal Ministry of Defence (Germany)
Federal Office of Defence Technology & Procurement (BWB) (Germany)
Fédération Internationale de Football Association (FIFA)
Fifth Gait Technologies Inc
Finmeccanica (now Leonardo SpA)
Finnish Army
Flight Options LLC
FNSS Savuma Sistemleri AS
GEC-Marconi Radar & Defence
General Dynamics
General Dynamics Combat Systems
Georgia Tech Research Institute
Georgia Tech Research Institute
German Alliance '90/The Greens Party
German Bundeswehr
German Minister of Defence
GESPI Aeronautics
Giat Industries
Government of China
Government of Germany
Government of Israel
Government of Italy
Government of Japan
Government of Netherlands
Government of Oman
Government of Poland
Government of Qatar
Government of Russia
Government of Saudi Arabia
Government of South Korea
Government of Taiwan
Government of the United Kingdom
Government of the United States of America
Government of Turkey
Government of UAE
Government of Yemen
Grintek Group
Grumman International Inc
Grumman Ohio Corporation
Guidance Navigation Limited
Gulf Co-operation Council (GCC)
Hamas
Hellenic Arms Industry
Henggeler Computer Consultants Inc
Hezbollah
HITT Traffic
Hollandse Signaalapparaten (Thales Nederland)
Honeywell
House Armed Services Committee
Hughes Arabia Limited
Hughes Asia Pacific Hong Kong Limited
Hughes Europe N.V.
Hughes Training Italia Srl
Huntington Ingalls Industries Inc
I.A.I. ASIA Pte Ltd
IAI North America Inc
IDAS Consortium
IGG ASELSAN Integrated Systems LLC (IAIS)
ImageSat International N.V. (ISI)
India Defence Acquisition Council
Indian Air Force
Indian Armed Forces
Indian Army
Indian Border Security Force
Indian Defence Forces
Indian Defence Research and Development Organisation (DRDO)
Indian Ministry Of Defence
Indian Navy
Indra ATM S.L.
Industrial Defender, Inc
Innovative Defense Technologies (IDT), LLC
Insitu
Insitu, Inc.
IRAN - Northrop Grumman Programs Service Company
Islamic State/Daesh
Israel Aerospace Industries (IAI)
Israel Aircraft Industries
Israel Military Industries/ Rafael Advanced Defense Systems
Israeli Defence Force (IDF)
Israeli Finance Ministry
Israeli Finance Ministry
Israeli Knesset
Israeli Special Forces
Japanese Ministry of Defense
Japanese Navy
Japanese Self-Defence Force
Jeppesen GmbH
Jeppesen Sanderson, Inc.
Kalyani Group, Saab Group
Kazakhstan ASELSAN Engineering (KAE)
KBM Kolomna
KBP Instrument Design Bureau
KBR
Kentron (now Denel Aerospace Systems)
Kentron Aerospace Systems (Denel)
Kongsberg Defence & Aerospace AS
Kongsberg Defence and Aerospace AS
Kongsberg Defence Chile SpA
Kongsberg Defence Oy
Kongsberg Gallium Ltd.
Kongsberg Gruppen ASA
Kongsberg Hungaria Kft.
Kongsberg Maritime AS
Kongsberg Maritime do Brasil S.A.
Kongsberg Maritime GmbH
Kongsberg Maritime Hellas SA
Kongsberg Maritime Holland BV
Kongsberg Maritime Ltd
Kongsberg Maritime Mexico S.A. DE C.V
Kongsberg Maritime Poland Sp.z o.o. Poland
Kongsberg Maritime S.R.L
Kongsberg Maritime Simulation Inc.
Kongsberg Maritime Tech LLC
Kongsberg Norcontrol IT Ltd.
Kongsberg Oil and Gas Technologies
Kongsberg Reinsurance Ltd
Kongsberg Satellite Services
Kongsberg Underwater Technology
Krauss-Maffei Wegmann GmbH & Co KG
Ktech Corporation
L-1 Identity Solutions Inc
L-3 Communications Corp.
L-3 Communications Corp.
L-3 Technologies
Lardosa Investment B.V.
LARDOSA/ IACIT
Larsen & Toubro
Law and Justice Party (PiS)
LFK-Lenkflugkörpersysteme (EADS/LFK GmbH)
LG Innotek Company Ltd
List of Associations Mentioned in the Report
Locker Commission, The
Lockheed Martin Aerospace Systems Integration Corporation
Lockheed Martin Australia Pty Limited
Lockheed Martin Canada Inc
Lockheed Martin Corporation
Lockheed Martin Desktop Solutions Inc
Lockheed Martin Engine Investments LLC
Lockheed Martin Global Inc
Lockheed Martin Integrated Systems Inc
Lockheed Martin Integrated Technology LLC
Lockheed Martin Investments Inc
Lockheed Martin Logistics Management Inc
Lockheed Martin Missiles and Fire Control
Lockheed Martin Operations Support Inc
Lockheed Martin Services Inc
Lockheed Martin Space Alliance Company
Lockheed Martin TAS International Services Inc
Lockheed Martin UK Insys Limited
Lockheed Martin UK Limited
Logicon Commercial Information Services Inc
Logicon Inc
Logicon International Inc
M5 Network Security Pty Ltd
Malaysian Airlines
Mardan Holdco Pte Ltd
Matra BAe Dynamics
Matra Defense
MBDA
MBDA Deutschland GmbH
MBDA France
MBDA Italy
MBDA UK
MEADS International
MEDAV GmbH
Mikes Microwave Electronic Systems
Mitsubishi Heavy Industries
Mocit Inc
MPP Vozila Ltd
Narus
Narus, Inc.
NAUDEQ
Navis Engineering Oy
Network Management Resources, Inc.
NGC Denmark ApS
NMR Consulting, Inc
Norspace AS
North Atlantic Treaty Organisation (NATO)
Northrop Electro-Optical Systems
Northrop Grumman - Canada
Northrop Grumman Aviation Inc
Northrop Grumman Corporation
Northrop Grumman Electronic Systems International Company
Northrop Grumman Electronic Systems International Company (UK)
Northrop Grumman Electronics Systems Integration International Inc
Northrop Grumman Field Support Services Inc
Northrop Grumman Foreign Sales Corporation
Northrop Grumman International Inc
Northrop Grumman International Services Company Inc
Northrop Grumman ISA International Inc
Northrop Grumman Overseas Holdings Inc
Northrop Grumman Overseas Service Corporation
Northrop Grumman Space Operations LP
Northrop Grumman Tactical Systems LLC
Northrop Grumman Technical Services Corporation
Northrop Grumman Technical Services Inc
Northrop International Aircraft Inc
NPO Almaz
OASYS Technology LLC
Oerlikon Contraves (Rheinmetall Defence)
Orbital ATK Inc
Orbital International LLC
Orbital Sciences Corporation
Orbital, Vista SpinCo Inc.
Oto Melara SpA (Alenia Defence)
Pacific Architects and Engineers Inc
Park Air Electronics Inc
Parliament of Taiwan
Parsons
People’s Liberation Army of China (PLA)
PeopleTec Inc.
Perceptics Corporation
Perimeter Internetworking Corp
Pikewerks Corporation
Pine Telecom Ltd.
Polish Armed Forces
Polish Civic Platform Party
Polish Law and justice Party
Polish Ministry of Defence
Polish Ministry of Defence Armament Department
Poseidon Scientific Instruments Pty Ltd
Praxis Automation Technology
Procerus Technologies, L.C.
Protac
PSF Conversion LLP
Qantas Defence Services (QDS)
QED Analytics Inc
QED ANALYTICS, INC.
QTC & Sim-Industries
QTC Holdings Inc
Rafael Advanced Defense Systems
Rafael Armament Development Authority Ltd
Rafael, Israel Aerospace Industries (IAI) and Israel Military Industries (IMI)
Raytheon
Raytheon Aircraft Systems International L.P.
Raytheon Australia
Raytheon Australia International PTY Limited
Raytheon Blackbird Technologies
Republic of Korea Defence Force
Republic of Korea Ministry of Defence
Russian Army
Russian Ministry of Defence
Soviet Union
Taiwan Democratic Progressive Party (DPP)
Taiwan Kuomintang
Taiwanese Armed Forces
Times of India
Turkish Undersecretariat for Defence Industries (SSM)
UK Ministry of Defence (MoD)
Undheim Systems AS
United Nations
United Nations (UN)
US 7th Fleet
US Air Force
US Army
US Defense Aquisition Board
US Defense Logistics Agency
US Defense Security Cooperation Agency
US Department of Defense
US Marine Corps
US Missile Defense Agency (MDA)
US State Department
Download sample pages
Complete the form below to download your free sample pages for Dynamic Positioning (DP) Systems Market Report 2021-2031Related reports
-
Anti-Jamming Market for GPS Market Report to 2031
As drones makes use of GPS technology, the rising commercial use of drones can prove quite advantageous for GPS offering...Full DetailsPublished: 01 January 1970 -

Machine Control System Market Report to 2031
Some of the protuberant drivers supporting the growth of the global machine control system market are identified as replacing traditional...Full DetailsPublished: 01 January 1970 -

Augmented Reality (AR) Gaming Market Report to 2031
Factors such as increased penetration of smartphones & internet and growing technology adoption among enterprises are driving the market growth....Full DetailsPublished: 01 January 1970 -
Vision Positioning System Market Report 2020-2030
Vision Positioning Systems are defined as the system where the position of a person or an object is determined in...
Full DetailsPublished: 01 January 1970
Download sample pages
Complete the form below to download your free sample pages for Dynamic Positioning (DP) Systems Market Report 2021-2031Do you have any custom requirements we can help you with?
Any specific country, geo region, market segment or specific company information?
Email us today, we can discuss your needs and see how we can help: jamie.roberts@visiongain.com
Would you like a free report overview of the report of your choice?
If so, please drop an email to Jamie Roberts stating your chosen report title to jamie.roberts@visiongain.com
Visiongain defence reports are compiled using a broad and rich mixture of both primary and secondary information to produce an overall industry outlook. In order to provide our clients with the best product possible, Visiongain analysts reach out to market-leading vendors and industry experts and review a wealth of financial data and product information from a vast range of sources. To find out more about our reports methodology, please email jamie.roberts@visiongain.com
Would you like to get the latest Visiongain defence reports catalogue?
What are the dynamic growth sectors? where are the regional business opportunities?
Which technologies will prevail and who are the leading companies succeeding in these sectors and why?
If you want definitive answers to business critical questions, discover Visiongain’s full range of business intelligence reports.
If so, please email Jamie Roberts on jamie.roberts@visiongain.com or call her today on +44 207 336 6100
ADS Group
Aerial Refueling Systems Advisory Group
Aerospace and Defence Industries Association of Nova Scotia
Aerospace Industries Association
Aerospace Industries Association of Canada
AHS International – The Vertical Flight Technical Society
Air Force Association
Aircraft Electronics Association
Airlift/Tanker Association
American Astronautical Society
American Gear Manufacturers Association
American Institute of Aeronautics and Astronautics
American Logistics Association
American Society of Naval Engineers
AMSUS – The Society of the Federal Health Agencies
Armed Forces Communications and Electronics Association
Armed Forces Communications and Electronics Association
Army Aviation Association of America
ASD – Aerospace & Defence Association of Europe
Association for Unmanned Vehicle Systems International
Association of Aviation Manufacturers of the Czech Republic
Association of Naval Aviation
Association of Old Crows
Association of Polish Aviation Industry
Association of the Defense Industry of the Czech Republic
Association of the United States Army
Association of the United States Navy
Australia Defence Association
Australian Industry & Defence Network
Australian Industry Group Defence Council
Austrian Aeronautics Industries Group
Aviation Distributors and Manufacturers Association
Aviation Suppliers Association
Belgian Security and Defence Industry
Bulgarian Defence Industry Association
Business Executives for National Security
Canadian Association of Defence and Security Industries
Conference of Defense Associations
Council of Defense and Space Industry Associations
Danish Defence & Security Industries Association
Defence Industry Manufacturers Association
Defense Industry Initiative on Business Ethics and Conduct
Defense Industry Offset Association
Defense Orientation Conference Association
Deutsche Gesellschaft fur Wehrtechnik
Federal Association of the German Security and Defence Industry
Federation of Aerospace Enterprises in Ireland
French Aerospace Industries Association
French Land Defence Manufacturers Association (GICAT)
German Aerospace Industries Association
Helicopter Association International
Hellenic Aerospace & Defense Industries Group
Homeland Security & Defense Business Council
International Stability Operations Association
Japan Association of Defense Industry
Korea Defense Industry Association
Marine Corps Association & Foundation
National Aeronautic Association
National Association of Ordnance and Explosive Waste Contractors
National Defense Industrial Association
National Defense Transportation Association
National Guard Association of the U.S.
Navy League of the United States
Netherlands Aerospace Group
New Zealand Defence Industry Association
Portuguese Association of Defense Related Industries & New Technologies Companies
Québec Ground Transportation Cluster
Satellite Industry Association
Society of American Military Engineers
South African Aerospace Maritime and Defence Industries Association
Spanish Aerospace and Defence Association Industries
Submarine Industrial Base Council
Swedish Aerospace Industries
Swedish Security and Defence Industry Association
Swiss Aeronautical Industries Group
The Association of Finnish Defence and Aerospace Industries
The Italian Industries Association for Aerospace Systems and Defence
The Netherlands Defence Manufacturers Association
The Society of Japanese Aerospace Companies
UK AeroSpace, Defence & Security Industries
United Kingdom National Defence Association
Latest Defence news
Visiongain Publishes Directed Energy Weapons (DEW) Market Report 2024-2034
The global Directed Energy Weapons (DEW) market was valued at US$6.4 billion in 2023 and is projected to grow at a CAGR of 19.6% during the forecast period 2024-2034.
26 February 2024
Visiongain Publishes Military Embedded Satellite Systems Market Report 2024-2034
The global Military Embedded Satellite Systems market is projected to grow at a CAGR of 8.7% by 2034
21 February 2024
Visiongain Publishes Military Simulation, Modelling and Virtual Training Market Report 2024-2034
The global military simulation, modelling and virtual training market was valued at US$13.2 billion in 2023 and is projected to grow at a CAGR of 8.3% during the forecast period 2024-2034.
15 February 2024
Visiongain Publishes Military Armoured Vehicle Market Report 2024-2034
The global Military Armoured Vehicle market was valued at US$36,123.6 million in 2023 and is projected to grow at a CAGR of 3.6% during the forecast period 2024-2034.
07 February 2024


