Visiongain has calculated that the Distributed Energy Generation Market will see a capital expenditure (CAPEX) of $246bn in 2019. Read on to discover the potential business opportunities available.
Fuel suppliers provide fossil fuels, nuclear and renewables sources including hydropower, solar, wind, bagasse and biomass for electrical energy generation. Other alternatives, including biomass such as peat and by products from the processing of sugar cane and palm oil, are increasingly being researched and exploited in cost-effective ways to energy generation.
Generating technologies are specific to the type of fuel that they employ, so there are strong linkages between the range of fuels that are available to a given country and the range of generating technologies that are feasible for investment. This stage has various activities including feasibility study & design, construction and installation, operation & maintenance. The firms operate, plan, design and/or construct electrical generators for energy generation.
The transmission arranges it serves to interface generation plants with conveyance frameworks, which, thusly, convey power to support areas. Transmission happens at high voltage levels to limit wasteful aspects; electrical voltage should, therefore, be “stepped up” and after that “stepped down” between the generation plant and when it achieves the distribution network. The step-up transformer is commonly viewed as a major aspect of the generation section of the value chain, while the step-down transformer normally falls inside the conveyance fragment. This phase of the esteem chain depends for the most part on electrical designers and network technicians.
The report will answer questions such as:
– How is the Distributed Energy Generation market evolving?
– What is driving and restraining Distributed Energy Generation market dynamics?
– How will each Distributed Energy Generation submarket segment grow over the forecast period and how much Sales will these submarkets account for in 2029?
– How will market shares of each Distributed Energy Generation submarket develop from 2019-2029?
– Which individual technologies will prevail and how will these shifts be responded to?
– Which Distributed Energy Generation submarket will be the main driver of the overall market from 2019-2029?
– How will political and regulatory factors influence regional Distributed Energy Generation markets and submarkets?
– Will leading national Distributed Energy Generation market broadly follow macroeconomic dynamics, or will individual country sectors outperform the rest of the economy?
– How will market shares of the national markets change by 2029 and which nation will lead the market in 2029?
– Who are the leading players and what are their prospects over the forecast period?
– How will the sector evolve as alliances form during the period between 2019 and 2029?
Five Reasons Why You Must Order and Read This Report Today:
1) The report provides Analysis and Forecasts for the Distributed Energy Generation markets by
– CAPEX (US$m)
2) The report provides forecasts for the Distributed Energy Generation market by Technology, for the period 2019-2029
– Combustion Turbines
– Reciprocating Engines
– Solar Photovoltaic
– Micro-Hydropower
– Wind Turbines
– Fuel Cells
3) The report provides forecasts for the Distributed Energy Generation market by Application, for the period 2019-2029
– Residential
– Industrial
– Commercial
4) The report provides forecasts for the Distributed Energy Generation Market by Region, for the period 2019-2029
North America Distributed Energy Generation market
– US Distributed Energy Generation Forecast 2019-2029
– Canada Distributed Energy Generation Forecast 2019-2029
Europe Distributed Energy Generation market Forecast
– Germany Distributed Energy Generation Forecast 2019-2029
– UK Distributed Energy Generation Forecast 2019-2029
– France Distributed Energy Generation Forecast 2019-2029
Asia-Pacific Distributed Energy Generation market
– China Distributed Energy Generation Forecast 2019-2029
– Japan Distributed Energy Generation Forecast 2019-2029
– India Microgrid Forecast 2019-2029
Rest of World Distributed Energy Generation market
– Middle east Distributed Energy Generation Forecast 2019-2029
– Africa Distributed Energy Generation Forecast 2019-2029
– South America Distributed Energy Generation Forecast 2019-2029
5) The report provides market share and detailed profiles of the leading companies operating within the Distributed Energy Generation market:
– General Electric
– Siemens
– Ballard Power Systems
– Caterpillar Inc.
– Rolls Royce
This independent 128-page report guarantees you will remain better informed than your competitors. With 89 tables and figures examining the Distributed Energy Generation market space, the report gives you a direct, detailed breakdown of the market. PLUS, Capital expenditure which will keep your knowledge that one step ahead of your rivals.
This report is essential reading for you or anyone in the Energy sector. Purchasing this report today will help you to recognise those important market opportunities and understand the possibilities there. I look forward to receiving your order.
Visiongain is a trading partner with the US Federal Government
CCR Ref number: KD4R6
Do you have any custom requirements we can help you with? Any need for specific country, geo region, market segment or specific company information? Contact us today, we can discuss your needs and see how we can help: sara.peerun@visiongain.com
1. Report Overview
1.1 Distributed Energy Generation (DEG) Market Overview
1.2 Market Structure Overview and Market Definition
1.2.1 Market Definition
1.2.2 Market Structure Overview
1.3 Why You Should Read This Report
1.4 How This Report Delivers
1.5 Key Questions Answered by This Analytical Report Include
1.6 Who is This Report For? 1.7 Methodology
1.7.1 Primary Research
1.7.2 Secondary Research
1.7.3 Market Evaluation & Forecasting Methodology
1.8 Frequently Asked Questions (FAQ)
1.9 Associated Visiongain Reports
1.10 About Visiongain
2. Introduction to The Distributed Energy Generation (DEG)Market
2.1 Global Distributed Energy Generation (DEG)Market Structure
2.2 Market Definition
2.3 Distributed Energy Generation (DEG)-Value Chain Analysis
2.3.1 Stakeholders
3. Executive Summary
4. Market Insights
4.1 Lucrative Opportunities in the Distributed Energy Generation Market
4.2 Energy Generation Market In APAC
4.3 Market Share of Major Countries, 2019
5. Market Scenario
5.1 Growth Factors
5.1.1 Increasing demand of Renewable Power Generation and Increasing Government Mandates
5.1.2 Growing Electricity Consumption Boost the Distributed Energy Generation Market
5.2 Restraints
5.2.1 High Initial Cost
5.3 Opportunities
5.3.1 Shift from Centralized to Distributed Generation
5.3.2 Substitute for Grid Investments
5.3.3 Environmental friendliness
5.4 Challenges
5.4.1 Improving the Capability and Cost-Efficient Operation of Distribution Networks to Serve the Increasing Amount of Distributed Generation
5.5 Market Trends
6. Distributed Energy Generation Market by Technology
6.1 Introduction
6.1 Combustion Turbines
6.2 Reciprocating Engines
6.3 Solar Photovoltaic
6.4 Micro-Hydropower
6.5 Wind Turbines
6.6 Fuel Cells
7. Distributed Energy Generation Market by Application
7.1 Introduction
7.2 Residential
7.3 Industrial
7.4 Commercial
8. Distributed Energy Generation Market by Region
8.1 Introduction
8.2 North America
8.2.1 US
8.2.2 Canada
8.2.3 Mexico
8.3 Europe
8.3.1 Germany
8.3.2 France
8.3.3 United Kingdom
8.4 Asia Pacific (APAC)
8.4.1 China
8.4.2 Japan
8.4.3 India
8.5 Rest of World (RoW)
8.5.1 Middle East
8.5.2 Africa
8.5.3 South America
9.Leading Companies in DEG Market
9.1 Introduction
9.2 General Electric
9.2.1 Business Overview
9.2.2 Recent Developments
9.2.3 Business Strategy
9.2.4 Marketing Channel
9.2.4.1Strength
9.2.4.1.1 Business segment performance Oil & Gas
9.2.4.1.2 Wide Customer Base
9.2.4.1.3 Robust Research and Development Capabilities
9.2.4.2Weakness
9.2.4.2.1 Dependence on Third Parties for Raw Materials
9.2.4.3 Opportunities
9.2.4.3.1 Inorganic growth strategy
9.2.4.3.2 Partnerships
9.2.4.3.3 Robust Outlook of Global Renewable Energy Market
9.2.4.4 Challenges
9.2.4.4.1 Environmental and Other Government Regulations
9.2.4.4.2 Aggressive competition
9.2.4.4.3 Technological changes
9.3 Siemens AG
9.3.1 Business Overview
9.3.2 Recent Developments
9.3.3 Business Strategy
9.3.4 Marketing Channel
9.3.5 SWOT Analysis
9.3.5.1 Strengths
9.3.5.1.1 Pioneer of Technology Driven Services
9.3.5.1.2 Sustained Financial Growth
9.3.5.1.3 Diversified Revenue Mix and Strong Order Backlog
9.3.5.2 Restraints
9.3.5.2.1 Decline in Cash Reserves
9.3.5.3 Opportunities
9.3.5.3.1 Focus on Innovation
9.3.5.3.2 Strategic Acquisitions
9.3.5.3.3 Contracts, Agreements and Alliances
9.3.5.4 Challenges
9.3.5.4.1 Environmental and Other Government Regulations
9.3.5.4.2 Intense Competition
9.3.5.4.2 Foreign Exchange Risks
9.4 Ballard Power System Inc
9.4.1 Business Overview
9.4.2 Recent Developments
9.4.3 Business Strategy
9.5 Caterpillar Inc.
9.5.1 Business Overview
9.5.2 Recent Developments
9.5.3 Business Strategy
9.5.4 Marketing Channel
9.5.5 SWOT Analysis
9.5.5.1 Strength
9.5.5.1.1 Strong portfolio of brands and diversified geographic presence
9.5.5.1.2 Customer driven product innovation capabilities
9.5.5.2 Weakness
9.5.5.2.1 Litigations
9.5.5.3 Opportunities
9.5.5.3.1 New product launches
9.5.5.3.2 Strategic agreements
9.5.5.4 Challenges
9.5.5.4.1 Price changes or shortage of commodities and components
9.5.5.4.2 Intense Competition
9.6 Rolls-Royce Holdings Plc
9.6.1 Business Overview
9.6.2 Recent Developments
9.6.3 Business Strategy
9.6.4 Marketing Channel
9.6.5 SWOT Analysis
9.6.5.1 Drivers
9.6.5.1.1 Order Book
9.6.5.1.2 Market Position
9.6.5.2 Weakness
9.6.5.2.1 Product Failures
9.6.5.3 Opportunities
9.6.5.3.1 Growing Global Aircraft Maintenance, Repair and Overhaul Business
9.6.5.3.2 Business Restructuring
9.6.5.3.3 Relationship with International Customers
9.6.5.4 Challenges
9.6.5.4.1 Foreign Currency Fluctuations
9.6.5.4.2 Cybersecurity Risks
9.6.5.4.3 Stringent Regulations
9.7 Other Companies Involved in The Distributed Energy Generation Market
10. Glossary
Associated Visiongain Reports
Visiongain Report Sales Order Form
Appendix A
About Visiongain
Appendix B
Visiongain report evaluation form
List of Tables
Table 3.1 Global Distributed Energy Generation Market Forecast 2019-2029, Revenue (US$ Bn)
Table 6.1 Global Distributed Energy Generation Market Forecast 2019-2029, Revenue (US$ Billion) by Technology
Table 6.2 Combustion Distributed Energy Generation Market Forecast 2019-2029, Revenue (US$ Millions) by Region
Table 6.3 Reciprocating Engines Distributed Energy Generation Market Forecast 2019-2029, Revenue (US$ Millions) by Region
Table 6.4 Solar Photovoltaic Distributed Energy Generation Market Forecast 2019-2029, Revenue (US$ Millions) by Region
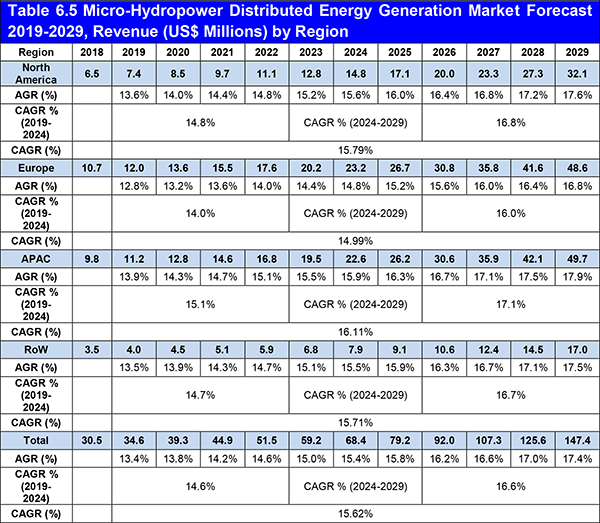
Table 6.5 Micro-Hydropower Distributed Energy Generation Market Forecast 2019-2029, Revenue (US$ Millions) by Region
Table 6.6 Wind Turbines Distributed Energy Generation Market Forecast 2019-2029, Revenue (US$ Millions) by Region
Table 6.7 Fuel Cell Distributed Energy Generation Market Forecast 2019-2029, Revenue (US$ Millions) by Region
Table 7.1 Global Distributed Energy Generation Market Forecast 2019-2029, Revenue (US$ Millions) by Application
Table 7.2 Residential Distributed Energy Generation Market Forecast 2019-2029, Revenue (US$ Millions) by Region
Table 7.3 Industrial Distributed Energy Generation Market Forecast 2019-2029, Revenue (US$ Millions) by Region
Table 7.4 Commercial Distributed Energy Generation Market Forecast 2019-2029, Revenue (US$ Millions) by Region
Table 8.1 Global Distributed Energy Generation Market Forecast 2019-2029, Revenue (US$ Millions) by Region
Table 8.2 North America Distributed Energy Generation Market Forecast 2019-2029, Revenue (US$ Millions) by Technology
Table 8.3 North America Distributed Energy Generation Market Forecast 2019-2029, Revenue (US$ Millions) by Application
Table 8.4 North America Distributed Energy Generation Market Forecast 2019-2029, Revenue (US$ Millions) by Country
Table 8.5 Europe Distributed Energy Generation Market Forecast 2019-2029, Revenue (US$ Millions) by Technology
Table 8.6 Europe Distributed Energy Generation Market Forecast 2019-2029, Revenue (US$ Millions) by Application
Table 8.7 Europe Distributed Energy Generation Market Forecast 2019-2029, Revenue (US$ Millions) by Country
Table 8.8 APAC Distributed Energy Generation Market Forecast 2019-2029, Revenue (US$ Millions) by Technology
Table 8.9 APAC Distributed Energy Generation Market Forecast 2019-2029, Revenue (US$ Millions) by Application
Table 8.10 APAC Distributed Energy Generation Market Forecast 2019-2029, Revenue (US$ Millions) by Country
Table 8.11 RoW Distributed Energy Generation Market Forecast 2019-2029, Revenue (US$ Millions) by Technology
Table 8.12 RoW Distributed Energy Generation Market Forecast 2019-2029, Revenue (US$ Millions) by Application
Table 8.13 RoW Distributed Energy Generation Market Forecast 2019-2029, Revenue (US$ Millions) by Country
Table 9.1 General Electric Profile 2018(Market Entry, Public/Private, Headquarter, Total Company Revenue $bn, Change in Revenue (%), Geography, Key Market, Listed on, Products/Services, No. of Employees)
Table 9.2 General Electric Total Company Revenue 2015-2018 ($bn, AGR %)
Table 9.3 Siemens AG Profile 2018(Market Entry, Public/Private, Headquarter, Total Company Revenue $bn, Change in Revenue, Geography, Key Market, Listed on, Products/Services, No. of Employees)
Table 9.4 Siemens AG, Total Company Revenue 2015-2018 ($bn, AGR %)
Table 9.5 Ballard Power System Inc Profile 2017(Market Entry, Public/Private, Headquarter, Total Company Revenue $bn, Change in Revenue (%), Geography, Key Market, Listed on, Products/Services)
Table 9.5 Ballard Power System Inc., Total Company Revenue 2013-2017 ($bn, AGR %)
Table 9.7 Caterpillar Inc. Profile 2017(Market Entry, Public/Private, Headquarter, Total Company Revenue $bn, Change in Revenue (%), Geography, Key Market, Listed on, Products/Services)
Table 9.8 Caterpillar Inc., Total Company Revenue 2013-2017 ($bn, AGR %)
Table 9.9 Ballard Power System Inc Profile 2017(Market Entry, Public/Private, Headquarter, Total Company Revenue $bn, Change in Revenue (%), Geography, Key Market, Listed on, Products/Services)
List of Figures
Figure 2.1 Global Distributed Energy Generation (DEG)Market Segmentation Overview
Figure 2.2 Distributed Energy Generation (DEG) -Value Chain Analysis
Figure 3.1 Global Distributed Energy Generation Market Forecast 2019-2029, Revenue (US$ Millions)
Figure 3.2 Solar PV is the fastest growing Technology During the Forecast Period
Figure 3.3 The commercial application of distributed generation is expected to grow at the highest CAGR 15.81% during the forecast period
Figure 3.4 The Asia Pacific distributed generation market is expected to grow at the highest CAGR 16.04% during the forecast period
Figure 4.1 The global distributed generation is expected to grow at the highest CAGR 15.53% during the forecast period
Figure 4.2 The APAC distributed generation is expected to grow at the highest CAGR 16.04% during the forecast period
Figure 4.3 The US distributed generation market hold the largest share in 2019
Figure 5.1 Market Overview for Distributed Energy Generation Market
Figure 6.1 Wind Turbines Hold the Largest Market Share for Distributed Energy Generation in 2019
Figure 6.2 Solar Photovoltaic is Expected to Hold the Highest CAGR (%) For Distributed Energy Generation in 2019-2029
Figure 6.3 Europe is Expected to Hold the Largest Share in 2029 for Distributed Energy Generation by Combustion Turbines
Figure 6.4 Europe is Expected to Hold the Largest Share in 2029 for Distributed Energy Generation by Reciprocating Engines
Figure 6.5 North America is to Hold the Largest Share in 2019 for Distributed Energy Generation by Solar Photovoltaic
Figure 6.6 APAC is Expected to Hold the Largest Share in 2029 for Distributed Energy Generation by Micro-Hydropower
Figure 6.7 APAC is Expected to Hold the Highest CAGR 15.06% for Distributed Energy Generation by Wind Turbines During the Forecast Period
Figure 6.8 Europe is Expected to Hold the Largest Market Share for Distributed Energy Generation by Fuel Cells in 2029
Figure 7.1 Commercial Application is Expected to Hold the Highest CAGR 15.83% for Distributed Energy Generation Market During the Forecast Period
Figure 7.2 Europe is Expected to Hold the Market Share for Residential Distributed Energy Generation Market in 2029
Figure 7.3 Europe is Expected to Hold the Market Share for Industrial Distributed Energy Generation Market in 2029
Figure 7.4 Europe is Expected to Hold the Largest Market Share for Commercial Distributed Energy Generation Market in 2029
Figure 8.1 Europe is Expected to Hold the Largest Market Share for Global Distributed Energy Generation Market in 2029
Figure 8.2 Solar Photovoltaic is Expected to Hold the Highest CAGR 16.38% for North America Distributed Energy Generation Market During the Forecast Period
Figure 8.3 Commercial is Expected to Hold the Largest Market Share for North America Distributed Energy Generation Market in 2029
Figure 8.5 US is Expected to Hold the Largest Market Share for North America Distributed Energy Generation Market in 2019
Figure 8.6 Solar Photovoltaic is Expected to Hold the Highest CAGR 15.61% for Europe Distributed Energy Generation Market During the Forecast Period
Figure 8.7 Commercial is Expected to Hold the Largest Market Share for Europe Distributed Energy Generation Market in 2029
Figure 8.8 Germany is Expected to Hold the Largest Market Share for Europe Distributed Energy Generation Market in 2019
Figure 8.9 Wind Turbine is Expected to Hold the Largest Market Share for APAC Distributed Energy Generation Market During the Forecast Period
Figure 8.10 Industrial is Expected to Hold the Highest CAGR % for APAC Distributed Energy Generation Market During the Forecast Period
Figure 8.11 India is Expected to Hold the Highest CAGR % for APAC Distributed Energy Generation Market During the Forecast Period
Figure 8.12 Wind Turbine is Expected to Hold the Largest Market Share for Row Distributed Energy Generation Market During the Forecast Period
Figure 8.13 Industrial is Expected to Hold the Largest Market Share for Row Distributed Energy Generation Market in 2029
Figure 8.14 Middle East is Expected to Hold the Largest Market Share for Row Distributed Energy Generation Market in 2019
Figure 9.1 General Electric Total Company Revenue, ($bn& AGR %), 2013-2017
Figure 9.2 General Electric % Revenue Share, by Business Segment, 2018
Figure 9.3 General Electric % Revenue Share, by Regional Segment, 2018
Figure 9.4 General Electric SWOT Analysis
Figure 9.5 Siemens AG, Company Revenue, ($bn & AGR %), 2015-2018
Figure 9.6 Siemens AG, % Revenue Share, by Regional Segment, 2018
Figure 9.7 Siemens AG, % Revenue Share, by Business Segment, 2018
Figure 9.8 Siemens AG, SWOT Analysis Figure 9.8 Siemens AG, SWOT Analysis
Figure 9.9 Ballard Power System Inc., Company Revenue, ($bn & AGR %), 2013-2017
Figure 9.10 Ballard Power System Inc., % Revenue Share, by Regional Segment, 2017
Figure 9.11 Ballard Power System Inc., % Revenue Share, by Business Segment, 2017
Figure 9.12 Ballard Power System Inc., Breakup Revenue (US$ Mn), by Sale of Product & Services, 2017
Figure 9.13 Caterpillar Inc., Company Revenue, ($bn & AGR %), 2013-2017
Figure 9.14 Caterpillar Inc., % Revenue Share, by Regional Segment, 2017
Figure 9.15 Caterpillar Inc., % Revenue Share, by Business Segment, 2017
Figure 9.16 Caterpillar Inc., SOWT Analysis
Figure 9.17 Rolls Royce, Company Revenue, ($bn & AGR %), 2013-2017
Figure 9.18 Rolls Royce, % Revenue Share, by Regional Segment, 2017
Figure 9.19 Roll-Royce, SOWT Analysis
Alstom
AMERESCO
Americas Inc
ARENA
Ballard Power System Inc
Ballard Power Systems Inc
Bloom Energy
Capstone Turbine Corporation
Caterpillar Inc
Caterpillar Power Plants
Constellation
DERlab
Doosan Fuel Cell America
E.ON SE
Electronic Industries Alliance (EIA)
ENERCON GMBH
First Solar
Fourth Partner Energy
Fuel Cell Energy
General Electric
General Electrical Energy
Huawei Technologies
IBEF
Mitsubishi Power Systems
NRG
OPRA Turbines BV
Rolls-Royce Holdings Plc
Rolls-Royce plc
Schneider Electric
Sharp Corporation
Siemens AG
Siemens Energy
SMA Solar Technology
Suzlon
Vestas Wind Systems A/S
World Energy Council
Organisations Mentioned
Department of Environment (DOE)
Distributed Power Generation Association
Energy Alternatives India (EAI)
Geospatial World
India Smart Grid Forum (ISGF)
Ministry of Statistics and Programme Implementation
North American Electric Reliability Corporation
Solar Energy Industries Association (SEIA)
T&D World
World Building Design Guide

