Industries > Pharma > Dermatological Drugs Market Report 2021-2031

Dermatological Drugs Market Report 2021-2031
Forecasts by Disease (Psoriasis, Dermatitis, Acne, Skin Infections, Other Diseases), by Skin Infections Drugs (Bepanthen/Bepanthol, Protopic, Dermovate), by Psoriasis Drugs (Humira, Stelara, Enbrel, Remicade, Taltz, Otezla), by Dermatitis Drugs (Cubicin, Zyvox, Valtrex, Canesten, Lamisil, Other Dermatitis Drugs), by Route of Administration (Topical, Oral, Parenteral Administration) AND Regional and Leading National Market Analysis PLUS Analysis of Leading Dermatological Drugs Companies AND COVID-19 Recovery Scenarios
Want to Know What is holding you back in the Dermatological Drugs Business?
This report explores the current and emerging therapies for skin disease, with a particular focus on chronic plaque psoriasis and metastatic malignant melanoma. Visiongain has discuss the current biological therapies used for psoriasis and those on the horizon, including small molecules and biosimilar. Also summarise the recent advances in the use of novel therapeutic agents in other dermatological diseases and outline the promise of translational research and stratified medicine approaches in dermatology. Better matching of patients with therapies is anticipated to have a major effect on both clinical practice and the development of new drugs and diagnostics.
Impact of COVID-19 on Pharma Supply Chains
As countries and companies continue to face the unparalleled challenges posed by the novel coronavirus (COVID-19), confusion has emerged surrounding the effects of the COVID-19 pandemic on the supply chains of global pharmaceutical industries. The concerns were compounded by the fact that in China, the world’s leading manufacturer and exporter of active pharmaceutical ingredients (API) by volume. Many global pharmaceutical companies import the bulk of their raw materials from China, which experienced lockdown from January 2020 through March 2020.
Our 580+ page report provides 387 tables, 375 charts, and graphs. Read on to discover the most lucrative areas in the industry and the future market prospects. Our new study lets you assess forecasted sales at overall world market and regional level. See financial results, trends, opportunities, and revenue predictions. Much opportunity remains in this growing dermatological drugs market. Buy our report to see how to exploit these opportunities in the global market.
Forecasts to 2031 and other analyses reveal the commercial prospects
• In addition to revenue forecasting to 2031, our new study provides you with recent results, growth rates, and market shares.
• You find original analyses, with business outlooks and developments.
• Discover qualitative analyses (including market dynamics, drivers, opportunities, restraints and challenges), Porter’s Five Forces Analysis, product profiles and commercial developments.
Discover sales predictions for the global dermatological drugs market and submarkets
Along with revenue prediction for the overall world market, there are 5 segmentations of the dermatological drugs market, with forecasts for 5 disease type, 3 Skin Infections, 6 Psoriasis Drugs, 4 Products each forecasted at a global, regional, and country level, along with COVID-19 impact recovery pattern analysis for all segments.
Leading companies and the potential for market growth
As per Visiongain analysis, global dermatological drugs market is estimated to be valued at US$xx billion in 2021 and is projected to reach at a market value of US$xx billion by 2031. We predict strong revenue growth through to 2031. Our work identifies which organizations hold the greatest potential. Discover their capabilities, progress, and commercial prospects, helping you stay ahead.
This report includes data analysis and invaluable insight into how COVID-19 will affect your industry. Access this report today.
To access the data contained in this document please email contactus@visiongain.com

What all Segments Are Covered in the Report?
Global Dermatological Drugs Market by Disease (COVID-19 Impact Recovery Analysis Covered)
• Psoriasis
• Dermatitis
• Acne
• Skin Infections
• Other Diseases
Global Dermatological Drugs Market by Skin Infections Drugs (COVID-19 Impact Recovery Analysis Covered)
• Bepanthen/Bepanthol
• Protopic
• Dermovate
Global Dermatological Drugs Market by Psoriasis Drugs (COVID-19 Impact Recovery Analysis Covered)
• Humira
• Stelara
• Enbrel
• Remicade
• Taltz
• Otezla
Global Dermatological Drugs Market by Dermatitis Drugs (COVID-19 Impact Recovery Analysis Covered)
• Cubicin
• Zyvox
• Valtrex
• Canesten
• Lamisil
• Other Dermatitis Drugs
Global Dermatological Drugs Market by Route of Administration (COVID-19 Impact Recovery Analysis Covered)
• Topical
• Oral
• Parenteral Administration
Global Dermatological Drugs Market by Region (COVID-19 Impact Recovery Analysis Covered)
• North America
• Europe
• Asia-Pacific
• Latin America
• Middle East
• Africa
Need industry data? Please contact us today.
Which Key Players Are Leading the Global Market and how much share do they hold?
The global market for dermatological drugs is ascending and has made significant gains in skin treatments. The players in the dermatological drugs market are striving to tap the opportunities that this market offers. Companies are trying to explore the available prospects by adopting various strategies such as:
• Mergers and acquisitions.
• Product launches.
• Collaborations and partnerships.
Product approval is a major milestone facing all key competitors in the dermatological drugs market. Several strategies were implemented by key market players between 2015 and Jan 2021.
How the Dermatological Drugs Market report helps you? Buy this report to find answers for below questions and how can help you to stay updated
• What is the current size of the overall global human dermatological drugs market? How much will this market be worth from 2021 to 2031?
• How will market shares of the leading national markets change by 2031, and which geographical region will lead the market in 2031?
• Who are the leading companies and what are their activities, results, developments and prospects?
• What are some of the most prominent dermatological drugs currently in development?
• What are the main trends that will affect the world dermatological drugs market between 2021 and 2031?
• What are the main strengths, weaknesses, opportunities and threats for the market?
• What are the social, technological, economic and political influences that will shape that industry over the next ten years?
• How will the global dermatological drugs market evolve over the forecasted period, 2021 to 2031?
• Which segment can succeed and what revenues could they generate to 2031?
• What will be the main commercial drivers for the market from 2021 to 2031?
• How will market shares of prominent national markets change from 2021, and which countries will lead the market in 2031, achieving highest revenues and fastest growth?
• How will that industry evolve between 2021 and 2031, especially in R&D?
Top 20 Leading Players Profiled in the Report
• AbbVie Inc. (AbbVie)
• Abbott Laboratories
• Bayer Pharmaceuticals
• Bristol-Myers Squibb
• Cadila Healthcare
• Cipla
• Dr Reddy’s
• GlaxoSmithKline
• Glenmark Pharmaceuticals Limited
• L’Oreal SA
• Lupin Limited
• Pfizer Inc. (Pfizer)
• Merck Group Chemicals
• Sun Pharma
• Taro Pharmaceutical Industries Ltd
• Johnson & Johnson Inc.
• Roche Holding AG (Roche)
• Sun Pharmaceutical Industries Limited
• Sanofi Pasteur Pharmaceutical
• Takeda Pharmaceutical Company Limited
• Taro Pharmaceutical Industries Ltd. (Taro)
Find quantitative and qualitative analyses with independent predictions. Receive information that only our report contains, staying informed with this invaluable business intelligence.
Information found nowhere else
With our newly report title, you are less likely to fall behind in knowledge or miss out on opportunities. See how our work could benefit your research, analyses, and decisions. Visiongain’s study is for everybody needing commercial analyses for the dermatological drugs market and leading companies. You will find data, trends and predictions.
To access the data contained in this document please email contactus@visiongain.com
Buy our report today Dermatological Drugs Market Report 2021-2031: Forecasts by Disease (Psoriasis, Dermatitis, Acne, Skin Infections, Other Diseases), by Skin Infections Drugs (Bepanthen/Bepanthol, Protopic, Dermovate), by Psoriasis Drugs (Humira, Stelara, Enbrel, Remicade, Taltz, Otezla), by Dermatitis Drugs (Cubicin, Zyvox, Valtrex, Canesten, Lamisil, Other Dermatitis Drugs), by Route of Administration (Topical, Oral, Parenteral Administration) AND Regional and Leading National Market Analysis PLUS Analysis of Leading Dermatological Drugs Companies AND COVID-19 Recovery Scenarios. Avoid missing out by staying informed – order our report now.
Visiongain is a trading partner with the US Federal Government
CCR Ref number: KD4R6
Do you have any custom requirements we can help you with? Any need for a specific country, geo region, market segment or specific company information? Contact us today, we can discuss your needs and see how we can help: sara.peerun@visiongain.com
1.1 Introduction to Dermatological Drugs Market
1.2 What are the Objectives of this Report?
1.3 Reasons For Doing The Study
1.4 What is the Scope of the Report?
1.5 Dermatological Drugs Market Definition
1.6 Why You Should Read This Report
1.7 What This Report Delivers
1.8 Key Questions Answered By This Analytical Report Include:
1.9 Who is This Report For?
1.10 Methodology
1.10.1 Primary Research
1.10.2 Secondary Research
1.10.3 Market Evaluation & Forecasting Methodology
1.11 Frequently Asked Questions (FAQs)
1.12 Associated Visiongain Reports
1.13 About Visiongain
2 Executive Summary
2.1 Key Highlights
3 Dermatology Industry Overview
3.1 Overview
3.1.1 Two Defence Strategies For Drug Development
3.1.2 Humoral Immunity
3.1.3 Cellular Immunity
3.1.4 Markers Of Self
3.1.5 Humoral Immunity: B Lymphocytes
3.1.6 Cellular Immunity: T Lymphocytes
3.1.7 Regulatory T Cells
3.1.8 Cytotoxic T Cells
3.1.9 Natural Immunity
4 Market Dynamics
4.1 Market Drivers
4.1.1 Why there is Increased Demand from Emerging Markets
4.1.2 Awareness and Advance Healthcare Systems
4.1.3 Cost-Effectiveness And Increasing Investments
4.1.4 Impact of Skin Disease on Quality of Life
4.1.5 Improving Quality of Care through Innovation
4.2 Restraints in the Global Market
4.2.1 How High Prices Are Restraining Growth of the Market
4.2.2 How Gaps in Knowledge Hampering the Growth?
4.2.3 Research Efforts And Funding Do Not Match With The Relative Disability Of Skin Diseases
4.3 Opportunities in the Global Market
4.3.1 Affordable Care Act: Expanding Medicare Coverage
4.3.2 Recent Recognition Of Skin Disease At The Global Stage
4.3.3 Skin Conditions Contributed 1.79% To The Total Global Burden Of Disease
4.4 Challenges in the Global Market
4.4.1 Impact of COVID-19 on Pharma Supply Chains
4.4.2 Disruption of Clinical Trials Due to Pandemic Breakout
4.4.3 Understanding The Impact Of Dermatological Diseases In Resource-Poor Areas Is Challenging
4.5 SWOT Analysis
4.5.1 Strengths of Dermatology Drugs Market
4.5.1.1 Ageing Population Driving Need for Dermatology Drugs
4.5.1.2 Demand from Emerging Markets Continue
4.5.1.3 Promising R&D Pipeline in the Dermatology Drugs Market
4.5.1.4 Increasing Awareness about Dermatology Drugs and Treatments
4.5.2 Weaknesses of Dermatology Drugs Market
4.5.2.1 High Costs Associated with Blood Plasma Therapy
4.5.2.2 Barriers to Dermatology Drugs Market Entry
4.5.3 Opportunities in the Global Dermatology Drugs
4.5.3.1 Constant Improvements in Dermatology Drugs & Treatment
4.5.3.2 The Method Of Treatment For Skin Problems Will Be Subject To Innovation Too
4.5.4 Threats in the Global Market
4.5.4.1 Approval Process For New Dermatology Drugs Is Overseen By Various Regulatory Bodies
4.5.4.2 Productivity Gap in the Dermatology Treatment Market
4.6 Porter’s Five Forces Analysis
4.6.1 Overview
4.6.2 Threat of New Entrants – Low
4.6.3 Bargaining Power of Suppliers – Low
4.6.4 Bargaining Power of Buyers – Moderate
4.6.5 Threat of Substitutes – Moderate to Low
4.6.6 Competitive Rivalry – High
5 Global Dermatological Drugs Market
5.1 Global Market Outlook
5.1.1 Growing Demand For Efficient Treatment
5.1.2 Growth In The Number Of Investment
5.1.3 The Size Of The Patient Population Determines Market Size of Dermatology Market
5.1.4 Pre-COVID Market Scenario
5.1.5 COVID-19 Impact Recovery Scenarios (V, U, W, L)
5.2 Regional Dermatological Drugs Market Forecast 2021-2031
5.2.1 Asia Pacific market and the rest of the world will most likely emerge in the coming years as highly promising markets
5.2.2 Regional Market Share Analysis
5.2.3 Pre-COVID Market Scenario
5.2.4 COVID-19 Impact Recovery Scenario (V, W, U, L)
5.3 Disease Segment Market Forecast 2021-2031
5.3.1 Increased Incidence Of Skin Cancer And Other Skin Disorders Are The Factors Contributing To The Market Growth Of Dermatology Drugs
5.3.2 Disease Segment Market Share Analysis
5.3.3 Pre-COVID Market Scenario
5.3.4 COVID-19 Impact Recovery Scenario (V, W, U, L)
5.4 Skin Infection Drugs Segment Market Forecast 2021-2031
5.4.1 Skin Infection Drugs Segment Outlook
5.4.1.1 Bacterial Infections
5.4.1.2 Impetigo/Ecthyma
5.4.1.3 Cellulitis
5.4.1.4 Treatments Available
5.4.1.5 Necrotizing Subcutaneous Infection
5.4.1.6 Treatments Available
5.4.1.7 Fungal Infections
5.4.1.8 Candidiasis
5.4.1.9 Treatments Available
5.4.1.10 Tinea Versicolor
5.4.1.11 Treatments Available
5.4.1.12 Viral Infections
5.4.1.13 Herpes Simplex
5.4.1.14 Treatments Available
5.4.1.15 Herpes Zoster
5.4.1.16 Treatments Available
5.4.1.17 Warts
5.4.1.18 Treatments Available
5.4.2 Skin Infection Treatment Pipeline
5.4.2.1 Anti-Infective Market
5.4.3 Skin Infection Drugs Segment Market Share Analysis
5.4.4 Pre-COVID Market Scenario
5.4.5 COVID-19 Impact Recovery Scenario (V, W, U, L)
5.5 Psoriasis Drugs Segment Market Forecast 2021-2031
5.5.1 Psoriasis Drugs Segment Outlook
5.5.1.1 Subtypes
5.5.1.2 Plaque Psoriasis
5.5.1.3 Guttate Psoriasis
5.5.1.4 Erythrodermic Psoriasis
5.5.1.5 Pustular Psoriasis
5.5.1.6 Psoriasis of the Nails
5.5.1.7 Treatments Available
5.5.1.8 Topical Therapies Available
5.5.1.9 Emollients
5.5.1.10 Keratolytics
5.5.1.11 Topical Corticosteroids
5.5.1.12 Vitamin D3 Products
5.5.1.13 Tazarotene
5.5.1.14 Tar Preparations
5.5.1.15 Anthralin
5.5.1.16 Topical Immunomodulators
5.5.1.17 Intralesional Therapy
5.5.1.18 Phototherapy with UVB
5.5.1.19 Photochemotherapy (PUVA)
5.5.1.20 Systemic Therapy
5.5.1.21 Methotrexate
5.5.1.22 Acitretin
5.5.1.23 Cyclosporine
5.5.1.24 Hydroxyurea
5.5.1.25 Cytokine Antagonists and Other Immunomodulators
5.5.2 Psoriasis Treatment Benefits And Risks
5.5.2.1 Major Engineered Protein Treatments In Use
5.5.2.2 Etanercept (Enbrel)
5.5.2.3 Adalimumab (Humira)
5.5.2.4 Infliximab (REMICADE)
5.5.2.5 Ustekinumab (STELARA)
5.5.2.6 Alefacept (Amevive)
5.5.2.7 Cost of Treatment
5.5.2.8 Psoriasis Treatment Pipeline
5.5.2.9 Psoriasis Treatment Market
5.5.3 Psoriasis Drugs Segment Market Share Analysis
5.5.4 Pre-COVID Market Scenario
5.5.5 COVID-19 Impact Recovery Scenario (V, W, U, L)
5.6 Dermatitis Drugs Segment Market Forecast 2021-2031
5.6.1 Dermatitis Drugs Segment Outlook
5.6.1.1 Irritant Contact Dermatitis
5.6.1.2 Available Treatments
5.6.1.3 Allergic response after re-exposure.
5.6.1.4 Available Treatments
5.6.1.5 Dermatitis Pipeline
5.6.2 Dermatitis Drugs Segment Market Share Analysis
5.6.3 Pre-COVID Market Scenario
5.6.4 COVID-19 Impact Recovery Scenario (V, W, U, L)
5.7 Acne Drugs Segment Market Forecast 2021-2031
5.7.1 Acne Drugs Segment Outlook
5.7.1.1 Comedonal
5.7.1.2 Papulopustular
5.7.1.3 Nodulocystic
5.7.1.4 Treatments Available
5.7.1.5 Retinoids
5.7.1.6 Antibiotics
5.7.1.7 Anti-inflammatory Drugs
5.7.1.8 Hormonal Therapy
5.7.1.9 Treatment Failure
5.7.1.10 Acne Treatment Pipeline
5.7.1.11 Acne Treatment Market
5.7.2 Acne Drugs Segment Market Share Analysis
5.7.3 Pre-COVID Market Scenario
5.7.4 COVID-19 Impact Recovery Scenario (V, W, U, L)
5.8 Route of Administration Segment Market Forecast 2021-2031
5.8.1 Route of Administration Segment Outlook
5.8.2 Route of Administration Segment Market Share Analysis
5.8.3 Pre-COVID Market Scenario
5.8.4 COVID-19 Impact Recovery Scenario (V, W, L, U)
6 North America Dermatological Drugs Market
6.1 North America Market Outlook
6.1.1 North America holds the biggest market share in dermatology drugs
6.2 North America Market Estimation & Forecast, 2021-2031
6.2.1 Pre-COVID Market Scenario
6.2.2 COVID-19 Impact Recovery Scenario (V, W, U, L)
6.3 Country Segment Market Forecast, 2021-2031
6.3.1 Country Market Share Analysis
6.3.2 Pre-COVID Market Scenario
6.3.3 COVID-19 Impact Recovery Scenario (V, W, U, L)
6.4 Disease Segment Market Forecast, 2021-2031
6.4.1 Pre-COVID Market Scenario
6.4.2 COVID-19 Impact Recovery Scenario (V, W, U, L)
6.5 Skin Infection Drugs Segment Market Forecast, 2021-2031
6.5.1 Pre-COVID Marker Scenario
6.5.2 COVID-19 Impact Recovery Scenario (V, W, U, L)
6.6 Psoriasis Drugs Segment Market Forecast, 2021-2031
6.6.1 Pre-COVID Market Scenario
6.6.2 COVID-19 Impact Recovery Scenario (V, W, U, L)
6.7 Dermatitis Drugs Segment Market Forecast, 2021-2031
6.7.1 Pre-COVID Market Scenario
6.7.2 COVID-19 Impact Recovery Scenario (V, W, U, L)
6.8 Acne Drugs Segment Market Forecast, 2021-2031
6.8.1 Pre-COVID Market Scenario
6.8.2 COVID-19 Impact Recovery Scenario (V, U, W, L)
6.9 Route of Administration Segment Market Forecast, 2021-2031
6.9.1 Pre-COVID Market Scenario
6.9.2 COVID-19 Impact Recovery Scenario (V, W, U, L)
6.10 US Dermatological Drugs Market
6.10.1 U.S. market represents 26% of the world market by value
6.10.2 Investigative Dermatology and The American Academy of Dermatology Association
6.10.3 Pre-COVID Market Scenario
6.10.4 COVID-19 Impact Recovery Scenario (V, U, W, L)
6.11 Canada Dermatological Drugs Market
6.11.1 Pharmaceutical Companies Are Re-Organizing And Adopting Strategies To Reduce Risk, And Overcome External Factors
6.11.2 Medical Education Materials Are Being Developed To Facilitate Uptake
6.11.3 Pre-COVID Market Scenario
6.11.4 COVID-19 Impact Recovery Scenario (V, W, U, L)
7 Europe Dermatological Drugs Market
7.1 Europe Market Outlook
7.1.1 Due To Its Easy Availability Of Dermatological Drugs, Europe Accounted For A Significant Market Share
7.2 Europe Dermatological Drugs Market Estimation & Forecast, 2021-2031
7.2.1 Pre-COVID Market Scenario
7.2.2 COVID-19 Impact Recovery Scenario (V, W, U, L)
7.3 Country Segment Market Forecast, 2021-2031
7.3.1 Country Market Share Analysis
7.3.2 Pre-COVID Market Scenario
7.3.3 COVID-19 Impact Recovery Scenario (V, W, U, L)
7.4 Disease Segment Market Forecast, 2021-2031
7.4.1 Pre-COVID Market Scenario
7.4.2 COVID-19 Impact Recovery Scenario (V, W, U, L)
7.5 Skin Infection Drugs Segment Market Forecast, 2021-2031
7.5.1 Pre-COVID Market Scenario
7.5.2 COVID-19 Impact Recovery Scenario (V, W, U, L)
7.6 Psoriasis Drugs Segment Market Forecast, 2021-2031
7.6.1 Pre-COVID Market Scenario
7.6.2 COVID-19 Impact Recovery Scenario (V, W, U, L)
7.7 Dermatitis Drugs Segment Market Forecast, 2021-2031
7.7.1 Pre-COVID Market Scenario
7.7.2 COVID-19 Impact Recovery Scenario (V, W, U, L)
7.8 Acne Drugs Segment Market Forecast, 2021-2031
7.8.1 Pre-COVID Market Scenario
7.8.2 COVID-19 Impact Recovery Scenario (V, W, U, L)
7.9 Route of Administration Segment Market Forecast, 2021-2031
7.9.1 Pre-COVID Market Scenario
7.9.2 COVID-19 Impact Recovery Scenario (V, W, U, L)
7.10 Germany Dermatological Drugs Market
7.10.1 Germany is the third-largest market for pharmaceuticals in an international comparison
7.10.2 The prices of widely used drugs in Germany are higher than elsewhere in the EU or in the U.S.
7.10.3 Pre-COVID Market Scenario
7.10.4 COVID-19 Impact Recovery Scenario (V, W, U, L)
7.11 UK Dermatological Drugs Market
7.11.1 The four countries of the United Kingdom have separate but cooperating public healthcare systems
7.11.2 Medical Insurance in driving the market
7.11.3 Due to Price Control the drugs are affordable in the UK
7.11.4 Pre-COVID Market Scenario
7.11.5 COVID-19 Impact Recovery Scenario (V, W, U, L)
7.12 France Dermatological Drugs Market
7.12.1 France provides the “best overall healthcare” in the world
7.12.2 The second-largest national market in the EU after Germany
7.12.3 Pre-COVID Market Scenario
7.12.4 COVID-19 Impact Recovery Scenario (V, W, U, L)
7.13 Italy Dermatological Drugs Market
7.13.1 Italy has one of the highest ratios of doctors per capita at 3.9 doctors per 1,000 patients
7.13.2 Servizio Sanitario Nazionale (Italian National Health Service, or SSN)
7.13.3 The Italian pharmaceutical market ranks among the top four in Europe
7.13.4 The Italian population is aging; the percentage over 65 years has already exceeded 20% and is set to rise still further
7.13.5 Pre-COVID Market Scenario
7.13.6 COVID-19 Impact Recovery Scenario (V, W, U, L)
7.14 Spain Dermatological Drugs Market
7.14.1 Spanish Agency of Medications and Healthcare Products
7.14.2 The Spanish pharmaceutical market is the fifth largest in the EU and ranks seventh in the world
7.14.3 A new reference price system has been implemented in Spain
7.14.4 Pre-COVID Market Scenario
7.14.5 COVID-19 Impact Recovery Scenario (V, W, U, L)
7.15 Rest of Europe Dermatological Drugs Market
7.15.1 Dermatology products account for less than 10% of the market
7.15.2 Pre-COVID Market Scenario
7.15.3 COVID-19 Impact Recovery Scenario (V, W, U, L)
8 Asia-Pacific Dermatological Drugs Market
8.1 Asia-Pacific has been third in terms of the dermatology drug market's value-added position
8.2 Asia-Pacific Dermatological drugs Market Estimation & Forecast, 2021-2031
8.2.1 Pre-COVID Market Scenario
8.2.2 COVID-19 Impact Recovery Scenario (V, W, U, L)
8.3 Country Segment Market Forecast, 2021-2031
8.3.1 Country Market Share Analysis
8.3.2 Pre-COVID Market Scenario
8.4 Disease Segment Market Forecast, 2021-2031
8.4.1 Pre-COVID Market Scenario
8.4.2 COVID-19 Impact Recovery Scenario (V, W, U, L)
8.5 Skin Infection Drugs Segment Market Forecast, 2021-2031
8.5.1 Pre-COVID Market Scenario
8.5.2 COVID-19 Impact Recovery Scenario (V, W, U, L)
8.6 Psoriasis Drugs Segment Market Forecast, 2021-2031
8.6.1 Pre-COVID Market Scenario
8.6.2 COVID-19 Impact Recovery Scenario (V, W, U, L)
8.7 Dermatitis Drugs Segment Market Forecast, 2021-2031
8.7.1 Pre-COVID Market Scenario
8.7.2 COVID-19 Impact Recovery Scenario (V, W, U, L)
8.8 Acne Drugs Segment Market Forecast, 2021-2031
8.8.1 Pre-COVID Market Scenario
8.8.2 COVID-19 Impact Recovery Scenario (V, W, U, L)
8.9 Route of Administration Segment Market Forecast, 2021-2031
8.9.1 Pre-COVID Market Scenario
8.9.2 COVID-19 Impact Recovery Scenario (V, W, U, L)
8.10 China Dermatological Drugs Market
8.10.1 Spending on healthcare for China’s vast population is on track to reach $1 trillion in 2020
8.10.2 China is now a top-three market in terms of revenue contribution, and even No. 1 for absolute revenue growth
8.10.3 Pre-COVID Market Scenario
8.10.4 COVID-19 Impact Recovery Scenario (V, W, U, L)
8.11 India Dermatological Drugs Market
8.11.1 The Indian pharmaceutical market is highly fragmented; the top 50 companies contribute 85% of the market
8.11.2 Pre-COVID Market Scenario
8.11.3 COVID-19 Impact Recovery Scenario (V, W, U, L)
8.12 Japan Dermatological Drugs Market
8.12.1 The Japanese economy is the second largest in the world
8.12.2 Pre-COVID Market Scenario
8.12.3 COVID-19 Impact Recovery Scenario (V, W, U, L)
8.13 South Korea Dermatological Drugs Market
8.13.1 Pharmaceutical spending accounted for approximately 1.7 percent of South Korea's GDP
8.13.2 The number of innovative drugs introduced in the country has also increased at a very fast pace
8.13.3 Pre-COVID Market Scenario
8.13.4 COVID-19 Impact Recovery Scenario (V, W, U, L)
8.14 Australia Dermatological Drugs Market
8.14.1 Modest growth will be driven by good market access to pharmaceutical drugs
8.14.2 The pharmaceutical market in Australia represents a knowledge-based, technology-intensive industry
8.14.3 Pre-COVID Market Scenario
8.14.4 COVID-19 Impact Recovery Scenario (V, W, U, L)
8.15 Rest of Asia Pacific Dermatological Drugs Market
8.15.1 Most of the countries in Asia Pacific adopt and implement the PIC/S GMP guide
8.15.2 Pre-COVID Market Scenario
8.15.3 COVID-19 Impact Recovery Scenario (V, W, U, L)
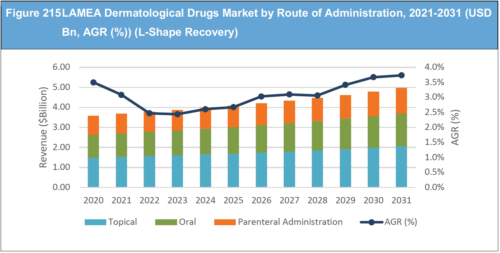
9 LAMEA Dermatological Drugs Market
9.1 LAMEA Market Outlook
9.1.1 Dermatological growth and development in Latin America has been significant
9.2 LAMEA Dermatological Drugs Market Estimation & Forecast
9.2.1 Pre-COVID Market Scenario
9.2.2 COVID-19 Impact Recovery Scenario (V, W, U, L)
9.3 Country Segment Dermatological Drugs Market
9.3.1 Country Share Analysis
9.3.2 Pre-COVID Market Scenario
9.3.3 COVID-19 Impact Recovery Scenario (V, W, U, L)
9.4 Disease Segment Market Forecast, 2021-2031
9.4.1 Pre-COVID Market Scenario
9.4.2 COVID-19 Impact Recovery Scenario (V, W, U, L)
9.5 Disease Segment Market Forecast, 2021-2031
9.5.1 Pre-COVID Market Scenario
9.5.2 COVID-19 Impact Recovery Scenario (V, W, U, L)
9.6 Psoriasis Drugs Segment Market Forecast, 2021-2031
9.6.1 Pre-COVID Market Scenario
9.6.2 COVID-19 Impact Recovery Scenario (V, W, U, L)
9.7 Dermatitis Drugs Segment Market Forecast, 2021-2031
9.7.1 Pre-COVID Market Scenario
9.7.2 COVID-19 Impact Recovery Scenario (V, W, U, L)
9.8 Acne Drugs Segment Market Forecast, 2021-2031
9.8.1 Pre-COVID Market Scenario
9.8.2 COVID-19 Impact Recovery Scenario (V, W, U, L)
9.9 Route of Administration Segment Market Forecast, 2021-2031
9.9.1 Pre-COVID Market Scenario
9.9.2 COVID-19 Impact Recovery Scenario (V, W, U, L)
9.10 Brazil Dermatological Drugs Market
9.10.1 The state and federal governments continue to increase spending on healthcare, the public market is becoming increasingly attractive
9.10.2 Pre-COVID Market Scenario
9.10.3 COVID-19 Impact Recovery Scenario (V, W, U, L)
9.11 Saudi Arabia Dermatological Drugs Market
9.11.1 Saudi Arabia market is witnessing increasing investment by major market players
9.11.2 Compulsory health insurance for expatriates is expected to offer lucrative growth opportunities
9.11.3 Pre-COVID Market Scenario
9.11.4 COVID-19 Impact Recovery Scenario (V, W, U, L)
9.12 South Africa Dermatological Drugs Market
9.12.1 South Africa’s pharmaceutical market is one of the most attractive markets in Africa
9.12.2 Pre-COVID Market Scenario
9.12.3 COVID-19 Impact Recovery Scenario (V, W, U, L)
9.13 Mexico Dermatological Drugs Market
9.13.1 Mexico Pharmaceutical the 11th largest pharma market in the world
9.13.2 Pre-COVID Market Scenario
9.13.3 COVID-19 Impact Recovery Scenario (V, W, U, L)
9.14 UAE Dermatological Drugs Market
9.14.1 Country Market Outlook
9.14.2 Pre-COVID Market Scenario
9.14.3 COVID-19 Impact Recovery Scenario (V, W, U, L)
9.15 Rest of LAMEA Dermatological Drugs Market
9.15.1 Pre-COVID Market Scenario
9.15.2 COVID-19 Impact Recovery Scenario (V, W, U, L)
10 Company Profiles
10.1 Abbott Laboratories Company
10.1.1 Company Information
10.1.2 Company Overview
10.1.3 Company Financial Profile
10.1.4 Company Product Offerings
10.1.5 Company Recent Developments
10.2 AbbVie Inc Company
10.2.1 Company Snapshot
10.2.2 Company Overview
10.2.3 Company Financial Profile
10.2.4 Company Product Benchmarking
10.2.5 Company Recent Developments
10.3 Bayer Pharmaceuticals Company
10.3.1 Company Snapshot
10.3.2 Company Overview
10.3.3 Company Financial Profile
10.3.4 Company Product Benchmarking
10.3.5 Company Recent Developments
10.4 Bristol-Myers Squibb Company
10.4.1 Company Snapshot
10.4.2 Company Overview
10.4.3 Company Financial Profile
10.4.4 Company Product Benchmarking
10.4.5 Company Recent Developments
10.5 Zydus Cadila Healthcare Pharmaceutical Company
10.5.1 Company Snapshot
10.5.2 Company Overview
10.5.3 Company Financial Profile
10.5.4 Company Product Benchmarking
10.5.5 Company Recent Developments
10.6 Cipla Pharmaceutical Company
10.6.1 Company Snapshot
10.6.2 Company Overview
10.6.3 Company Financial Profile
10.6.4 Company Product Benchmarking
10.6.5 Company Recent Developments
10.7 Dr. Reddy’s Laboratories Company
10.7.1 Company Snapshot
10.7.2 Company Overview
10.7.3 Company Financial Profile
10.7.4 Company Product Benchmarking
10.7.5 Company Recent Developments
10.8 Eli Lilly and Company
10.8.1 Company Snapshot
10.8.2 Company Overview
10.8.3 Company Financial Profile
10.8.4 Company Product Benchmarking
10.8.5 Company Recent Developments
10.9 GlaxoSmithKline Company
10.9.1 Company Snapshot
10.9.2 Company Overview
10.9.3 Company Financial Profile
10.9.4 Company Product Benchmarking
10.9.5 Company Recent Developments
10.10 Glenmark Pharmaceuticals Limited Company
10.10.1 Company Snapshot
10.10.2 Company Overview
10.10.3 Company Financial Profile
10.10.4 Company Product Benchmarking
10.10.5 Company Recent Developments
10.11 Johnson & Johnson Inc Company
10.11.1 Company Snapshot
10.11.2 Company Overview
10.11.3 Company Financial Profile
10.11.4 Company Product Benchmarking
10.11.5 Company Recent Developments
10.12 L’Oréal Cosmetics Company
10.12.1 Company Snapshot
10.12.2 Company Overview
10.12.3 Company Financial Profile
10.12.4 Company Product Benchmarking
10.12.5 Company Recent Developments
10.13 Lupin Limited Company
10.13.1 Company Snapshot
10.13.2 Company Overview
10.13.3 Company Financial Profile
10.13.4 Company Product Benchmarking
10.13.5 Company Recent Developments
10.14 Merck Group Chemicals Company
10.14.1 Company Snapshot
10.14.2 Company Overview
10.14.3 Company Financial Profile
10.14.4 Company Product Benchmarking
10.14.5 Company Recent Developments
10.15 Pfizer Inc Company
10.15.1 Company Snapshot
10.15.2 Company Overview
10.15.3 Company Financial Profile
10.15.4 Company Product Benchmarking
10.15.5 Company Recent Developments
10.16 F. Hoffmann-La Roche Ltd Company
10.16.1 Company Snapshot
10.16.2 Company Overview
10.16.3 Company Financial Profile
10.16.4 Company Product Benchmarking
10.16.5 Company Recent Developments
10.17 Sanofi Pasteur Pharmaceutical Company
10.17.1 Company Snapshot
10.17.2 Company Overview
10.17.3 Company Financial Profile
10.17.4 Company Product Benchmarking
10.17.5 Company Recent Developments
10.18 Sun Pharmaceutical Industries Limited Company
10.18.1 Company Snapshot
10.18.2 Company Overview
10.18.3 Company Financial Profile
10.18.4 Company Product Benchmarking
10.18.5 Company Recent Developments
10.19 Takeda Pharmaceuticals Company
10.19.1 Company Snapshot
10.19.2 Company Overview
10.19.3 Company Financial Profile
10.19.4 Company Product Benchmarking
10.19.5 Company Recent Developments
10.20 Taro Pharmaceutical Industries Ltd Company
10.20.1 Company Snapshot
10.20.2 Company Overview
10.20.3 Company Financial Profile
10.20.4 Company Product Benchmarking
10.20.5 Company Recent Developments
11 Concluding Remarks from Visiongain
11.1 Recommendations for Market Players
11.1.1 Narrow-spectrum antibiotics viable treatment option for acne
11.1.2 FDA, EMA accepts marketing applications for bimekizumab in psoriasis
11.1.3 FDA accepts NDA filing for topical papulopustular rosacea treatment
11.1.4 FDA approves ustekinumab for pediatric psoriasis
11.2 APAC Market is Poise to Grow Due to the high incidence of conditions such as acne and psoriasis
List of Tables
Table 1 Global Dermatological Drugs Market Snapshot, 2021 & 2031 (US$billion, CAGR %)
Table 2 Immunotherapeutic In Skin Diseases
Table 3 Disruptions of Clinical Trials Due to COVID-19, by Therapeutic Area (Number)
Table 4 Global Dermatological Drugs Market Forecast, 2021-2031 (USD Bn, AGR (%),CAGR(%))
Table 5 Global Dermatological Drugs Market Forecast, 2021-2031 (USD Bn, AGR (%),CAGR(%)) (V-Shape Recovery)
Table 6. Global Dermatological Drugs Market Forecast, 2021-2031 (USD Bn, AGR (%),CAGR(%)) (W-Shape Recovery)
Table 7. Global Dermatological Drugs Market Forecast, 2021-2031 (USD Bn, AGR (%),CAGR(%)) (U-Shape Recovery)
Table 8. Global Dermatological Drugs Market Forecast, 2021-2031 (USD Bn, AGR (%),CAGR(%)) (L-Shape Recovery)
Table 9. Global Dermatological Drugs Market by Region, 2021-2031 (USD Bn, AGR (%), CAGR(%))
Table 10. Global Dermatological Drugs Market by Region, 2021-2031 (USD Bn, AGR (%), CAGR(%)) (V-Shape Recovery)
Table 11. Global Dermatological Drugs Market by Region, 2021-2031 (USD Bn, AGR (%), CAGR(%)) (W-Shape Recovery)
Table 12. Global Dermatological Drugs Market by Region, 2021-2031 (USD Bn, AGR (%), CAGR(%)) (U-Shape Recovery)
Table 13. Global Dermatological Drugs Market by Region, 2021-2031 (USD Bn, AGR (%), CAGR(%)) (L-Shape Recovery)
Table 14. Global Dermatological Drugs Market by Disease, 2021-2031 (USD Bn, AGR (%), CAGR(%))
Table 15. Global Dermatological Drugs Market by Disease, 2021-2031 (USD Bn, AGR (%), CAGR(%)) (V-Shape Recovery)
Table 16. Global Dermatological Drugs Market by Disease, 2021-2031 (USD Bn, AGR (%), CAGR(%)) (W-Shape Recovery)
Table 17. Global Dermatological Drugs Market by Disease, 2021-2031 (USD Bn, AGR (%), CAGR(%)) (U-Shape Recovery)
Table 18. Global Dermatological Drugs Market by Disease, 2021-2031 (USD Bn, AGR (%), CAGR(%)) (L-Shape Recovery)
Table 19. Global Antifungals For Superficial Fungal Infections
Table 20. Global Antiviral Drugs Available
Table 21. Global Potential Drug Candidates For Skin Infection Treatments
Table 22. Global Dermatological Drugs Market by Skin Infections Drugs, 2021-2031 (USD Bn, AGR (%), CAGR(%))
Table 23. Global Dermatological Drugs Market by Skin Infections Drugs, 2021-2031 (USD Bn, AGR (%), CAGR(%)) (V-Shape Recovery)
Table 24. Global Dermatological Drugs Market by Skin Infections Drugs, 2021-2031 (USD Bn, AGR (%), CAGR(%)) (W-Shape Recovery)
Table 25. Global Dermatological Drugs Market by Skin Infections Drugs, 2021-2031 (USD Bn, AGR (%), CAGR(%)) (U-Shape Recovery)
Table 26. Global Dermatological Drugs Market by Skin Infections Drugs, 2021-2031 (USD Bn, AGR (%), CAGR(%)) (L-Shape Recovery)
Table 27. Cost Of Psoriasis Therapies In A Typical Western European Country ($)
Table 28. Global Dermatological Drugs Market by Psoriasis Drugs, 2021-2031 (USD Bn, AGR (%), CAGR(%))
Table 29. Global Dermatological Drugs Market by Psoriasis Drugs, 2021-2031 (USD Bn, AGR (%), CAGR(%)) (V-Shape Recovery)
Table 30. Global Dermatological Drugs Market by Psoriasis Drugs, 2021-2031 (USD Bn, AGR (%), CAGR(%)) (W-Shape Recovery)
Table 31. Global Dermatological Drugs Market by Psoriasis Drugs, 2021-2031 (USD Bn, AGR (%), CAGR(%)) (U-Shape Recovery)
Table 32. Global Dermatological Drugs Market by Psoriasis Drugs, 2021-2031 (USD Bn, AGR (%), CAGR(%)) (L-Shape Recovery)
Table 33. Global Products Undergoing Research As Potential Treatments For Dermatitis
Table 34. Global Dermatological Drugs Market by Dermatitis Drugs, 2021-2031 (USD Bn, AGR (%), CAGR(%))
Table 35. Global Dermatological Drugs Market by Dermatitis Drugs, 2021-2031 (USD Bn, AGR (%), CAGR(%)) (V-Shape Recovery)
Table 36. Global Dermatological Drugs Market by Dermatitis Drugs, 2021-2031 (USD Bn, AGR (%), CAGR(%)) (W-Shape Recovery)
Table 37. Global Dermatological Drugs Market by Dermatitis Drugs, 2021-2031 (USD Bn, AGR (%), CAGR(%)) (U-Shape Recovery)
Table 38. Global Dermatological Drugs Market by Dermatitis Drugs, 2021-2031 (USD Bn, AGR (%), CAGR(%)) (L-Shape Recovery)
Table 39 Global Potential Products for Acne Treatment
Table 40 Global Dermatological Drugs Market by Acne Drugs, 2021-2031 (USD Bn, AGR (%), CAGR (%))
Table 41 Global Dermatological Drugs Market by Acne Drugs, 2021-2031 (USD Bn, AGR (%), CAGR (%)) (V-Shape Recovery)
Table 42 Global Dermatological Drugs Market by Acne Drugs, 2021-2031 (USD Bn, AGR (%), CAGR (%)) (W-Shape Recovery)
Table 43 Global Dermatological Drugs Market by Acne Drugs, 2021-2031 (USD Bn, AGR (%), CAGR (%)) (U-Shape Recovery)
Table 44 Global Dermatological Drugs Market by Acne Drugs, 2021-2031 (USD Bn, AGR (%), CAGR (%)) (L-Shape Recovery)
Table 45 Global Dermatological Drugs Market by Route of Administration, 2021-2031 (USD Bn, AGR (%), CAGR (%))
Table 46 Global Dermatological Drugs Market by Route of Administration, 2021-2031 (USD Bn, AGR (%), CAGR (%)) (V-Shape Recovery)
Table 47 Global Dermatological Drugs Market by Route of Administration, 2021-2031 (USD Bn, AGR (%), CAGR (%)) (W-Shape Recovery)
Table 48 Global Dermatological Drugs Market by Route of Administration, 2021-2031 (USD Bn, AGR (%), CAGR (%)) (U-Shape Recovery)
Table 49 Global Dermatological Drugs Market by Route of Administration, 2021-2031 (USD Bn, AGR (%), CAGR (%)) (L-Shape Recovery)
Table 50 North America Dermatological Drugs Market by Value, 2021-2031 (USD Bn, AGR (%), CAGR (%))
Table 51 North America Dermatological Drugs Market by Value, 2021-2031 (USD Bn, AGR (%), CAGR (%)) (V-Shape Recovery)
Table 52 North America Dermatological Drugs Market by Value, 2021-2031 (USD Bn, AGR (%), CAGR (%)) (W-Shape Recovery)
Table 53 North America Dermatological Drugs Market by Value, 2021-2031 (USD Bn, AGR (%), CAGR (%)) (U-Shape Recovery)
Table 54 North America Dermatological Drugs Market by Value, 2021-2031 (USD Bn, AGR (%), CAGR (%)) (L-Shape Recovery)
Table 55 North America Dermatological Drugs Market by Disease, 2021-2031 (USD Bn, AGR (%), CAGR (%))
Table 56 North America Dermatological Drugs Market by Disease, 2021-2031 (USD Bn, AGR (%), CAGR (%)) (V-Shape Recovery)
Table 57 North America Dermatological Drugs Market by Disease, 2021-2031 (USD Bn, AGR (%), CAGR (%)) (W-Shape Recovery)
Table 58 North America Dermatological Drugs Market by Disease, 2021-2031 (USD Bn, AGR (%), CAGR (%)) (U-Shape Recovery)
Table 59 North America Dermatological Drugs Market by Disease, 2021-2031 (USD Bn, AGR (%), CAGR (%)) (L-Shape Recovery)
Table 60 North America Dermatological Drugs Market by Skin Infections Drugs, 2021-2031 (USD Bn, AGR (%), CAGR (%))
Table 61 North America Dermatological Drugs Market by Skin Infections Drugs, 2021-2031 (USD Bn, AGR (%), CAGR (%)) (V-Shape Recovery)
Table 62 North America Dermatological Drugs Market by Skin Infections Drugs, 2021-2031 (USD Bn, AGR (%), CAGR (%)) (W-Shape Recovery)
Table 63 North America Dermatological Drugs Market by Skin Infections Drugs, 2021-2031 (USD Bn, AGR (%), CAGR (%)) (U-Shape Recovery)
Table 64 North America Dermatological Drugs Market by Skin Infections Drugs, 2021-2031 (USD Bn, AGR (%), CAGR (%)) (L-Shape Recovery)
Table 65 North America Dermatological Drugs Market by Psoriasis Drugs, 2021-2031 (USD Bn, AGR (%), CAGR (%))
Table 66 North America Dermatological Drugs Market by Psoriasis Drugs, 2021-2031 (USD Bn, AGR (%), CAGR (%)) (V-Shape Recovery)
Table 67 North America Dermatological Drugs Market by Psoriasis Drugs, 2021-2031 (USD Bn, AGR (%), CAGR (%)) (W-Shape Recovery)
Table 68 North America Dermatological Drugs Market by Psoriasis Drugs, 2021-2031 (USD Bn, AGR (%), CAGR (%)) (U-Shape Recovery)
Table 69 North America Dermatological Drugs Market by Psoriasis Drugs, 2021-2031 (USD Bn, AGR (%), CAGR (%)) (L-Shape Recovery)
Table 70 North America Dermatological Drugs Market by Dermatitis Drugs, 2021-2031 (USD Bn, AGR (%), CAGR (%))
Table 71 North America Dermatological Drugs Market by Dermatitis Drugs, 2021-2031 (USD Bn, AGR (%), CAGR (%)) (V-Shape Recovery)
Table 72 North America Dermatological Drugs Market by Dermatitis Drugs, 2021-2031 (USD Bn, AGR (%), CAGR (%)) (W-Shape Recovery)
Table 73 North America Dermatological Drugs Market by Dermatitis Drugs, 2021-2031 (USD Bn, AGR (%), CAGR (%)) (U-Shape Recovery)
Table 74 North America Dermatological Drugs Market by Dermatitis Drugs, 2021-2031 (USD Bn, AGR (%), CAGR (%)) (L-Shape Recovery)
Table 75 North America Dermatological Drugs Market by Acne Drugs, 2021-2031 (USD Bn, AGR (%), CAGR (%))
Table 76 North America Dermatological Drugs Market by Acne Drugs, 2021-2031 (USD Bn, AGR (%), CAGR (%)) (V-Shape Recovery)
Table 77 North America Dermatological Drugs Market by Acne Drugs, 2021-2031 (USD Bn, AGR (%), CAGR (%)) (W-Shape Recovery)
Table 78 North America Dermatological Drugs Market by Acne Drugs, 2021-2031 (USD Bn, AGR (%), CAGR (%)) (U-Shape Recovery)
Table 79 North America Dermatological Drugs Market by Acne Drugs, 2021-2031 (USD Bn, AGR (%), CAGR (%)) (L-Shape Recovery)
Table 80 North America Dermatological Drugs Market by Route of Administration, 2021-2031 (USD Bn, AGR (%), CAGR (%))
Table 81 North America Dermatological Drugs Market by Route of Administration, 2021-2031 (USD Bn, AGR (%), CAGR (%)) (V-Shape Recovery)
Table 82 North America Dermatological Drugs Market by Route of Administration, 2021-2031 (USD Bn, AGR (%), CAGR (%)) (W-Shape Recovery)
Table 83 North America Dermatological Drugs Market by Route of Administration, 2021-2031 (USD Bn, AGR (%), CAGR (%)) (U-Shape Recovery)
Table 84 North America Dermatological Drugs Market by Route of Administration, 2021-2031 (USD Bn, AGR (%), CAGR (%)) (L-Shape Recovery)
Table 85 US Dermatological Drugs Market by Value, 2021-2031 (USD Bn, AGR (%), CAGR (%))
Table 86 US Dermatological Drugs Market by Value, 2021-2031 (USD Bn, AGR (%), CAGR (%)) (V-Shape Recovery)
Table 87 US Dermatological Drugs Market by Value, 2021-2031 (USD Bn, AGR (%), CAGR (%)) (W-Shape Recovery)
Table 88 US Dermatological Drugs Market by Value, 2021-2031 (USD Bn, AGR (%), CAGR (%)) (U-Shape Recovery)
Table 89 US Dermatological Drugs Market by Value, 2021-2031 (USD Bn, AGR (%), CAGR (%)) (L-Shape Recovery)
Table 90 Canada Dermatological Drugs Market by Value, 2021-2031 (USD Bn, AGR (%), CAGR (%))
Table 91 Canada Dermatological Drugs Market by Value, 2021-2031 (USD Bn, AGR (%), CAGR (%)) (V-Shape Recovery)
Table 92 Canada Dermatological Drugs Market by Value, 2021-2031 (USD Bn, AGR (%), CAGR (%)) (W-Shape Recovery)
Table 93 Canada Dermatological Drugs Market by Value, 2021-2031 (USD Bn, AGR (%), CAGR (%)) (U-Shape Recovery)
Table 94 Canada Dermatological Drugs Market by Value, 2021-2031 (USD Bn, AGR (%), CAGR (%)) (L-Shape Recovery)
Table 95 Europe Dermatological Drugs Market by Value, 2021-2031 (USD Bn, AGR (%), CAGR (%))
Table 96 Europe Dermatological Drugs Market Forecast, 2021-2031 (USD Bn, AGR (%), CAGR (%)) (V-Shape Recovery)
Table 97 Europe Dermatological Drugs Market Forecast, 2021-2031 (USD Bn, AGR (%), CAGR (%)) (W-Shape Recovery)
Table 98 Europe Dermatological Drugs Market Forecast, 2021-2031 (USD Bn, AGR (%), CAGR (%)) (U-Shape Recovery)
Table 99 Europe Dermatological Drugs Market Forecast, 2021-2031 (USD Bn, AGR (%), CAGR (%)) (L-Shape Recovery)
Table 100 Europe Dermatological Drugs Market by Disease, 2021-2031 (USD Bn, AGR (%), CAGR (%))
Table 101 Europe Dermatological Drugs Market by Disease, 2021-2031 (USD Bn, AGR (%), CAGR (%)) (V-Shape Recovery)
Table 102 Europe Dermatological Drugs Market by Disease, 2021-2031 (USD Bn, AGR (%), CAGR (%)) (W-Shape Recovery)
Table 103 Europe Dermatological Drugs Market by Disease, 2021-2031 (USD Bn, AGR (%), CAGR (%)) (U-Shape Recovery)
Table 104 Europe Dermatological Drugs Market by Disease, 2021-2031 (USD Bn, AGR (%), CAGR (%)) (L-Shape Recovery)
Table 105 Europe Dermatological Drugs Market by Skin Infections Drugs, 2021-2031 (USD Bn, AGR (%), CAGR (%))
Table 106 Europe Dermatological Drugs Market by Skin Infections Drugs, 2021-2031 (USD Bn, AGR (%), CAGR (%)) (V-Shape Recovery)
Table 107 Europe Dermatological Drugs Market by Skin Infections Drugs, 2021-2031 (USD Bn, AGR (%), CAGR (%)) (W-Shape Recovery)
Table 108 Europe Dermatological Drugs Market by Skin Infections Drugs, 2021-2031 (USD Bn, AGR (%), CAGR (%)) (U-Shape Recovery)
Table 109 Europe Dermatological Drugs Market by Skin Infections Drugs, 2021-2031 (USD Bn, AGR (%), CAGR (%)) (L-Shape Recovery)
Table 110 Europe Dermatological Drugs Market by Psoriasis Drugs, 2021-2031 (USD Bn, AGR (%), CAGR (%))
Table 111 Europe Dermatological Drugs Market by Psoriasis Drugs, 2021-2031 (USD Bn, AGR (%), CAGR (%)) (V-Shape Recovery)
Table 112 Europe Dermatological Drugs Market by Psoriasis Drugs, 2021-2031 (USD Bn, AGR (%), CAGR (%)) (W-Shape Recovery)
Table 113 Europe Dermatological Drugs Market by Psoriasis Drugs, 2021-2031 (USD Bn, AGR (%), CAGR (%)) (U-Shape Recovery)
Table 114 Europe Dermatological Drugs Market by Psoriasis Drugs, 2021-2031 (USD Bn, AGR (%), CAGR (%)) (L-Shape Recovery)
Table 115 Europe Dermatological Drugs Market by Dermatitis Drugs, 2021-2031 (USD Bn, AGR (%), CAGR (%))
Table 116 Europe Dermatological Drugs Market by Dermatitis Drugs, 2021-2031 (USD Bn, AGR (%), CAGR (%)) (V-Shape Recovery)
Table 117 Europe Dermatological Drugs Market by Dermatitis Drugs, 2021-2031 (USD Bn, AGR (%), CAGR (%)) (W-Shape Recovery)
Table 118 Europe Dermatological Drugs Market by Dermatitis Drugs, 2021-2031 (USD Bn, AGR (%), CAGR (%)) (U-Shape Recovery)
Table 119 Europe Dermatological Drugs Market by Dermatitis Drugs, 2021-2031 (USD Bn, AGR (%), CAGR (%)) (L-Shape Recovery)
Table 120 Europe Dermatological Drugs Market by Acne Drugs, 2021-2031 (USD Bn, AGR (%), CAGR (%))
Table 121 Europe Dermatological Drugs Market by Acne Drugs, 2021-2031 (USD Bn, AGR (%), CAGR (%)) (V-Shape Recovery)
Table 122 Europe Dermatological Drugs Market by Acne Drugs, 2021-2031 (USD Bn, AGR (%), CAGR (%)) (W-Shape Recovery)
Table 123 Europe Dermatological Drugs Market by Acne Drugs, 2021-2031 (USD Bn, AGR (%), CAGR (%)) (U-Shape Recovery)
Table 124 Europe Dermatological Drugs Market by Acne Drugs, 2021-2031 (USD Bn, AGR (%), CAGR (%)) (L-Shape Recovery)
Table 125 Europe Dermatological Drugs Market by Route of Administration, 2021-2031 (USD Bn, AGR (%), CAGR (%))
Table 126 Europe Dermatological Drugs Market by Route of Administration, 2021-2031 (USD Bn, AGR (%), CAGR (%)) (V-Shape Recovery)
Table 127 Europe Dermatological Drugs Market by Route of Administration, 2021-2031 (USD Bn, AGR (%), CAGR (%)) (W-Shape Recovery)
Table 128 Europe Dermatological Drugs Market by Route of Administration, 2021-2031 (USD Bn, AGR (%), CAGR (%)) (U-Shape Recovery)
Table 129 Europe Dermatological Drugs Market by Route of Administration, 2021-2031 (USD Bn, AGR (%), CAGR (%)) (L-Shape Recovery)
Table 130 Germany Dermatological Drugs Market by Value, 2021-2031 (USD Bn, AGR (%), CAGR (%))
Table 131 Germany Dermatological Drugs Market by Value, 2021-2031 (USD Bn, AGR (%), CAGR (%)) (V-Shape Recovery)
Table 132 Germany Dermatological Drugs Market by Value, 2021-2031 (USD Bn, AGR (%), CAGR (%)) (W-Shape Recovery)
Table 133 Germany Dermatological Drugs Market by Value, 2021-2031 (USD Bn, AGR (%), CAGR (%)) (U-Shape Recovery)
Table 134 Germany Dermatological Drugs Market by Value, 2021-2031 (USD Bn, AGR (%), CAGR (%)) (L-Shape Recovery)
Table 135 UK Dermatological Drugs Market by Value, 2021-2031 (USD Bn, AGR (%), CAGR (%))
Table 136 UK Dermatological Drugs Market by Value, 2021-2031 (USD Bn, AGR (%), CAGR (%)) (V-Shape Recovery)
Table 137 UK Dermatological Drugs Market by Value, 2021-2031 (USD Bn, AGR (%), CAGR (%)) (W-Shape Recovery)
Table 138 UK Dermatological Drugs Market by Value, 2021-2031 (USD Bn, AGR (%), CAGR (%)) (U-Shape Recovery)
Table 139 UK Dermatological Drugs Market by Value, 2021-2031 (USD Bn, AGR (%), CAGR (%)) (L-Shape Recovery)
Table 140 France Dermatological Drugs Market by Value, 2021-2031 (USD Bn, AGR (%), CAGR (%))
Table 141 France Dermatological Drugs Market by Value, 2021-2031 (USD Bn, AGR (%), CAGR (%)) (V-Shape Recovery)
Table 142 France Dermatological Drugs Market by Value, 2021-2031 (USD Bn, AGR (%), CAGR (%)) (W-Shape Recovery)
Table 143 France Dermatological Drugs Market by Value, 2021-2031 (USD Bn, AGR (%), CAGR (%)) (U-Shape Recovery)
Table 144 France Dermatological Drugs Market by Value, 2021-2031 (USD Bn, AGR (%), CAGR (%)) (L-Shape Recovery)
Table 145 Italy Dermatological Drugs Market by Value, 2021-2031 (USD Bn, AGR (%), CAGR (%))
Table 146 Italy Dermatological Drugs Market by Value, 2021-2031 (USD Bn, AGR (%), CAGR (%)) (V-Shape Recovery)
Table 147 Italy Dermatological Drugs Market by Value, 2021-2031 (USD Bn, AGR (%), CAGR (%)) (W-Shape Recovery)
Table 148 Italy Dermatological Drugs Market by Value, 2021-2031 (USD Bn, AGR (%), CAGR (%)) (U-Shape Recovery)
Table 149 Italy Dermatological Drugs Market by Value, 2021-2031 (USD Bn, AGR (%), CAGR (%)) (L-Shape Recovery)
Table 150 Spain Dermatological Drugs Market by Value, 2021-2031 (USD Bn, AGR (%), CAGR (%))
Table 151 Spain Dermatological Drugs Market by Value, 2021-2031 (USD Bn, AGR (%), CAGR (%)) (V-Shape Recovery)
Table 152 Spain Dermatological Drugs Market by Value, 2021-2031 (USD Bn, AGR (%), CAGR (%)) (W-Shape Recovery)
Table 153 Spain Dermatological Drugs Market by Value, 2021-2031 (USD Bn, AGR (%), CAGR (%)) (U-Shape Recovery)
Table 154 Spain Dermatological Drugs Market by Value, 2021-2031 (USD Bn, AGR (%), CAGR (%)) (L-Shape Recovery)
Table 155 Rest of Europe Dermatological Drugs Market by Value, 2021-2031 (USD Bn, AGR (%), CAGR (%))
Table 156 Rest of Europe Dermatological Drugs Market by Value, 2021-2031 (USD Bn, AGR (%), CAGR (%)) (V-Shape Recovery)
Table 157 Rest of Europe Dermatological Drugs Market by Value, 2021-2031 (USD Bn, AGR (%), CAGR (%)) (W-Shape Recovery)
Table 158 Rest of Europe Dermatological Drugs Market by Value, 2021-2031 (USD Bn, AGR (%), CAGR (%)) (U-Shape Recovery)
Table 159 Rest of Europe Dermatological Drugs Market by Value, 2021-2031 (USD Bn, AGR (%), CAGR (%)) (L-Shape Recovery)
Table 160 Asia-Pacific Dermatological Drugs Market by Value, 2021-2031 (USD Bn, AGR (%), CAGR(%))
Table 161 Asia Pacific Dermatological Drugs Market Forecast, 2021-2031 (USD Bn, AGR (%), CAGR (%)) (V-Shape Recovery)
Table 162 Asia Pacific Dermatological Drugs Market Forecast, 2021-2031 (USD Bn, AGR (%), CAGR (%)) (W-Shape Recovery)
Table 163 Asia Pacific Dermatological Drugs Market Forecast, 2021-2031 (USD Bn, AGR (%), CAGR (%)) (U-Shape Recovery)
Table 164 Asia Pacific Dermatological Drugs Market Forecast, 2021-2031 (USD Bn, AGR (%), CAGR (%)) (L-Shape Recovery)
Table 165 Asia-Pacific Dermatological Drugs Market by Disease, 2021-2031 (USD Bn, AGR (%), CAGR (%))
Table 166 Asia Pacific Dermatological Drugs Market by Disease, 2021-2031 (USD Bn, AGR (%), CAGR (%)) (V-Shape Recovery)
Table 167 Asia Pacific Dermatological Drugs Market by Disease, 2021-2031 (USD Bn, AGR (%), CAGR (%)) (W-Shape Recovery)
Table 168 Asia Pacific Dermatological Drugs Market by Disease, 2021-2031 (USD Bn, AGR (%), CAGR (%)) (U-Shape Recovery)
Table 169 Asia Pacific Dermatological Drugs Market by Disease, 2021-2031 (USD Bn, AGR (%), CAGR (%)) (L-Shape Recovery)
Table 170 Asia-Pacific Dermatological Drugs Market by Skin Infections Drugs, 2021-2031 (USD Bn, AGR (%), CAGR (%))
Table 171 Asia Pacific Dermatological Drugs Market by Skin Infections Drugs, 2021-2031 (USD Bn, AGR (%), CAGR (%)) (V-Shape Recovery)
Table 172 Asia Pacific Dermatological Drugs Market by Skin Infections Drugs, 2021-2031 (USD Bn, AGR (%), CAGR (%)) (W-Shape Recovery)
Table 173 Asia Pacific Dermatological Drugs Market by Skin Infections Drugs, 2021-2031 (USD Bn, AGR (%), CAGR (%)) (U-Shape Recovery)
Table 174 Asia Pacific Dermatological Drugs Market by Skin Infections Drugs, 2021-2031 (USD Bn, AGR (%), CAGR (%)) (L-Shape Recovery)
Table 175 Asia-Pacific Dermatological Drugs Market by Psoriasis Drugs, 2021-2031 (USD Bn, AGR (%), CAGR (%))
Table 176 Asia Pacific Dermatological Drugs Market by Psoriasis Drugs, 2021-2031 (USD Bn, AGR (%), CAGR (%)) (V-Shape Recovery)
Table 177 Asia Pacific Dermatological Drugs Market by Psoriasis Drugs, 2021-2031 (USD Bn, AGR (%), CAGR (%)) (W-Shape Recovery)
Table 178 Asia Pacific Dermatological Drugs Market by Psoriasis Drugs, 2021-2031 (USD Bn, AGR (%), CAGR (%)) (U-Shape Recovery)
Table 179 Asia Pacific Dermatological Drugs Market by Psoriasis Drugs, 2021-2031 (USD Bn, AGR (%), CAGR (%)) (L-Shape Recovery)
Table 180 Asia-Pacific Dermatological Drugs Market by Dermatitis Drugs, 2021-2031 (USD Bn, AGR (%), CAGR (%))
Table 181 Asia Pacific Dermatological Drugs Market by Dermatitis Drugs, 2021-2031 (USD Bn, AGR (%), CAGR (%)) (V-Shape Recovery)
Table 182 Asia Pacific Dermatological Drugs Market by Dermatitis Drugs, 2021-2031 (USD Bn, AGR (%), CAGR (%)) (W-Shape Recovery)
Table 183 Asia Pacific Dermatological Drugs Market by Dermatitis Drugs, 2021-2031 (USD Bn, AGR (%), CAGR (%)) (U-Shape Recovery)
Table 184 Asia Pacific Dermatological Drugs Market by Dermatitis Drugs, 2021-2031 (USD Bn, AGR (%), CAGR (%)) (L-Shape Recovery)
Table 185 Asia-Pacific Dermatological Drugs Market by Acne Drugs, 2021-2031 (USD Bn, AGR (%), CAGR (%))
Table 186 Asia Pacific Dermatological Drugs Market by Acne Drugs, 2021-2031 (USD Bn, AGR (%), CAGR (%)) (V-Shape Recovery)
Table 187 Asia Pacific Dermatological Drugs Market by Acne Drugs, 2021-2031 (USD Bn, AGR (%), CAGR (%)) (W-Shape Recovery)
Table 188 Asia Pacific Dermatological Drugs Market by Acne Drugs, 2021-2031 (USD Bn, AGR (%), CAGR (%)) (U-Shape Recovery)
Table 189 Asia Pacific Dermatological Drugs Market by Acne Drugs, 2021-2031 (USD Bn, AGR (%), CAGR (%)) (L-Shape Recovery)
Table 190 Asia Pacific Dermatological Drugs Market by Route of Administration, 2021-2031 (USD Bn, AGR (%), CAGR (%))
Table 191 Asia Pacific Dermatological Drugs Market by Route of Administration, 2021-2031 (USD Bn, AGR (%), CAGR (%)) (V-Shape Recovery)
Table 192 Asia Pacific Dermatological Drugs Market by Route of Administration, 2021-2031 (USD Bn, AGR (%), CAGR (%)) (W-Shape Recovery)
Table 193 Asia Pacific Dermatological Drugs Market by Route of Administration, 2021-2031 (USD Bn, AGR (%), CAGR (%)) (U-Shape Recovery)
Table 194 Asia Pacific Dermatological Drugs Market by Route of Administration, 2021-2031 (USD Bn, AGR (%), CAGR (%)) (L-Shape Recovery)
Table 195 China Dermatological Drugs Market by Value, 2021-2031 (USD Bn, AGR (%), CAGR (%))
Table 196 China Dermatological Drugs Market by Value, 2021-2031 (USD Bn, AGR (%), CAGR (%)) (V-Shape Recovery)
Table 197 China Dermatological Drugs Market by Value, 2021-2031 (USD Bn, AGR (%), CAGR (%)) (W-Shape Recovery)
Table 198 China Dermatological Drugs Market by Value, 2021-2031 (USD Bn, AGR (%), CAGR (%)) (U-Shape Recovery)
Table 199 China Dermatological Drugs Market by Value, 2021-2031 (USD Bn, AGR (%), CAGR (%)) (L-Shape Recovery)
Table 200 India Dermatological Drugs Market by Value, 2021-2031 (USD Bn, AGR (%), CAGR (%))
Table 201 India Dermatological Drugs Market by Value, 2021-2031 (USD Bn, AGR (%), CAGR (%)) (V-Shape Recovery)
Table 202 India Dermatological Drugs Market by Value, 2021-2031 (USD Bn, AGR (%), CAGR (%)) (W-Shape Recovery)
Table 203 India Dermatological Drugs Market by Value, 2021-2031 (USD Bn, AGR (%), CAGR (%)) (U-Shape Recovery)
Table 204 India Dermatological Drugs Market by Value, 2021-2031 (USD Bn, AGR (%), CAGR (%)) (L-Shape Recovery)
Table 205 Japan Dermatological Drugs Market by Value, 2021-2031 (USD Bn, AGR (%), CAGR (%))
Table 206 Japan Dermatological Drugs Market by Value, 2021-2031 (USD Bn, AGR (%), CAGR (%)) (V-Shape Recovery)
Table 207 Japan Dermatological Drugs Market by Value, 2021-2031 (USD Bn, AGR (%), CAGR (%)) (W-Shape Recovery)
Table 208 Japan Dermatological Drugs Market by Value, 2021-2031 (USD Bn, AGR (%), CAGR (%)) (U-Shape Recovery)
Table 209 Japan Dermatological Drugs Market by Value, 2021-2031 (USD Bn, AGR (%), CAGR (%)) (L-Shape Recovery)
Table 210 South Korea Dermatological Drugs Market by Value, 2021-2031 (USD Bn, AGR (%), CAGR (%))
Table 211 South Korea Dermatological Drugs Market by Value, 2021-2031 (USD Bn, AGR (%), CAGR (%)) (V-Shape Recovery)
Table 212 South Korea Dermatological Drugs Market by Value, 2021-2031 (USD Bn, AGR (%), CAGR (%)) (W-Shape Recovery)
Table 213 South Korea Dermatological Drugs Market by Value, 2021-2031 (USD Bn, AGR (%), CAGR (%)) (U-Shape Recovery)
Table 214 South Korea Dermatological Drugs Market by Value, 2021-2031 (USD Bn, AGR (%), CAGR (%)) (L-Shape Recovery)
Table 215 Australia Dermatological Drugs Market by Value, 2021-2031 (USD Bn, AGR (%), CAGR (%))
Table 216 Australia Dermatological Drugs Market by Value, 2021-2031 (USD Bn, AGR (%), CAGR (%)) (V-Shape Recovery)
Table 217 Australia Dermatological Drugs Market by Value, 2021-2031 (USD Bn, AGR (%), CAGR (%)) (W-Shape Recovery)
Table 218 Australia Dermatological Drugs Market by Value, 2021-2031 (USD Bn, AGR (%), CAGR (%)) (U-Shape Recovery)
Table 219 Australia Dermatological Drugs Market by Value, 2021-2031 (USD Bn, AGR (%), CAGR (%)) (L-Shape Recovery)
Table 220 Rest of Asia-Pacific Dermatological Drugs Market by Value, 2021-2031 (USD Bn, AGR (%), CAGR (%))
Table 221 Rest of Asia-Pacific Dermatological Drugs Market by Value, 2021-2031 (USD Bn, AGR (%), CAGR (%)) (V-Shape Recovery)
Table 222 Rest of Asia-Pacific Dermatological Drugs Market by Value, 2021-2031 (USD Bn, AGR (%), CAGR (%)) (W-Shape Recovery)
Table 223 Rest of Asia-Pacific Dermatological Drugs Market by Value, 2021-2031 (USD Bn, AGR (%), CAGR (%)) (U-Shape Recovery)
Table 224 Rest of Asia-Pacific Dermatological Drugs Market by Value, 2021-2031 (USD Bn, AGR (%), CAGR (%)) (L-Shape Recovery)
Table 225 LAMEA Dermatological Drugs Market by Value, 2021-2031 (USD Bn, AGR (%), CAGR (%))
Table 226 LAMEA Dermatological Drugs Market Forecast, 2021-2031 (USD Bn, AGR (%), CAGR (%)) (V-Shape Recovery)
Table 227 LAMEA Dermatological Drugs Market Forecast, 2021-2031 (USD Bn, AGR (%), CAGR (%)) (W-Shape Recovery)
Table 228 LAMEA Dermatological Drugs Market Forecast, 2021-2031 (USD Bn, AGR (%), CAGR (%)) (U-Shape Recovery)
Table 229 LAMEA Dermatological Drugs Market Forecast, 2021-2031 (USD Bn, AGR (%), CAGR (%)) (L-Shape Recovery)
Table 230 LAMEA Dermatological Drugs Market by Disease, 2021-2031 (USD Bn, AGR (%), CAGR (%))
Table 231 LAMEA Dermatological Drugs Market by Disease, 2021-2031 (USD Bn, AGR (%), CAGR (%)) (V-Shape Recovery)
Table 232 LAMEA Dermatological Drugs Market by Disease, 2021-2031 (USD Bn, AGR (%), CAGR (%)) (W-Shape Recovery)
Table 233 LAMEA Dermatological Drugs Market by Disease, 2021-2031 (USD Bn, AGR (%), CAGR (%)) (U-Shape Recovery)
Table 234 LAMEA Dermatological Drugs Market by Disease, 2021-2031 (USD Bn, AGR (%), CAGR (%)) (L-Shape Recovery)
Table 235 LAMEA Dermatological Drugs Market by Skin Infections Drugs, 2021-2031 (USD Bn, AGR (%), CAGR (%))
Table 236 LAMEA Dermatological Drugs Market by Skin Infections Drugs, 2021-2031 (USD Bn, AGR (%), CAGR (%)) (V-Shape Recovery)
Table 237 LAMEA Dermatological Drugs Market by Skin Infections Drugs, 2021-2031 (USD Bn, AGR (%), CAGR (%)) (W-Shape Recovery)
Table 238 LAMEA Dermatological Drugs Market by Skin Infections Drugs, 2021-2031 (USD Bn, AGR (%), CAGR (%)) (U-Shape Recovery)
Table 239 LAMEA Dermatological Drugs Market by Skin Infections Drugs, 2021-2031 (USD Bn, AGR (%), CAGR (%)) (L-Shape Recovery)
Table 240 LAMEA Dermatological Drugs Market by Psoriasis Drugs, 2021-2031 (USD Bn, AGR (%), CAGR (%))
Table 241 LAMEA Dermatological Drugs Market by Psoriasis Drugs, 2021-2031 (USD Bn, AGR (%), CAGR (%)) (V-Shape Recovery)
Table 242 LAMEA Dermatological Drugs Market by Psoriasis Drugs, 2021-2031 (USD Bn, AGR (%), CAGR (%)) (W-Shape Recovery)
Table 243 LAMEA Dermatological Drugs Market by Psoriasis Drugs, 2021-2031 (USD Bn, AGR (%), CAGR (%)) (U-Shape Recovery)
Table 244 LAMEA Dermatological Drugs Market by Psoriasis Drugs, 2021-2031 (USD Bn, AGR (%), CAGR (%)) (L-Shape Recovery)
Table 245 LAMEA Dermatological Drugs Market by Dermatitis Drugs, 2021-2031 (USD Bn, AGR (%), CAGR (%))
Table 246 LAMEA Dermatological Drugs Market by Dermatitis Drugs, 2021-2031 (USD Bn, AGR (%), CAGR (%)) (V-Shape Recovery)
Table 247 LAMEA Dermatological Drugs Market by Dermatitis Drugs, 2021-2031 (USD Bn, AGR (%), CAGR (%)) (W-Shape Recovery)
Table 248 LAMEA Dermatological Drugs Market by Dermatitis Drugs, 2021-2031 (USD Bn, AGR (%), CAGR (%)) (U-Shape Recovery)
Table 249 LAMEA Dermatological Drugs Market by Dermatitis Drugs, 2021-2031 (USD Bn, AGR (%), CAGR (%)) (L-Shape Recovery)
Table 250 LAMEA Dermatological Drugs Market by Acne Drugs, 2021-2031 (USD Bn, AGR (%), CAGR (%))
Table 251 LAMEA Dermatological Drugs Market by Acne Drugs, 2021-2031 (USD Bn, AGR (%), CAGR (%)) (V-Shape Recovery)
Table 252 LAMEA Dermatological Drugs Market by Acne Drugs, 2021-2031 (USD Bn, AGR (%), CAGR (%)) (W-Shape Recovery)
Table 253 LAMEA Dermatological Drugs Market by Acne Drugs, 2021-2031 (USD Bn, AGR (%), CAGR (%)) (U-Shape Recovery)
Table 254 LAMEA Dermatological Drugs Market by Acne Drugs, 2021-2031 (USD Bn, AGR (%), CAGR (%)) (L-Shape Recovery)
Table 255 LAMEA Dermatological Drugs Market by Route of Administration, 2021-2031 (USD Bn, AGR (%), CAGR (%))
Table 256 LAMEA Dermatological Drugs Market by Route of Administration, 2021-2031 (USD Bn, AGR (%), CAGR (%)) (V-Shape Recovery)
Table 257 LAMEA Dermatological Drugs Market by Route of Administration, 2021-2031 (USD Bn, AGR (%), CAGR (%)) (W-Shape Recovery)
Table 258 LAMEA Dermatological Drugs Market by Route of Administration, 2021-2031 (USD Bn, AGR (%), CAGR (%)) (U-Shape Recovery)
Table 259 LAMEA Dermatological Drugs Market by Route of Administration, 2021-2031 (USD Bn, AGR (%), CAGR (%)) (L-Shape Recovery)
Table 260 Brazil Dermatological Drugs Market by Country, 2021-2031 (USD Bn, AGR (%), CAGR (%))
Table 261 Brazil Dermatological Drugs Market by Country, 2021-2031 (USD Bn, AGR (%), CAGR (%)) (V-Shape Recovery)
Table 262 Brazil Dermatological Drugs Market by Country, 2021-2031 (USD Bn, AGR (%), CAGR (%)) (W-Shape Recovery)
Table 263 Brazil Dermatological Drugs Market by Country, 2021-2031 (USD Bn, AGR (%), CAGR (%)) (U-Shape Recovery)
Table 264 Brazil Dermatological Drugs Market by Country, 2021-2031 (USD Bn, AGR (%), CAGR (%)) (L-Shape Recovery)
Table 265 Saudi Arabia Dermatological Drugs Market by Country, 2021-2031 (USD Bn, AGR (%), CAGR (%))
Table 266 Saudi Arabia Dermatological Drugs Market by Country, 2021-2031 (USD Bn, AGR (%), CAGR (%)) (V-Shape Recovery)
Table 267 Saudi Arabia Dermatological Drugs Market by Country, 2021-2031 (USD Bn, AGR (%), CAGR (%)) (W-Shape Recovery)
Table 268 Saudi Arabia Dermatological Drugs Market by Country, 2021-2031 (USD Bn, AGR (%), CAGR (%)) (U-Shape Recovery)
Table 269 Saudi Arabia Dermatological Drugs Market by Country, 2021-2031 (USD Bn, AGR (%), CAGR (%)) (L-Shape Recovery)
Table 270 South Africa Dermatological Drugs Market by Country, 2021-2031 (USD Bn, AGR (%), CAGR (%))
Table 271 South Africa Dermatological Drugs Market by Country, 2021-2031 (USD Bn, AGR (%), CAGR (%)) (V-Shape Recovery)
Table 272 South Africa Dermatological Drugs Market by Country, 2021-2031 (USD Bn, AGR (%), CAGR (%)) (W-Shape Recovery)
Table 273 South Africa Dermatological Drugs Market by Country, 2021-2031 (USD Bn, AGR (%), CAGR (%)) (U-Shape Recovery)
Table 274 South Africa Dermatological Drugs Market by Country, 2021-2031 (USD Bn, AGR (%), CAGR (%)) (L-Shape Recovery)
Table 275 Mexico Dermatological Drugs Market by Country, 2021-2031 (USD Bn, AGR (%), CAGR (%))
Table 276 Mexico Dermatological Drugs Market by Country, 2021-2031 (USD Bn, AGR (%), CAGR (%)) (V-Shape Recovery)
Table 277 Mexico Dermatological Drugs Market by Country, 2021-2031 (USD Bn, AGR (%), CAGR (%)) (W-Shape Recovery)
Table 278 Mexico Dermatological Drugs Market by Country, 2021-2031 (USD Bn, AGR (%), CAGR (%)) (U-Shape Recovery)
Table 279 Mexico Dermatological Drugs Market by Country, 2021-2031 (USD Bn, AGR (%), CAGR (%)) (L-Shape Recovery)
Table 280 UAE Dermatological Drugs Market by Country, 2021-2031 (USD Bn, AGR (%), CAGR (%))
Table 281 UAE Dermatological Drugs Market by Country, 2021-2031 (USD Bn, AGR (%), CAGR (%)) (V-Shape Recovery)
Table 282 UAE Dermatological Drugs Market by Country, 2021-2031 (USD Bn, AGR (%), CAGR (%)) (W-Shape Recovery)
Table 283 UAE Dermatological Drugs Market by Country, 2021-2031 (USD Bn, AGR (%), CAGR (%)) (U-Shape Recovery)
Table 284 UAE Dermatological Drugs Market by Country, 2021-2031 (USD Bn, AGR (%), CAGR (%)) (L-Shape Recovery)
Table 285 Rest of LAMEA Dermatological Drugs Market by Country, 2021-2031 (USD Bn, AGR (%), CAGR (%))
Table 286 Rest of LAMEA Dermatological Drugs Market by Country, 2021-2031 (USD Bn, AGR (%), CAGR (%)) (V-Shape Recovery)
Table 287 Rest of LAMEA Dermatological Drugs Market by Country, 2021-2031 (USD Bn, AGR (%), CAGR (%)) (W-Shape Recovery)
Table 288 Rest of LAMEA Dermatological Drugs Market by Country, 2021-2031 (USD Bn, AGR (%), CAGR (%)) (U-Shape Recovery)
Table 289 Rest of LAMEA Dermatological Drugs Market by Country, 2021-2031 (USD Bn, AGR (%), CAGR (%)) (L-Shape Recovery)
Table 290. Abbott Laboratories: Company Information
Table 291. Abbott Laboratories: Company Revenue 2015-2019 (US$ Million, AGR %)
Table 292. Abbott Laboratories: Company Product and Service Offerings
Table 293. Abbott Laboratories: Company Product Pipeline
Table 294. Abbott Laboratories: Company Recent Developments till Sept,2020
Table 295. AbbVie Inc: Company Information
Table 296. AbbVie Inc: Company Revenue 2015-2019 (US$ Million, AGR %)
Table 297. AbbVie Inc: Company Product and Service Benchmarking
Table 298. AbbVie Inc: Company Product Pipeline
Table 299. AbbVie Inc: Company Recent Developments till December,2020
Table 300. Bayer Pharmaceuticals: Company Information
Table 301. Bayer Pharmaceuticals: Company Revenue 2015-2019 (US$ Million, AGR %)
Table 302. Bayer Pharmaceuticals: Company Product and Service Benchmarking
Table 303. Bayer Pharmaceuticals: Company Product Pipeline
Table 304. Bayer Pharmaceuticals: Company Recent Developments till December,2020
Table 305. Bristol-Myers Squibb: Company Information
Table 306. Bristol-Myers Squibb: Company Revenue 2015-2019 (US$ Million, AGR %)
Table 307. Bristol-Myers Squibb: Company Product and Service Benchmarking
Table 308. Bristol-Myers Squibb: Company Product Pipeline
Table 309. Bristol-Myers Squibb: Company Recent Developments till December,2020
Table 310. Zydus Cadila Healthcare Pharmaceuticals: Company Information
Table 311. Zydus Cadila Healthcare Pharmaceuticals: Company Revenue 2015-2019 (US$ Million, AGR %)
Table 312. Zydus Cadila Healthcare Pharmaceuticals: Company Product and Service Benchmarking
Table 313. Zydus Cadila Healthcare Pharmaceuticals: Company Recent Developments till December,2020
Table 314. Cipla Pharmaceutical: Company Information
Table 315. Cipla Pharmaceutical: Company Revenue 2015-2019 (US$ Million, AGR %)
Table 316. Cipla Pharmaceutical: Company Product and Service Benchmarking
Table 317. Cipla Pharmaceutical: Company Product Pipeline
Table 318. Cipla Pharmaceutical: Company Recent Developments till December,2020
Table 319. Dr. Reddy’s Laboratories: Company Information
Table 320. Dr. Reddy’s Laboratories: Company Revenue 2015-2019 (US$ Million, AGR %)
Table 321. Dr. Reddy’s Laboratories: Company Product and Service Benchmarking
Table 322. Dr. Reddy’s Laboratories: Company Product Pipeline
Table 323. Dr. Reddy’s Laboratories: Company Recent Developments till December,2020
Table 324. Eli Lilly and Company: Company Information
Table 325. Eli Lilly and Company: Company Revenue 2015-2019 (US$ Million, AGR %)
Table 326. Eli Lilly and Company: Company Product and Service Benchmarking
Table 327. Eli Lilly and Company: Company Product Pipeline
Table 328. Eli Lilly and Company: Company Recent Developments till December,2020
Table 329. GlaxoSmithKline: Company Information
Table 330. GlaxoSmithKline: Company Revenue 2015-2019 (US$ Million, AGR %)
Table 331. GlaxoSmithKline: Company Product and Service Benchmarking
Table 332. GlaxoSmithKline: Company Product Pipeline
Table 333. GlaxoSmithKline: Company Recent Developments till December,2020
Table 334. Glenmark Pharmaceuticals Limited: Company Information
Table 335. Glenmark Pharmaceuticals Limited: Company Revenue 2015-2019 (US$ Million, AGR %)
Table 336. Glenmark Pharmaceuticals Limited: Company Product and Service Benchmarking
Table 337. Glenmark Pharmaceuticals Limited: Company Product Pipeline
Table 338. Glenmark Pharmaceuticals Limited: Company Recent Developments till December,2020
Table 339. Johnson & Johnson Inc: Company Information
Table 340. Johnson & Johnson Inc: Company Revenue 2015-2019 (US$ Million, AGR %)
Table 341. Johnson & Johnson Inc: Company Product and Service Benchmarking
Table 342. Johnson & Johnson Inc: Company Product Pipeline
Table 343. Johnson & Johnson Inc: Company Recent Developments till December,2020
Table 344. L’Oréal Cosmetics: Company Information
Table 345. L’Oréal Cosmetics: Company Revenue 2015-2019 (US$ Million, AGR %)
Table 346. L’Oréal Cosmetics: Company Product and Service Benchmarking
Table 347. L’Oréal Cosmetics: Company Recent Developments till December,2020
Table 348. Lupin Limited: Company Information
Table 349. Lupin Limited: Company Revenue 2015-2019 (US$ Million, AGR %)
Table 350. Lupin Limited: Company Product and Service Benchmarking
Table 351. Lupin Limited: Company Recent Developments till December,2020
Table 352. Merck Group Chemicals: Company Information
Table 353. Merck Group Chemicals: Company Revenue 2015-2019 (US$ Million, AGR %)
Table 354. Merck Group Chemicals: Company Product and Service Benchmarking
Table 355. Merck Group Chemicals: Company Product Pipeline
Table 356. Merck Group Chemicals: Company Recent Developments till December,2020
Table 357. Pfizer Inc: Company Information
Table 358. Pfizer Inc: Company Revenue 2015-2019 (US$ Million, AGR %)
Table 359. Pfizer Inc: Company Product and Service Benchmarking
Table 360. Pfizer Inc: Company Product Pipeline
Table 361. Pfizer Inc: Company Recent Developments till December,2020
Table 362. F. Hoffmann-La Roche Ltd: Company Information
Table 363. F. Hoffmann-La Roche Ltd: Company Revenue 2015-2019 (US$ Million, AGR %)
Table 364. F. Hoffmann-La Roche Ltd: Company Product and Service Benchmarking
Table 365. F. Hoffmann-La Roche Ltd: Company Product Pipeline
Table 366. F. Hoffmann-La Roche Ltd: Company Recent Developments till December,2020
Table 367. Sanofi Pasteur Pharmaceutical: Company Information
Table 368. Sanofi Pasteur Pharmaceutical: Company Revenue 2015-2019 (US$ Million, AGR %)
Table 369. Sanofi Pasteur Pharmaceutical: Company Product and Service Benchmarking
Table 370. Sanofi Pasteur Pharmaceutical: Company Product Pipeline
Table 371. Sanofi Pasteur Pharmaceutical: Company Recent Developments till December,2020
Table 372. Sun Pharmaceutical Industries Limited: Company Information
Table 373. Sun Pharmaceutical Industries Limited: Company Revenue 2015-2019 (US$ Million, AGR %)
Table 374. Sun Pharmaceutical Industries Limited: Company Product and Service Benchmarking
Table 375. Sun Pharmaceutical Industries Limited: Company Product Pipeline
Table 376. Sun Pharmaceutical Industries Limited: Company Recent Developments till December,2020
Table 377. Takeda Pharmaceuticals: Company Information
Table 378. Takeda Pharmaceuticals: Company Revenue 2015-2019 (US$ Million, AGR %)
Table 379. Takeda Pharmaceuticals: Company Product and Service Benchmarking
Table 380. Takeda Pharmaceuticals: Company Product Pipeline
Table 381. Takeda Pharmaceuticals: Company Recent Developments till December,2020
Table 382. Taro Pharmaceutical Industries Ltd: Company Information
Table 383. Taro Pharmaceutical Industries Ltd: Company Revenue 2015-2019 (US$ Million, AGR %)
Table 384. Taro Pharmaceutical Industries Ltd: Company Product and Service Benchmarking
Table 385. Taro Pharmaceutical Industries Ltd: Company Recent Developments till December,2020
Table 386. Asia-Pacific Dermatological Drugs Market by Value, 2021-2031 (USD Bn, AGR (%), CAGR (%))
List of Figures
Figure 1 Global Dermatological Drugs Market Segmentation
Figure 2 Global Dermatological Drugs Market: Market Trends
Figure 3 Global Dermatological Drugs Market: SWOT Analysis
Figure 4 Global Dermatological Drugs Market: Porter’s Five Forces Analysis
Figure 5 Global Dermatological Drugs Market Forecast, 2021-2031 (USD Bn, AGR (%))
Figure 6 Global Dermatological Drugs Market Forecast, 2021-2031 (USD Bn, AGR (%)) (V-Shape Recovery)
Figure 7 Global Dermatological Drugs Market Forecast, 2021-2031 (USD Bn, AGR (%)) (W-Shape Recovery)
Figure 8 Global Dermatological Drugs Market Forecast, 2021-2031 (USD Bn, AGR (%),CAGR(%)) (U-Shape Recovery)
Figure 9 Global Dermatological Drugs Market Forecast, 2021-2031 (USD Bn, AGR (%),CAGR(%)) (L-Shape Recovery)
Figure 10 Global Dermatological Drugs Market Share Forecast by 2021, 2026, 2031 (%)
Figure 11 Global Dermatological Drugs Market by Region, 2021-2031 (USD Bn, AGR (%)
Figure 12 Global Dermatological Drugs Market by Region, 2021-2031 (USD Bn, AGR (%) (V-Shape Recovery)
Figure 13 Global Dermatological Drugs Market by Region, 2021-2031 (USD Bn, AGR (%) (W-Shape Recovery)
Figure 14 Global Dermatological Drugs Market by Region, 2021-2031 (USD Bn, AGR (%) (U-Shape Recovery)
Figure 15 Global Dermatological Drugs Market by Region, 2021-2031 (USD Bn, AGR (%) (L-Shape Recovery)
Figure 16 Global Dermatological Drugs Market Share Forecast by Disease 2021, 2026, 2031 (%)
Figure 17 Global Dermatological Drugs Market by Disease, 2021-2031 (USD Bn, AGR (%)
Figure 18 Global Dermatological Drugs Market by Disease, 2021-2031 (USD Bn, AGR (%)) (V-Shape Recovery)
Figure 19 Global Dermatological Drugs Market by Disease, 2021-2031 (USD Bn, AGR (%)) (W-Shape Recovery)
Figure 20 Global Dermatological Drugs Market by Disease, 2021-2031 (USD Bn, AGR (%)) (U-Shape Recovery)
Figure 21 Global Dermatological Drugs Market by Disease, 2021-2031 (USD Bn, AGR (%)) (L-Shape Recovery)
Figure 22 Global Dermatological Drugs Market Share Forecast by Skin Infection 2021, 2026, 2031 (%)
Figure 23 Global Dermatological Drugs Market by Skin Infections Drugs, 2021-2031 (USD Bn, AGR (%)
Figure 24 Global Dermatological Drugs Market by Skin Infections Drugs, 2021-2031 (USD Bn, AGR (%)) (V-Shape Recovery)
Figure 25 Global Dermatological Drugs Market by Skin Infections Drugs, 2021-2031 (USD Bn, AGR (%)) (W-Shape Recovery)
Figure 26 Global Dermatological Drugs Market by Skin Infections Drugs, 2021-2031 (USD Bn, AGR (%)) (U-Shape Recovery)
Figure 27 Global Dermatological Drugs Market by Skin Infections Drugs, 2021-2031 (USD Bn, AGR (%)) (L-Shape Recovery)
Figure 28 Global Dermatological Drugs Market Share Forecast by Psoriasis Drugs 2021, 2026, 2031 (%)
Figure 29 Global Dermatological Drugs Market by Psoriasis Drugs, 2021-2031 (USD Bn, AGR (%)
Figure 30 Global Dermatological Drugs Market by Psoriasis Drugs, 2021-2031 (USD Bn, AGR (%)) (V-Shape Recovery)
Figure 31 Global Dermatological Drugs Market by Psoriasis Drugs, 2021-2031 (USD Bn, AGR (%)) (W-Shape Recovery)
Figure 32 Global Dermatological Drugs Market by Psoriasis Drugs, 2021-2031 (USD Bn, AGR (%)) (U-Shape Recovery)
Figure 33 Global Dermatological Drugs Market by Psoriasis Drugs, 2021-2031 (USD Bn, AGR (%)) (L-Shape Recovery)
Figure 34 Global Dermatological Drugs Market Share Forecast by Dermatitis Drugs 2021, 2026, 2031 (%)
Figure 35 Global Dermatological Drugs Market by Dermatitis Drugs, 2021-2031 (USD Bn, AGR (%)
Figure 36 Global Dermatological Drugs Market by Dermatitis Drugs, 2021-2031 (USD Bn, AGR (%)) (V-Shape Recovery)
Figure 37 Global Dermatological Drugs Market by Dermatitis Drugs, 2021-2031 (USD Bn, AGR (%)) (W-Shape Recovery)
Figure 38 Global Dermatological Drugs Market by Dermatitis Drugs, 2021-2031 (USD Bn, AGR (%)) (U-Shape Recovery)
Figure 39 Global Dermatological Drugs Market by Dermatitis Drugs, 2021-2031 (USD Bn, AGR (%)) (L-Shape Recovery)
Figure 40 Global Dermatological Drugs Market Share Forecast by Acne Drugs 2021, 2026, 2031 (%)
Figure 41 Global Dermatological Drugs Market by Acne Drugs, 2021-2031 (USD Bn, AGR (%))
Figure 42 Global Dermatological Drugs Market by Acne Drugs, 2021-2031 (USD Bn, AGR (%)) (V-Shape Recovery)
Figure 43 Global Dermatological Drugs Market by Acne Drugs, 2021-2031 (USD Bn, AGR (%)) (W-Shape Recovery)
Figure 44 Global Dermatological Drugs Market by Acne Drugs, 2021-2031 (USD Bn, AGR (%)) (U-Shape Recovery)
Figure 45 Global Dermatological Drugs Market by Acne Drugs, 2021-2031 (USD Bn, AGR (%)) (L-Shape Recovery)
Figure 46 Global Dermatological Drugs Market Share Forecast by Route of Administration 2021, 2026, 2031 (%)
Figure 47 Global Dermatological Drugs Market by Route of Administration, 2021-2031 (USD Bn, AGR (%))
Figure 48 Global Dermatological Drugs Market by Route of Administration, 2021-2031 (USD Bn, AGR (%)) (V-Shape Recovery)
Figure 49 Global Dermatological Drugs Market by Route of Administration, 2021-2031 (USD Bn, AGR (%)) (W-Shape Recovery)
Figure 50 Global Dermatological Drugs Market by Route of Administration, 2021-2031 (USD Bn, AGR (%)) (U-Shape Recovery)
Figure 51 Global Dermatological Drugs Market by Route of Administration, 2021-2031 (USD Bn, AGR (%)) (L-Shape Recovery)
Figure 52 North America Dermatological Drugs Market by Value, 2021-2031 (USD Bn, AGR (%))
Figure 53 North America Dermatological Drugs Market by Value, 2021-2031 (USD Bn, AGR (%)) (V-Shape Recovery)
Figure 54 North America Dermatological Drugs Market by Value, 2021-2031 (USD Bn, AGR (%)) (W-Shape Recovery)
Figure 55 North America Dermatological Drugs Market by Value, 2021-2031 (USD Bn, AGR (%)) (U-Shape Recovery)
Figure 56 North America Dermatological Drugs Market by Value, 2021-2031 (USD Bn, AGR (%), CAGR(%)) (L-Shape Recovery)
Figure 57 Global Dermatological Drugs Market Share Forecast by Country 2021, 2026, 2031 (%)
Figure 58 North America Market by Country Forecast 2021-2031 (US$Bn, AGR %) (Pre COVID)
Figure 59 North America Market by Country Forecast 2021-2031 (US$Bn, AGR %) (Pre COVID) (V-Shape Recovery)
Figure 60 North America Market by Country Forecast 2021-2031 (US$Bn, AGR %) (Pre COVID) (W-Shape Recovery)
Figure 61 North America Market by Country Forecast 2021-2031 (US$Bn, AGR %) (Pre COVID) (U-Shape Recovery)
Figure 62 North America Market by Country Forecast 2021-2031 (US$Bn, AGR %) (Pre COVID) (L-Shape Recovery)
Figure 63 Market Forecast 2021-2031 (US$Bn, AGR %) (Pre COVID)
Figure 64 North America Dermatological Drugs Market by Disease, 2021-2031 (USD Bn, AGR (%)) (V-Shape Recovery)
Figure 65 North America Dermatological Drugs Market by Disease, 2021-2031 (USD Bn, AGR (%)) (W-Shape Recovery)
Figure 66 North America Dermatological Drugs Market by Disease, 2021-2031 (USD Bn, AGR (%)) (U-Shape Recovery)
Figure 67 North America Dermatological Drugs Market by Disease, 2021-2031 (USD Bn, AGR (%)) (L-Shape Recovery)
Figure 68 Market Forecast 2021-2031 (US$Bn, AGR %) (Pre COVID)
Figure 69 North America Dermatological Drugs Market by Skin Infections Drugs, 2021-2031 (USD Bn, AGR (%)) (V-Shape Recovery)
Figure 70 North America Dermatological Drugs Market by Skin Infections Drugs, 2021-2031 (USD Bn, AGR (%)) (W-Shape Recovery)
Figure 71 North America Dermatological Drugs Market by Skin Infections Drugs, 2021-2031 (USD Bn, AGR (%)) (U-Shape Recovery)
Figure 72 North America Dermatological Drugs Market by Skin Infections Drugs, 2021-2031 (USD Bn, AGR (%)) (L-Shape Recovery)
Figure 73 Market Forecast 2021-2031 (US$Bn, AGR %) (Pre COVID) Figure 74 North America Dermatological Drugs Market by Psoriasis Drugs, 2021-2031 (USD Bn, AGR (%)) (V-Shape Recovery)
Figure 75 North America Dermatological Drugs Market by Psoriasis Drugs, 2021-2031 (USD Bn, AGR (%)) (W-Shape Recovery)
Figure 76 North America Dermatological Drugs Market by Psoriasis Drugs, 2021-2031 (USD Bn, AGR (%)) (U-Shape Recovery)
Figure 77 North America Dermatological Drugs Market by Psoriasis Drugs, 2021-2031 (USD Bn, AGR (%)) (L-Shape Recovery)
Figure 78 North America Market by Dermatitis Drugs Forecast 2021-2031 (US$Bn, AGR %) (Pre COVID)
Figure 79 North America Dermatological Drugs Market by Dermatitis Drugs, 2021-2031 (USD Bn, AGR (%)) (V-Shape Recovery)
Figure 80 North America Dermatological Drugs Market by Dermatitis Drugs, 2021-2031 (USD Bn, AGR (%)) (W-Shape Recovery)
Figure 81 North America Dermatological Drugs Market by Dermatitis Drugs, 2021-2031 (USD Bn, AGR (%)) (U-Shape Recovery)
Figure 82 North America Dermatological Drugs Market by Dermatitis Drugs, 2021-2031 (USD Bn, AGR (%)) (L-Shape Recovery)
Figure 83 Market Forecast 2021-2031 (US$Bn, AGR %) (Pre COVID)
Figure 84 North America Dermatological Drugs Market by Acne Drugs, 2021-2031 (USD Bn, AGR (%)) (V-Shape Recovery)
Figure 85 North America Dermatological Drugs Market by Acne Drugs, 2021-2031 (USD Bn, AGR (%)) (W-Shape Recovery)
Figure 86 North America Dermatological Drugs Market by Acne Drugs, 2021-2031 (USD Bn, AGR (%)) (U-Shape Recovery)
Figure 87 North America Dermatological Drugs Market by Acne Drugs, 2021-2031 (USD Bn, AGR (%)) (L-Shape Recovery)
Figure 88 Market Forecast 2021-2031 (US$Bn, AGR %) (Pre COVID)
Figure 89 North America Dermatological Drugs Market by Route of Administration, 2021-2031 (USD Bn, AGR (%)) (V-Shape Recovery)
Figure 90 North America Dermatological Drugs Market by Route of Administration, 2021-2031 (USD Bn, AGR (%)) (W-Shape Recovery)
Figure 91 North America Dermatological Drugs Market by Route of Administration, 2021-2031 (USD Bn, AGR (%)) (U-Shape Recovery)
Figure 92 North America Dermatological Drugs Market by Route of Administration, 2021-2031 (USD Bn, AGR (%)) (L-Shape Recovery)
Figure 93 Europe Dermatological Drugs Market by Value 2021-2031 (US$Bn, AGR %) (Pre COVID)
Figure 94 Europe Dermatological Drugs Market Forecast, 2021-2031 (USD Bn, AGR (%)) (V-Shape Recovery)
Figure 95 Europe Dermatological Drugs Market Forecast, 2021-2031 (USD Bn, AGR (%)) (W-Shape Recovery)
Figure 96 Europe Dermatological Drugs Market Forecast, 2021-2031 (USD Bn, AGR (%)) (U-Shape Recovery)
Figure 97 Europe Dermatological Drugs Market Forecast, 2021-2031 (USD Bn, AGR (%)) (L-Shape Recovery)
Figure 98 Europe Dermatological Drugs Market Share Forecast by Country 2021, 2026, 2031 (%)
Figure 99 Market Forecast 2021-2031 (US$Bn, AGR %) (Pre COVID)
Figure 100 Market Forecast 2021-2031 (US$Bn, AGR %) (Pre COVID) (V-Shape Recovery)
Figure 101 Market Forecast 2021-2031 (US$Bn, AGR %) (Pre COVID) (W-Shape Recovery)
Figure 102 Market Forecast 2021-2031 (US$Bn, AGR %) (Pre COVID) (U-Shape Recovery)
Figure 103 Market Forecast 2021-2031 (US$Bn, AGR %) (Pre COVID) (L-Shape Recovery)
Figure 104 Market Forecast 2021-2031 (US$Bn, AGR %) (Pre COVID)
Figure 105 Europe Dermatological Drugs Market by Disease, 2021-2031 (USD Bn, AGR (%)) (V-Shape Recovery)
Figure 106 Europe Dermatological Drugs Market by Disease, 2021-2031 (USD Bn, AGR (%)) (W-Shape Recovery)
Figure 107 Europe Dermatological Drugs Market by Disease, 2021-2031 (USD Bn, AGR (%)) (U-Shape Recovery)
Figure 108 Europe Dermatological Drugs Market by Disease, 2021-2031 (USD Bn, AGR (%)) (L-Shape Recovery)
Figure 109 Market Forecast 2021-2031 (US$Bn, AGR %) (Pre COVID)
Figure 110 Europe Dermatological Drugs Market by Skin Infections Drugs, 2021-2031 (USD Bn, AGR (%)) (V-Shape Recovery)
Figure 111 Europe Dermatological Drugs Market by Skin Infections Drugs, 2021-2031 (USD Bn, AGR (%)) (W-Shape Recovery)
Figure 112 Europe Dermatological Drugs Market by Skin Infections Drugs, 2021-2031 (USD Bn, AGR (%)) (U-Shape Recovery)
Figure 113 Europe Dermatological Drugs Market by Skin Infections Drugs, 2021-2031 (USD Bn, AGR (%)) (L-Shape Recovery)
Figure 114 Market Forecast 2021-2031 (US$Bn, AGR %) (Pre COVID)
Figure 115 Europe Dermatological Drugs Market by Psoriasis Drugs, 2021-2031 (USD Bn, AGR (%)) (V-Shape Recovery)
Figure 116 Europe Dermatological Drugs Market by Psoriasis Drugs, 2021-2031 (USD Bn, AGR (%)) (W-Shape Recovery)
Figure 117 Europe Dermatological Drugs Market by Psoriasis Drugs, 2021-2031 (USD Bn, AGR (%)) (U-Shape Recovery)
Figure 118 Europe Dermatological Drugs Market by Psoriasis Drugs, 2021-2031 (USD Bn, AGR (%)) (L-Shape Recovery)
Figure 119 Market Forecast 2021-2031 (US$Bn, AGR %) (Pre COVID)
Figure 120 Europe Dermatological Drugs Market by Dermatitis Drugs, 2021-2031 (USD Bn, AGR (%)) (V-Shape Recovery)
Figure 121 Europe Dermatological Drugs Market by Dermatitis Drugs, 2021-2031 (USD Bn, AGR (%)) (W-Shape Recovery)
Figure 122 Europe Dermatological Drugs Market by Dermatitis Drugs, 2021-2031 (USD Bn, AGR (%)) (U-Shape Recovery)
Figure 123 Europe Dermatological Drugs Market by Dermatitis Drugs, 2021-2031 (USD Bn, AGR (%)) (L-Shape Recovery)
Figure 124 Market Forecast 2021-2031 (US$Bn, AGR %) (Pre COVID)
Figure 125 Europe Dermatological Drugs Market by Acne Drugs, 2021-2031 (USD Bn, AGR (%)) (V-Shape Recovery)
Figure 126 Europe Dermatological Drugs Market by Acne Drugs, 2021-2031 (USD Bn, AGR (%)) (W-Shape Recovery)
Figure 127 Europe Dermatological Drugs Market by Acne Drugs, 2021-2031 (USD Bn, AGR (%)) (U-Shape Recovery)
Figure 128 Europe Dermatological Drugs Market by Acne Drugs, 2021-2031 (USD Bn, AGR (%)) (L-Shape Recovery)
Figure 129 Market Forecast 2021-2031 (US$Bn, AGR %) (Pre COVID)
Figure 130 Europe Dermatological Drugs Market by Route of Administration, 2021-2031 (USD Bn, AGR (%)) (V-Shape Recovery)
Figure 131 Europe Dermatological Drugs Market by Route of Administration, 2021-2031 (USD Bn, AGR (%)) (W-Shape Recovery)
Figure 132 Europe Dermatological Drugs Market by Route of Administration, 2021-2031 (USD Bn, AGR (%)) (U-Shape Recovery)
Figure 133 Europe Dermatological Drugs Market by Route of Administration, 2021-2031 (USD Bn, AGR (%)) (L-Shape Recovery)
Figure 134 Asia-Pacific Dermatological Drugs Market Forecast 2021-2031 (US$Bn, AGR %) (Pre COVID)
Figure 135 Asia Pacific Dermatological Drugs Market Forecast, 2021-2031 (USD Bn, AGR (%)) (V-Shape Recovery)
Figure 136 Asia Pacific Dermatological Drugs Market Forecast, 2021-2031 (USD Bn, AGR (%)) (W-Shape Recovery)
Figure 137 Asia Pacific Dermatological Drugs Market Forecast, 2021-2031 (USD Bn, AGR (%)) (UShape Recovery)
Figure 138 Asia Pacific Dermatological Drugs Market Forecast, 2021-2031 (USD Bn, AGR (%)) (L-Shape Recovery)
Figure 139 Asia-Pacific Dermatological Drugs Market Share Forecast by Country 2021, 2026, 2031 (%)
Figure 140 Asia Pacific Dermatological Drugs Market Forecast 2021-2031 (US$Bn, AGR %) (Pre COVID)
Figure 141 Asia Pacific Dermatological Drugs Market Forecast 2021-2031 (US$Bn, AGR %) (Pre COVID) (V-Shape Recovery)
Figure 142 Asia Pacific Dermatological Drugs Market Forecast 2021-2031 (US$Bn, AGR %) (Pre COVID) (W-Shape Recovery)
Figure 143 Asia Pacific Dermatological Drugs Market Forecast 2021-2031 (US$Bn, AGR %) (Pre COVID) (U-Shape Recovery)
Figure 144 Asia Pacific Dermatological Drugs Market Forecast 2021-2031 (US$Bn, AGR %) (Pre COVID) (L-Shape Recovery)
Figure 145 Market Forecast 2021-2031 (US$Bn, AGR %) (Pre COVID)
Figure 146 Asia Pacific Dermatological Drugs Market by Disease, 2021-2031 (USD Bn, AGR (%)) (V-Shape Recovery)
Figure 147 Asia Pacific Dermatological Drugs Market by Disease, 2021-2031 (USD Bn, AGR (%)) (W-Shape Recovery)
Figure 148 Asia Pacific Dermatological Drugs Market by Disease, 2021-2031 (USD Bn, AGR (%)) (U-Shape Recovery)
Figure 149 Asia Pacific Dermatological Drugs Market by Disease, 2021-2031 (USD Bn, AGR (%)) (L-Shape Recovery)
Figure 150 Market Forecast 2021-2031 (US$Bn, AGR %) (Pre COVID)
Figure 151 Asia Pacific Dermatological Drugs Market by Skin Infections Drugs, 2021-2031 (USD Bn, AGR (%)) (V-Shape Recovery)
Figure 152 Asia Pacific Dermatological Drugs Market by Skin Infections Drugs, 2021-2031 (USD Bn, AGR (%)) (W-Shape Recovery)
Figure 153 Asia Pacific Dermatological Drugs Market by Skin Infections Drugs, 2021-2031 (USD Bn, AGR (%)) (U-Shape Recovery)
Figure 154 Asia Pacific Dermatological Drugs Market by Skin Infections Drugs, 2021-2031 (USD Bn, AGR (%)) (L-Shape Recovery)
Figure 155 Market Forecast 2021-2031 (US$Bn, AGR %) (Pre COVID)
Figure 156 Global Dermatological Drugs Market by Psoriasis Drugs, 2021-2031 (USD Bn, AGR (%)) (V-Shape Recovery)
Figure 157 Global Dermatological Drugs Market by Psoriasis Drugs, 2021-2031 (USD Bn, AGR (%)) (W-Shape Recovery)
Figure 158 Global Dermatological Drugs Market by Psoriasis Drugs, 2021-2031 (USD Bn, AGR (%)) (U-Shape Recovery)
Figure 159 Global Dermatological Drugs Market by Psoriasis Drugs, 2021-2031 (USD Bn, AGR (%)) (L-Shape Recovery)
Figure 160 Market Forecast 2021-2031 (US$Bn, AGR %) (Pre COVID)
Figure 161 Asia Pacific Dermatological Drugs Market by Dermatitis Drugs, 2021-2031 (USD Bn, AGR (%)) (V-Shape Recovery)
Figure 162 Asia Pacific Dermatological Drugs Market by Dermatitis Drugs, 2021-2031 (USD Bn, AGR (%)) (W-Shape Recovery)
Figure 163 Asia Pacific Dermatological Drugs Market by Dermatitis Drugs, 2021-2031 (USD Bn, AGR (%)) (U-Shape Recovery)
Figure 164 Asia Pacific Dermatological Drugs Market by Dermatitis Drugs, 2021-2031 (USD Bn, AGR (%)) (L-Shape Recovery)
Figure 165 Market Forecast 2021-2031 (US$Bn, AGR %) (Pre COVID)
Figure 166 Asia Pacific Dermatological Drugs Market by Acne Drugs, 2021-2031 (USD Bn, AGR (%)) (V-Shape Recovery)
Figure 167 Asia Pacific Dermatological Drugs Market by Acne Drugs, 2021-2031 (USD Bn, AGR (%)) (W-Shape Recovery)
Figure 168 Asia Pacific Dermatological Drugs Market by Acne Drugs, 2021-2031 (USD Bn, AGR (%)) (UShape Recovery)
Figure 169 Asia Pacific Dermatological Drugs Market by Acne Drugs, 2021-2031 (USD Bn, AGR (%)) (L-Shape Recovery)
Figure 170 Asia Pacific Dermatological Drugs Market by Route of Administration Forecast 2021-2031 (US$Bn, AGR %) (Pre COVID)
Figure 171 Asia Pacific Dermatological Drugs Market by Route of Administration, 2021-2031 (USD Bn, AGR (%)) (V-Shape Recovery)
Figure 172 Asia Pacific Dermatological Drugs Market by Route of Administration, 2021-2031 (USD Bn, AGR (%)) (W-Shape Recovery)
Figure 173 Asia Pacific Dermatological Drugs Market by Route of Administration, 2021-2031 (USD Bn, AGR (%)) (U-Shape Recovery)
Figure 174 Asia Pacific Dermatological Drugs Market by Route of Administration, 2021-2031 (USD Bn, AGR (%)) (L-Shape Recovery)
Figure 175 Market Forecast 2021-2031 (US$Bn, AGR %) (Pre COVID)
Figure 176 LAMEA Dermatological Drugs Market Forecast, 2021-2031 (USD Bn, AGR (%)) (V-Shape Recovery)
Figure 177 LAMEA Dermatological Drugs Market Forecast, 2021-2031 (USD Bn, AGR (%)) (W-Shape Recovery)
Figure 178 LAMEA Dermatological Drugs Market Forecast, 2021-2031 (USD Bn, AGR (%)) (U-Shape Recovery)
Figure 179 LAMEA Dermatological Drugs Market Forecast, 2021-2031 (USD Bn, AGR (%)) (L-Shape Recovery)
Figure 180 LAMEA Dermatological Drugs Market Share Forecast by Country 2021, 2026, 2031 (%)
Figure 181 LAMEA Dermatological Drugs Market Forecast 2021-2031 (US$Bn, AGR %) (Pre COVID)
Figure 182 LAMEA Dermatological Drugs Market Forecast 2021-2031 (US$Bn, AGR %) (Pre COVID) (V-Shape Recovery)
Figure 183 LAMEA Dermatological Drugs Market Forecast 2021-2031 (US$Bn, AGR %) (Pre COVID) (W-Shape Recovery)
Figure 184 LAMEA Dermatological Drugs Market Forecast 2021-2031 (US$Bn, AGR %) (Pre COVID) (U-Shape Recovery)
Figure 185 LAMEA Dermatological Drugs Market Forecast 2021-2031 (US$Bn, AGR %) (Pre COVID) (L-Shape Recovery)
Figure 186 Market Forecast 2021-2031 (US$Bn, AGR %) (Pre COVID)
Figure 187 LAMEA Dermatological Drugs Market by Disease, 2021-2031 (USD Bn, AGR (%)) (V-Shape Recovery)
Figure 188 LAMEA Dermatological Drugs Market by Disease, 2021-2031 (USD Bn, AGR (%)) (W-Shape Recovery)
Figure 189 LAMEA Dermatological Drugs Market by Disease, 2021-2031 (USD Bn, AGR (%)) (U-Shape Recovery)
Figure 190 LAMEA Dermatological Drugs Market by Disease, 2021-2031 (USD Bn, AGR (%)) (L-Shape Recovery)
Figure 191 Market Forecast 2021-2031 (US$Bn, AGR %) (Pre COVID)
Figure 192 LAMEA Dermatological Drugs Market by Skin Infections Drugs, 2021-2031 (USD Bn, AGR (%)) (V-Shape Recovery)
Figure 193 LAMEA Dermatological Drugs Market by Skin Infections Drugs, 2021-2031 (USD Bn, AGR (%)) (W-Shape Recovery)
Figure 194 LAMEA Dermatological Drugs Market by Skin Infections Drugs, 2021-2031 (USD Bn, AGR (%)) (U-Shape Recovery)
Figure 195 LAMEA Dermatological Drugs Market by Skin Infections Drugs, 2021-2031 (USD Bn, AGR (%)) (L-Shape Recovery)
Figure 196 Market Forecast 2021-2031 (US$Bn, AGR %) (Pre COVID)
Figure 197 LAMEA Dermatological Drugs Market by Psoriasis Drugs, 2021-2031 (USD Bn, AGR (%)) (V-Shape Recovery)
Figure 198 LAMEA Dermatological Drugs Market by Psoriasis Drugs, 2021-2031 (USD Bn, AGR (%)) (W-Shape Recovery)
Figure 199 LAMEA Dermatological Drugs Market by Psoriasis Drugs, 2021-2031 (USD Bn, AGR (%)) (U-Shape Recovery)
Figure 200 LAMEA Dermatological Drugs Market by Psoriasis Drugs, 2021-2031 (USD Bn, AGR (%)) (L-Shape Recovery)
Figure 201 Market Forecast 2021-2031 (US$Bn, AGR %) (Pre COVID)
Figure 202 LAMEA Dermatological Drugs Market by Dermatitis Drugs, 2021-2031 (USD Bn, AGR (%)) (V-Shape Recovery)
Figure 203 LAMEA Dermatological Drugs Market by Dermatitis Drugs, 2021-2031 (USD Bn, AGR (%)) (W-Shape Recovery)
Figure 204 LAMEA Dermatological Drugs Market by Dermatitis Drugs, 2021-2031 (USD Bn, AGR (%)) (U-Shape Recovery)
Figure 205 LAMEA Dermatological Drugs Market by Dermatitis Drugs, 2021-2031 (USD Bn, AGR (%)) (L-Shape Recovery)
Figure 206 Market Forecast 2021-2031 (US$Bn, AGR %) (Pre COVID)
Figure 207 LAMEA Dermatological Drugs Market by Acne Drugs, 2021-2031 (USD Bn, AGR (%)) (V-Shape Recovery)
Figure 208 LAMEA Dermatological Drugs Market by Acne Drugs, 2021-2031 (USD Bn, AGR (%)) (WShape Recovery)
Figure 209 LAMEA Dermatological Drugs Market by Acne Drugs, 2021-2031 (USD Bn, AGR (%)) (U-Shape Recovery)
Figure 210 LAMEA Dermatological Drugs Market by Acne Drugs, 2021-2031 (USD Bn, AGR (%)) (L-Shape Recovery)
Figure 211 Market Forecast 2021-2031 (US$Bn, AGR %) (Pre COVID)
Figure 212 LAMEA Dermatological Drugs Market by Route of Administration, 2021-2031 (USD Bn, AGR (%)) (V-Shape Recovery)
Figure 213 LAMEA Dermatological Drugs Market by Route of Administration, 2021-2031 (USD Bn, AGR (%)) (W-Shape Recovery)
Figure 214 LAMEA Dermatological Drugs Market by Route of Administration, 2021-2031 (USD Bn, AGR (%)) (U-Shape Recovery)
Figure 215 LAMEA Dermatological Drugs Market by Route of Administration, 2021-2031 (USD Bn, AGR (%)) (L-Shape Recovery)
Figure 216 Abbott Laboratories: Company Revenue 2015-2019 (US$ Million, AGR %)
Figure 217 Abbott Laboratories: Company Operating Income 2015-2019 (US$ Million, AGR %)
Figure 218 Abbott Laboratories: Company EBITDA 2015-2019 (US$ Million, AGR %)
Figure 219 Abbott Laboratories: Company Net Income/Loss 2015-2019 (US$ Million, AGR %)
Figure 220 AbbVie Inc: Company Revenue 2015-2019 (US$ Million, AGR %)
Figure 221 AbbVie Inc: Company Operating Income 2015-2019 (US$ Million, AGR %)
Figure 222 AbbVie Inc: Company EBITDA 2015-2019 (US$ Million, AGR %)
Figure 223 AbbVie Inc: Company Net Income/Loss 2015-2019 (US$ Million, AGR %)
Figure 224 Bayer Pharmaceuticals: Company Revenue 2015-2019 (US$ Million, AGR %)
Figure 225 Bayer Pharmaceuticals: Company Operating Income 2015-2019 (US$ Million, AGR %)
Figure 226 Bayer Pharmaceuticals: Company EBITDA 2015-2019 (US$ Million, AGR %)
Figure 227 Bayer Pharmaceuticals: Company Net Income/Loss 2015-2019 (US$ Million, AGR %)
Figure 228 Bristol-Myers Squibb: Company Revenue 2015-2019 (US$ Million, AGR %)
Figure 229 Bristol-Myers Squibb: Company Operating Income 2015-2019 (US$ Million, AGR %)
Figure 230 Bristol-Myers Squibb: Company EBITDA 2015-2019 (US$ Million, AGR %)
Figure 231 Bristol-Myers Squibb: Company Net Income/Loss 2015-2019 (US$ Million, AGR %)
Figure 232 Zydus Cadila Healthcare Pharmaceuticals: Company Revenue 2015-2019 (US$ Million, AGR %)
Figure 233 Zydus Cadila Healthcare Pharmaceuticals: Company Operating Income 2015-2019 (US$ Million, AGR %)
Figure 234 Zydus Cadila Healthcare Pharmaceuticals: Company EBITDA 2015-2019 (US$ Million, AGR %)
Figure 235 Zydus Cadila Healthcare Pharmaceuticals: Company Net Income/Loss 2015-2019 (US$ Million, AGR %)
Figure 236 Cipla Pharmaceutical: Company Revenue 2015-2019 (US$ Million, AGR %)
Figure 237 Cipla Pharmaceutical: Company Operating Income 2015-2019 (US$ Million, AGR %)
Figure 238 Cipla Pharmaceutical: Company EBITDA 2015-2019 (US$ Million, AGR %)
Figure 239 Cipla Pharmaceutical: Company Net Income/Loss 2015-2019 (US$ Million, AGR %)
Figure 240 Dr. Reddy’s Laboratories: Company Revenue 2015-2019 (US$ Million, AGR %)
Figure 241 Dr. Reddy’s Laboratories: Company Operating Income 2015-2019 (US$ Million, AGR %)
Figure 242 Dr. Reddy’s Laboratories: Company EBITDA 2015-2019 (US$ Million, AGR %)
Figure 243 Dr. Reddy’s Laboratories: Company Net Income/Loss 2015-2019 (US$ Million, AGR %)
Figure 244 Eli Lilly and Company: Company Revenue 2015-2019 (US$ Million, AGR %)
Figure 245 Eli Lilly and Company: Company Operating Income 2015-2019 (US$ Million, AGR %)
Figure 246 Eli Lilly and Company: Company EBITDA 2015-2019 (US$ Million, AGR %)
Figure 247 Eli Lilly and Company: Company Net Income/Loss 2015-2019 (US$ Million, AGR %) Figure 248 GlaxoSmithKline: Company Revenue 2015-2019 (US$ Million, AGR %)
Figure 249 GlaxoSmithKline: Company Operating Income 2015-2019 (US$ Million, AGR %)
Figure 250 GlaxoSmithKline: Company EBITDA 2015-2019 (US$ Million, AGR %)
Figure 251 GlaxoSmithKline: Company Net Income/Loss 2015-2019 (US$ Million, AGR %)
Figure 252 Glenmark Pharmaceuticals Limited: Company Revenue 2015-2019 (US$ Million, AGR %)
Figure 253 Glenmark Pharmaceuticals Limited: Company Operating Income 2015-2019 (US$ Million, AGR %)
Figure 254 Glenmark Pharmaceuticals Limited: Company EBITDA 2015-2019 (US$ Million, AGR %)
Figure 255 Glenmark Pharmaceuticals Limited: Company Net Income/Loss 2015-2019 (US$ Million, AGR %)
Figure 256 Johnson & Johnson Inc: Company Revenue 2015-2019 (US$ Million, AGR %)
Figure 257 Johnson & Johnson Inc: Company Operating Income 2015-2019 (US$ Million, AGR %)
Figure 258 Johnson & Johnson Inc: Company EBITDA 2015-2019 (US$ Million, AGR %)
Figure 259 Johnson & Johnson Inc: Company Net Income/Loss 2015-2019 (US$ Million, AGR %)
Figure 260 L’Oréal Cosmetics: Company Revenue 2015-2019 (US$ Million, AGR %)
Figure 261 L’Oréal Cosmetics: Company Operating Income 2015-2019 (US$ Million, AGR %)
Figure 262 L’Oréal Cosmetics: Company EBITDA 2015-2019 (US$ Million, AGR %)
Figure 263 L’Oréal Cosmetics: Company Net Income/Loss 2015-2019 (US$ Million, AGR %)
Figure 264 Lupin Limited: Company Revenue 2015-2019 (US$ Million, AGR %)
Figure 265 Lupin Limited: Company Operating Income 2015-2019 (US$ Million, AGR %)
Figure 266 Lupin Limited: Company EBITDA 2015-2019 (US$ Million, AGR %)
Figure 267 Lupin Limited: Company Net Income/Loss 2015-2019 (US$ Million, AGR %)
Figure 268 Merck Group Chemicals: Company Revenue 2015-2019 (US$ Million, AGR %)
Figure 269 Merck Group Chemicals: Company Operating Income 2015-2019 (US$ Million, AGR %)
Figure 270 Merck Group Chemicals: Company EBITDA 2015-2019 (US$ Million, AGR %)
Figure 271 Merck Group Chemicals: Company Net Income/Loss 2015-2019 (US$ Million, AGR %)
Figure 272 Pfizer Inc: Company Revenue 2015-2019 (US$ Million, AGR %)
Figure 273 Pfizer Inc: Company Operating Income 2015-2019 (US$ Million, AGR %)
Figure 274 Pfizer Inc: Company EBITDA 2015-2019 (US$ Million, AGR %)
Figure 275 Pfizer Inc: Company Net Income/Loss 2015-2019 (US$ Million, AGR %)
Figure 276 F. Hoffmann-La Roche Ltd: Company Revenue 2015-2019 (US$ Million, AGR %)
Figure 277 F. Hoffmann-La Roche Ltd: Company Operating Income 2015-2019 (US$ Million, AGR %)
Figure 278 F. Hoffmann-La Roche Ltd: Company EBITDA 2015-2019 (US$ Million, AGR %)
Figure 279 F. Hoffmann-La Roche Ltd: Company Net Income/Loss 2015-2019 (US$ Million, AGR %)
Figure 280 Sanofi Pasteur Pharmaceutical: Company Revenue 2015-2019 (US$ Million, AGR %)
Figure 281 Sanofi Pasteur Pharmaceutical: Company Operating Income 2015-2019 (US$ Million, AGR %)
Figure 282 Sanofi Pasteur Pharmaceutical: Company EBITDA 2015-2019 (US$ Million, AGR %)
Figure 283 Sanofi Pasteur Pharmaceutical: Company Net Income/Loss 2015-2019 (US$ Million, AGR %)
Figure 284 Sun Pharmaceutical Industries Limited: Company Revenue 2015-2019 (US$ Million, AGR %)
Figure 285 Sun Pharmaceutical Industries Limited: Company Operating Income 2015-2019 (US$ Million, AGR %)
Figure 286 Sun Pharmaceutical Industries Limited: Company EBITDA 2015-2019 (US$ Million, AGR %)
Figure 287 Sun Pharmaceutical Industries Limited: Company Net Income/Loss 2015-2019 (US$ Million, AGR %)
Figure 288 Takeda Pharmaceuticals: Company Revenue 2015-2019 (US$ Million, AGR %)
Figure 289 Takeda Pharmaceuticals: Company Operating Income 2015-2019 (US$ Million, AGR %)
Figure 290 Takeda Pharmaceuticals: Company EBITDA 2015-2019 (US$ Million, AGR %)
Figure 291 Takeda Pharmaceuticals: Company Net Income/Loss 2015-2019 (US$ Million, AGR %)
Figure 292 Taro Pharmaceutical Industries Ltd: Company Revenue 2015-2019 (US$ Million, AGR %)
Figure 293 Taro Pharmaceutical Industries Ltd: Company Operating Income 2015-2019 (US$ Million, AGR %)
Figure 294 Taro Pharmaceutical Industries Ltd: Company EBITDA 2015-2019 (US$ Million, AGR %)
Figure 295 Taro Pharmaceutical Industries Ltd: Company Net Income/Loss 2015-2019 (US$ Million, AGR %)
Figure 296 Asia-Pacific Dermatological Drugs Market Forecast 2021-2031 (US$Bn, AGR %) (Pre COVID)
Abbott Laboratories
AbbVie Inc. (AbbVie)
Bayer Pharmaceuticals
Bristol-Myers Squibb
Cadila Healthcare
Cipla
Dr Reddy’s
GlaxoSmithKline
Glenmark Pharmaceuticals Limited
Johnson & Johnson Inc.
L’Oreal SA
Lupin Limited
Merck Group Chemicals
Pfizer Inc. (Pfizer)
Roche Holding AG (Roche)
Sanofi Pasteur Pharmaceutical
Sun Pharma
Sun Pharmaceutical Industries Limited
Takeda Pharmaceutical Company Limited
Taro Pharmaceutical Industries Ltd
Taro Pharmaceutical Industries Ltd. (Taro)
List of Other Companies
Abbott
AbbVie
Actavis
AET BioTech
Alkem Laboratories
Allergan
Almirall
Amgen
Anacor
Ascend Therapeutics
Astellas
Aurovindo
Barr Labs
Bayer
Betta Pharmaceuticals
Biocon/Mylan
Biofrontera
Biogen
Biovail Laboratories
BioXpress Therapeutics
Boehringer Ingelheim
Brazilian Society of Dermatology
Bristol-Myers Squibb
Cadila Healthcare
Calico
Can-Fite BioPharma
Cassiopea SpA
Celgene
Celltrion
Cempra
Cipher Pharmaceuticals
Cipla
Colorescience
Cubist Pharmaceuticals
Cutanea Life Sciences
Dow Pharmaceuticals Science
Dr Reddy’s
Durata Therapeutics
Eisai
Eli Lilly
European Medicines Agency (EMA)
European Pharmaceutical Market Research Association (EPhMRA)
FibroTx
Foamix
Food and Drug Association (FDA)
Fougera
Fujifilm
G&E Herbal Biotechnology
Galapagos NV
Galderma
GlaxoSmithKline
Glenmark Pharmaceuticals
Heritage
Impax
Incyte
International Health Partners
Janssen Biotech
Johnson & Johnson
Kyowa Hakko Kirin
L’Oreal
LEO Pharma
Lupin
Maruho
Mayne Pharma
Medicis
Medison Pharma
Melinta Pharmaceuticals
Merck
Merz Pharmaceuticals
Mitsubishi Tanabe
MorphoSys
Mylan
NanoBio Corporation
National Psoriasis Foundation (NPF)
NeoStrata Compnay Inc
Nestle Skin Health
Novan
Novartis
Perriogo
Pfizer
PharmaPraxis
Photocure
Pierre Fabre
Provectus Biopharmaceuticals
QLT Inc
Ranbaxy
Regeneron Pharmaceuticals
Roche
Samsung Bioepis
Samsung BioLogics
Sandoz
Sanofi
Schering-Plough
Shanghai CP Buojian Pharmaceutical
Sidmak Labs
Sol-Gel Technologies Ltd
Sun Pharma
Sunovion
Takeda
Tanabe
Tanja Todberg
Taro Pharmaceuticals
Teva
Thesan Pharmaceuticals Inc
Topica Pharmaceuticals
UCB
Valeant
Vical
Warner Chilcott
Watson Pharmaceuticals
Xenon Pharmaceuticals
Ziarco Group Limited
Zydus
List of Organizations Mentioned in the Report
Brazilian Society of Dermatology
British Association of Dermatologists
Chinese Society of Dermatology
European Medicines Agency (EMA)
European Pharmaceutical Market Research Association (EPhMRA)
Food and Drug Administration (FDA) [US]
Health Canada
National Development and Reform Commission (NDRC) [China]
National Health Services (NHS) [UK]
National Institute for Health and Care Excellence (NICE) [UK]
National Institute of Allergy and Infectious Diseases (NIAID) [US]
National Institutes of Health [US]
National Pharmaceutical Pricing Authority (NPPA) [China]
Pharmaceuticals and Medical Devices Agency (PMDA) [Japan]
Servicio Sanitario Nazionale (SSN) [US]
St. Luke’s-Roosevelt Hospital Center, New York [US]
UK Medicines and Healthcare Products Regulatory Agency (MHRA)
United States District Court for the District of New Jersey
University of California, San Diego [US]
University of Michigan [US]
US Patent Office
Download sample pages
Complete the form below to download your free sample pages for Dermatological Drugs Market Report 2021-2031Related reports
-

Global Pharmaceutical Excipients Market Forecast to 2027
The global pharmaceutical excipients market is expected to grow at a CAGR of 6.8% in the first half of the...Full DetailsPublished: 30 November 2017 -
Topical Drug Delivery Market Report 2020-2030
Delivery of biologics through the transdermal route is anticipated to open new avenues for the manufacturers of topical drugs. Transdermal...Full DetailsPublished: 22 October 2020 -

Biopharmaceuticals Manufacturing Consumables Testing Market Report 2019-2029
Consumable products are those products which assist the manufacturing process or come in direct contact with the product but however...
Full DetailsPublished: 01 January 1970 -
Dermatology Devices Market Report 2020-2030
Where is the Dermatology Devices market heading? If you are involved in this sector you must read this newly updated...
Full DetailsPublished: 01 January 1970 -

Biopharmaceuticals Excipients Market 2020-2030
The biopharmaceuticals excipients market is expected to grow at a CAGR of 12.2%.
...Full DetailsPublished: 15 April 2020 -
Cosmetic Surgery Market Report 2022-2032
The cosmetic surgery market was valued at US$44.31 billion in 2021 and is projected to grow at a CAGR of...Full DetailsPublished: 17 November 2022 -
Skin Care Market Report 2019-2029
It is anticipated that increased demand for natural, herbal and organic goods with no adverse effects will increase market growth...
Full DetailsPublished: 01 January 1970
Download sample pages
Complete the form below to download your free sample pages for Dermatological Drugs Market Report 2021-2031Do you have any custom requirements we can help you with?
Any specific country, geo region, market segment or specific company information?
Email us today, we can discuss your needs and see how we can help: jamie.roberts@visiongain.com
Would you like a free report overview of the report of your choice?
If so, please drop an email to Jamie Roberts stating your chosen report title to jamie.roberts@visiongain.com
Visiongain’s reports are based on comprehensive primary and secondary research. Those studies provide global market forecasts (sales by drug and class, with sub-markets and leading nations covered) and analyses of market drivers and restraints (including SWOT analysis) and current pipeline developments. To find out more about our reports methodology, please email jamie.roberts@visiongain.com
“Thank you for this Gene Therapy R&D Market report and for how easy the process was. Your colleague was very helpful and the report is just right for my purpose. This is the 2nd good report from Visiongain and a good price.”
Dr Luz Chapa Azuella, Mexico
American Association of Colleges of Pharmacy
American College of Clinical Pharmacy
American Pharmacists Association
American Society for Pharmacy Law
American Society of Consultant Pharmacists
American Society of Health-System Pharmacists
Association of Special Pharmaceutical Manufacturers
Australian College of Pharmacy
Biotechnology Industry Organization
Canadian Pharmacists Association
Canadian Society of Hospital Pharmacists
Chinese Pharmaceutical Association
College of Psychiatric and Neurologic Pharmacists
Danish Association of Pharmaconomists
European Association of Employed Community Pharmacists in Europe
European Medicines Agency
Federal Drugs Agency
General Medical Council
Head of Medicines Agency
International Federation of Pharmaceutical Manufacturers & Associations
International Pharmaceutical Federation
International Pharmaceutical Students’ Federation
Medicines and Healthcare Products Regulatory Agency
National Pharmacy Association
Norwegian Pharmacy Association
Ontario Pharmacists Association
Pakistan Pharmacists Association
Pharmaceutical Association of Mauritius
Pharmaceutical Group of the European Union
Pharmaceutical Society of Australia
Pharmaceutical Society of Ireland
Pharmaceutical Society Of New Zealand
Pharmaceutical Society of Northern Ireland
Professional Compounding Centers of America
Royal Pharmaceutical Society
The American Association of Pharmaceutical Scientists
The BioIndustry Association
The Controlled Release Society
The European Federation of Pharmaceutical Industries and Associations
The European Personalised Medicine Association
The Institute of Clinical Research
The International Society for Pharmaceutical Engineering
The Pharmaceutical Association of Israel
The Pharmaceutical Research and Manufacturers of America
The Pharmacy Guild of Australia
The Society of Hospital Pharmacists of Australia
Latest Pharma news
Visiongain Publishes Drug Delivery Technologies Market Report 2024-2034
The global Drug Delivery Technologies market is estimated at US$1,729.6 billion in 2024 and is projected to grow at a CAGR of 5.5% during the forecast period 2024-2034.
23 April 2024
Visiongain Publishes Cell Therapy Technologies Market Report 2024-2034
The cell therapy technologies market is estimated at US$7,041.3 million in 2024 and is projected to grow at a CAGR of 10.7% during the forecast period 2024-2034.
18 April 2024
Visiongain Publishes Automation in Biopharma Industry Market Report 2024-2034
The global Automation in Biopharma Industry market is estimated at US$1,954.3 million in 2024 and is projected to grow at a CAGR of 7% during the forecast period 2024-2034.
17 April 2024
Visiongain Publishes Anti-obesity Drugs Market Report 2024-2034
The global Anti-obesity Drugs market is estimated at US$11,540.2 million in 2024 and is expected to register a CAGR of 21.2% from 2024 to 2034.
12 April 2024


