The latest energy report from business intelligence provider Visiongain offers comprehensive analysis of the global concentrated solar power (CSP) market. Visiongain assesses that the CSP market will generate revenues of $30.83bn in 2017.
The Concentrated Solar Power Market Report 2017-2027 responds to your need for definitive market data
Read on to discover how you can exploit the future business opportunities emerging in the CSP sector. Visiongain’s new study tells you and tells you NOW.
In this brand new report you find 134 in-Depth tables, charts and graphs all unavailable elsewhere.
The 145 page report provides clear detailed insight into the global concentrated solar power market. Discover the key drivers and challenges affecting the market.
By ordering and reading our brand new energy report today you stay better informed and ready to act.
Report Scope
The report delivers considerable added value by revealing:
• How is the Concentrated Solar Power market evolving?
– See market forecasts from 2017-2027 globally, regionally and by CSP technology
• How will each Concentrated Solar Power submarket segment grow over the forecast period and how much Sales will these submarkets account for in 2027? Which technologies will prevail and how will these shifts be responded to?
– Parabolic Trough (PT
– Linear Fresnel Reflector (FR)
– Solar Tower (ST)
– Solar Dish (SD)
• What is driving and restraining Concentrated Solar Power market dynamics?
• Which leading national Concentrated Solar Power market will develop the most over the forecast period?
– United States
– Spain
– Australia
– China
– India
– Morocco
– South Africa
– Chile
– Saudi Arabia
– UAE
– Rest of the World
• Who are the leading CSP players and what are their prospects over the forecast period?
– Abengoa Solar S.A.
– Acciona S.A.
– Areva Solar
– Bright Source Energy Inc.
– eSolar Inc.
– GDF SUEZ/Engie
– NextEra Energy Resources LLC
– SCHOTT Solar AG
– Solar Millennium AG
– SolarReserve LLC
– TSK Flagsol Engineering GmbH
• How will political and regulatory factors influence regional Concentrated Solar Power markets and submarkets?
• PEST analysis of the major political, economic, social and technological aspects impacting the market
• Conclusions and recommendations which will aid decision-making
How will you benefit from this report?
• Keep your knowledge base up to speed. Don’t get left behind
• Reinforce your strategic decision-making with definitive and reliable market data
• Learn how to exploit new technological trends
• Realise your company’s full potential within the market
• Understand the competitive landscape and identify potential new business opportunities & partnerships
Who should read this report?
• Anyone within the concentrated solar power market.
• Business development managers
• Marketing managers
• Technologists
• Suppliers
• Investors
• Banks
• Government agencies
• Contractors
Visiongain’s study is intended for anyone requiring commercial analyses for the concentrated solar power and leading companies. You find data, trends and predictions.
Buy our report today Concentrated Solar Power (CSP) Market Report 2017-2027: Revenue Forecasts ($m) by Technology (Parabolic Trough (PT), Linear Fresnel Reflector (FR), Solar Tower (ST) and Solar Dish (SD)) and Geography (United States, Spain, Australia, China, India, Morocco, South Africa, Chile, Saudi Arabia, UAE, the Rest of the World); Including Analysis of Leading CSP/ Photovoltaic (PV) Companies. Avoid missing out by staying informed – get our report now.
Visiongain is a trading partner with the US Federal Government
CCR Ref number: KD4R6
1. Report Overview
1.1 Global Concentrating Solar Power Market Overview
1.2 Why You Should Read This Report
1.3 How This Report Delivers
1.4 Key Questions Answered by This Analytical Report Include:
1.5 Who is This Report For?
1.6 Methodology
1.6.1 Primary Research
1.6.2 Secondary Research
1.6.3 Market Evaluation & Forecasting Methodology
1.7 Frequently Asked Questions (FAQ)
1.8 Associated Visiongain Reports
1.9 About Visiongain
2. Introduction to the Concentrating Solar Power Market
2.1 Concentrating Solar Power Market Structure
2.2 Concentrating Solar Power Market Definition
2.3 Brief History of Concentrating Solar Power
2.4 Concentrating Solar Power Submarkets Definition
2.4.1 Concentrating Solar Power – Parabolic Trough (PT) Submarket Definition
2.4.2 Concentrating Solar Power – Fresnel Reflector Submarket Definition
2.4.3 Concentrating Solar Power – Solar Tower Submarket Definition
2.4.4 Concentrating Solar Power – Solar Dish Submarket Definition
3. Global Concentrating Solar Power Market 2017-2027
3.1 Global Concentrating Solar Power Market Forecast 2017-2027
3.2 Concentrating Solar Power Market Drivers & Restraints 2017
3.2.1 Drivers in the Concentrating Solar Power Market
3.2.2 Restraints in the Concentrating Solar Power Market
3.2.2.1 High Initial Cost
3.2.2.2 Financial Crunch
3.2.2.3 Increasing Adoption of Other Renewable Technologies
4. Global Concentrating Solar Power By Technology Forecast 2017-2027
4.1 Global Concentrating Solar Power Parabolic Trough Technology Forecast 2017-2027
4.1.1 Spain Will Drive the Parabolic Trough Technology Concentrating Solar Power Market
4.2 Global Concentrating Solar Power Linear Fresnel Reflector Technology Forecast 2017-2027
4.2.1 Expansion In Concentrating Solar Power Adoption Will Drive The Technology Market
4.3 Global Concentrating Solar Power Solar Tower Technology Forecast 2017-2027
4.3.1 Solar Tower Technology Will Witness A Significant Growth During The Forecast Period
4.4 Global Concentrating Solar Power Solar Dish Technology Forecast 2017-2027
4.4.1 Solar Dish Is Predicted To Witness A Highest Growth
5. Leading National Concentrating Solar Power Market Forecast 2017-2027
5.1 The US Concentrating Solar Power Market Forecast 2017-2027
5.1.1 The US Concentrated Solar Power Market Overview 2017-2027
5.1.2 The US Concentrating Solar Power Market - Current Projects 2017-2027
5.1.3 Drivers and Restraints in the US Concentrating Solar Power Market
5.2 Spain Concentrating Solar Power Market Forecast 2017-2027
5.2.1 Spain Concentrated Solar Power Market Overview 2017-2027
5.2.2 Spain Concentrating Solar Power Market - Current Projects 2017-2027
5.2.3 Drivers And Restraints In Spain Concentrating Solar Power Market
5.3 Australia Concentrating Solar Power Market Forecast 2017-2027
5.3.1 Australia Concentrated Solar Power Market Overview 2017-2027
5.3.2 Australia Concentrating Solar Power Market - Current Projects 2017-2027
5.3.3 Drivers And Restraints in Australia Concentrating Solar Power Market
5.4 China Concentrating Solar Power Market Forecast 2017-2027
5.4.1 China Concentrated Solar Power Market Overview 2017-2027
5.4.2 China Concentrating Solar Power Market - Current Projects 2017-2027
5.4.3 Drivers and Restraints in China Concentrating Solar Power Market
5.5 India Concentrating Solar Power Market Forecast 2017-2027
5.5.1 India Concentrated Solar Power Market Overview 2017-2027
5.5.2 India Concentrating Solar Power Market - Current Projects 2017-2027
5.5.3 Drivers and Restraints in India Concentrating Solar Power Market
5.6 Morocco Concentrating Solar Power Market Forecast 2017-2027
5.6.1 Morocco Concentrated Solar Power Market Overview 2017-2027
5.6.2 Morocco Concentrating Solar Power Market - Current Projects 2017-2027
5.6.3 Drivers and Restraints in Morocco Concentrating Solar Power Market
5.7 Saudi Arabia Concentrating Solar Power Market Forecast 2017-2027
5.7.1 Saudi Arabia Concentrated Solar Power Market Overview 2017-2027
5.7.2 Drivers and Restraints in Saudi Arabia Concentrating Solar Power Market
5.8 South Africa Concentrating Solar Power Market Forecast 2017-2027
5.8.1 South Africa Concentrated Solar Power Market Overview 2017-2027
5.8.2 South Africa Concentrating Solar Power Market - Current Projects 2017-2027
5.8.3 Drivers and Restraints in South Africa Concentrating Solar Power Market
5.9 UAE Concentrating Solar Power Market Forecast 2017-2027
5.9.1 UAE Concentrated Solar Power Market Overview 2017-2027
5.9.2 Drivers and Restraints in UAE Concentrating Solar Power Market
5.10 Chile Concentrating Solar Power Market Forecast 2017-2027
5.10.1 Chile Concentrated Solar Power Market Overview 2017-2027
5.10.2 Drivers and Restraints in Chile Concentrating Solar Power Market
5.11 Rest of World Concentrating Solar Power Market Forecast 2017-2027
5.11.1 Rest of World Concentrating Solar Power Market Overview 2017-2027
5.11.2 Drivers and Restraints in Rest of World Concentrating Solar Power Market
6. SWOT Analysis of the Concentrating Solar Power Market 2017-2027
6.1 Strengths
6.2 Weaknesses
6.3 Opportunities
6.4 Threats
7. The Leading Companies in the Concentrating Solar Power Market
7.1 Abengoa Solar S.A.
7.1.1 Abengoa Solar S.A. Concentrating Solar Power Selected Recent Contracts / Projects / Programmes 2016
7.1.2 Abengoa Solar S.A. Total Company Sales 2011-2015
7.2 Areva Solar
7.2.1 Areva Solar Concentrating Solar Power Selected Recent Contracts / Projects / Programmes 2016
7.2.2 Areva Solar Total Company Sales 2011-2015
7.3 Bright Source Energy Inc.
7.3.1 BrightSource Energy Inc. Concentrating Solar Power Selected Recent Contracts / Projects / Programmes 2016
7.4 eSolar Inc.
7.4.1 eSolar Inc. Concentrating Solar Power Selected Recent Contracts / Projects / Programmes 2016
7.5 Acciona S.A.
7.5.1 Acciona S.A. Concentrating Solar Power Selected Recent Contracts / Projects / Programmes 2016
7.5.2 Acciona S.A. Total Company Sales 2011-2015
7.6 Solar Millennium AG
7.6.1 Solar Millennium AG Concentrating Solar Power Selected Recent Contracts / Projects / Programmes 2016
7.7 SolarReserve LLC
7.7.1 SolarReserve LLC Concentrating Solar Power Selected Recent Contracts / Projects / Programmes 2016
7.8 SCHOTT Solar AG
7.9 TSK Flagsol Engineering GmbH
7.9.1 TSk Flagsol Engineering GmbH Concentrating Solar Power Selected Recent Contracts / Projects / Programmes 2016
7.9.2 TSK Flagsol Engineering GmbH Total Company Sales 2011-2015
7.10 GDF SUEZ/Engie
7.10.1 GDF SUEZ/Engie Concentrating Solar Power Selected Recent Contracts / Projects / Programmes 2016
7.10.2 GDF SUEZ/Engie Total Company Sales 2011-2015
7.11 NextEra Energy Resources LLC
7.11.1 NextEra Energy Resources LLC Concentrating Solar Power Selected Recent Contracts / Projects / Programmes 2016
7.11.2 NextEra Energy Resources LLC Total Company Sales 2011-2015
7.12 Other Companies Involved in the Concentrating Solar Power Market 2016
8. Conclusions and Recommendations
8.1 Key Findings
8.2 Recommendations
9. Glossary
List of Tables
Table 1.1 Global Concentrating Solar Power by Country Market Forecast 2017-2027 (US$mn, AGR %, CAGR %, Cumulative)
Table 1.2 Global Concentrating Solar Power By Technology Forecast 2017-2027 (US$mn, AGR %, Cumulative)
Table 3.1 Global Concentrating Solar Power Market Forecast 2017-2027 (US$mn, AGR %, CAGR %, Cumulative)
Table 3.2 Concentrating Solar Power Market Drivers & Restraints
Table 4.1 Global Concentrating Solar Power By Technology Forecast 2017-2027 (US$mn, AGR %, Cumulative)
Table 4.2 Global Concentrating Solar Power By Technology CAGR Forecast 2017-2022, 2022-2027, 2017-2027 (CAGR %)
Table 4.3 Global Concentrating Solar Power Parabolic Trough Technology Submarket by Country Market Forecast 2017-2027 (US$mn, AGR %, CAGR %, Cumulative)
Table 4.4 Global Concentrating Solar Power Market by Parabolic Trough Technology By Country Market CAGR Forecast 2017-2022, 2022-2027, 2017-2027 (CAGR %)
Table 4.5 Global Concentrating Solar Power Linear Fresnel Reflector Technology Submarket by Country Market Forecast 2017-2027 (US$mn, AGR %, CAGR %, Cumulative)
Table 4.6 Global Concentrating Solar Power Market By Linear Fresnel Reflector Technology By Country Market CAGR Forecast 2017-2022, 2022-2027, 2017-2027 (CAGR %)
Table 4.7 Global Concentrating Solar Power Solar Tower Technology Submarket by Country Market Forecast 2017-2027 (US$mn, AGR %, CAGR %, Cumulative)
Table 4.8 Global Concentrating Solar Power Market by Solar Tower Technology By Country Market CAGR Forecast 2017-2022, 2022-2027, 2017-2027 (CAGR %)
Table 4.9 Global Concentrating Solar Power Solar Dish Technology Submarket by Country Market Forecast 2017-2027 (US$mn, AGR %, CAGR %, Cumulative)
Table 4.10 Global Concentrating Solar Power Market by Solar Dish Technology By Country Market CAGR Forecast 2017-2022, 2022-2027, 2017-2027 (CAGR %)
Table 5.1 Leading National Concentrating Solar Power Market Forecast 2017-2027 (US$mn, AGR %, CAGR %, Cumulative)
Table 5.2 U.S. Concentrating Solar Power Market by Technology Forecast 2017-2027 (US$mn, AGR %, CAGR %, Cumulative)
Table 5.3 U.S. Concentrating Solar Power Projects, Project Name, Subcontractor, Technology, Capacity (MW), Status
Table 5.4 Drivers and Restraints in the US Concentrating Solar Power Market
Table 5.5 Spain Concentrating Solar Power Market by Technology Forecast 2017-2027 (US$mn, AGR %, CAGR %, Cumulative)
Table 5.6 Spain Concentrating Solar Power Projects, Project Name, Subcontractor, Technology, Capacity (MW), Status
Table 5.7 Drivers and Restraints in Spain Concentrating Solar Power Market
Table 5.8 Australia Concentrating Solar Power Market by Technology Forecast 2017-2027 (US$mn, AGR %, CAGR %, Cumulative)
Table 5.9 Australia Concentrating Solar Power Projects, Project Name, Subcontractor, Technology, Capacity (MW), Status
Table 5.10 Drivers and Restraints in Australia Concentrating Solar Power Market
Table 5.11 China Concentrating Solar Power Market by Technology Forecast 2017-2027 (US$mn, AGR %, CAGR %, Cumulative)
Table 5.12 China Concentrating Solar Power Projects, Project Name, Subcontractor, Technology, Capacity (MW), Status
Table 5.13 Drivers and Restraints in China Concentrating Solar Power Market
Table 5.14 India Concentrating Solar Power Market by Technology Forecast 2017-2027 (US$mn, AGR %, CAGR %, Cumulative)
Table 5.15 India Concentrating Solar Power Projects, Project Name, Subcontractor, Technology, Capacity (MW), Status
Table 5.16 Drivers and Restraints in India Concentrating Solar Power Market
Table 5.17 Morocco Concentrating Solar Power Market by Technology Forecast 2017-2027 (US$mn, AGR %, CAGR %, Cumulative)
Table 5.18 Morocco Concentrating Solar Power Projects, Project Name, Subcontractor, Technology, Capacity (MW), Status
Table 5.19 Drivers and Restraints in Morocco Concentrating Solar Power Market
Table 5.20 Saudi Arabia Concentrating Solar Power Market by Technology Forecast 2017-2027 (US$mn, AGR %, CAGR %, Cumulative)
Table 5.21 Drivers and Restraints in Saudi Arabia Concentrating Solar Power Market
Table 5.22 South Africa Concentrating Solar Power Market by Technology Forecast 2017-2027 (US$mn, AGR %, CAGR %, Cumulative)
Table 5.23 South Africa Concentrating Solar Power Projects, Project Name, Subcontractor, Technology, Capacity (MW), Status
Table 5.24 Drivers and Restraints in South Africa Concentrating Solar Power Market
Table 5.25 UAE Concentrating Solar Power Market by Technology Forecast 2017-2027 (US$mn, AGR %, CAGR %, Cumulative)
Table 5.26 Drivers and Restraints in UAE Concentrating Solar Power Market
Table 5.27 Chile Concentrating Solar Power Market by Technology Forecast 2017-2027 (US$mn, AGR %, CAGR %, Cumulative)
Table 5.28 Drivers And Restraints in Chile Concentrating Solar Power Market
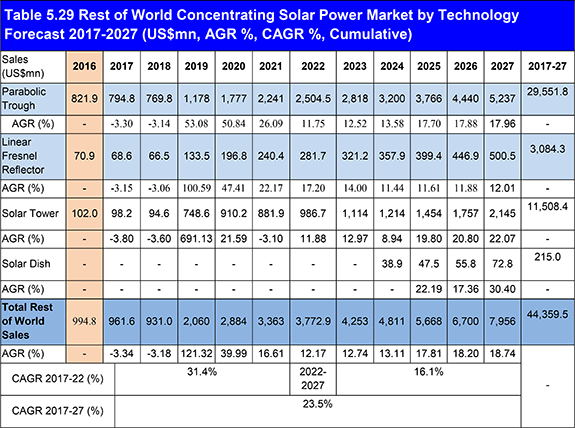
Table 5.29 Rest of World Concentrating Solar Power Market by Technology Forecast 2017-2027 (US$mn, AGR %, CAGR %, Cumulative)
Table 5.30 Drivers and Restraints in Rest of World Concentrating Solar Power Market
Table 6.1 Global Concentrating Solar Power Market SWOT Analysis2017-2027
Table 7.1 Abengoa Solar S.A. Profile 2015 (CEO, Total Company Sales US$m, Sales in the Market US$m, Share of Company Sales from Concentrating Solar Power Market %, Net Income / Loss US$m, Net Capital ExpenditureUS$m, Strongest Business Region, Business Segment in the Market, HQ, Founded, No. of Employees, IR Contact, Ticker, Website)
Table 7.2 Selected Recent Abengoa Solar S.A. Concentrating Solar Power Contracts / Projects / Programmes 2016 (Projects, Country, Subcontractor, Technology, Status and Capacity (MW))
Table 7.3 Abengoa Solar S.A. Total Company Sales 2011-2015 (US$m, AGR %)
Table 7.4 Areva Solar Profile 2015 (CEO, Total Company Sales US$m, Sales in the Market US$m, Share of Company Sales from Concentrating Solar Power Market %, Net Income / Loss US$m, Net Capital ExpenditureUS$m, Strongest Business Region, Business Segment in the Market, HQ, Founded, No. of Employees, IR Contact, Ticker, Website)
Table 7.5 Selected Recent Areva Solar Concentrating Solar Power Contracts / Projects / Programmes 2016(Projects, Country, Subcontractor, Technology, Status and Capacity (MW))
Table 7.6 Areva Solar Total Company Sales 2011-2015 (US$m, AGR %)
Table 7.7 BrightSource Energy Inc. 2015 (CEO, Total Company Sales US$m, Sales in the Market US$m, Share of Company Sales from Concentrating Solar Power Market %, Net Income / Loss US$m, Net Capital ExpenditureUS$m, Strongest Business Region, Business Segment in the Market, HQ, Founded, No. of Employees, IR Contact, Ticker, Website)
Table 7.8 Selected Recent BrightSource Energy Inc. Concentrating Solar Power Contracts / Projects / Programmes 2016(Projects, Country, Subcontractor, Technology, Status and Capacity (MW))
Table 7.9 eSolar Inc. 2015 (CEO, Total Company Sales US$m, Sales in the Market US$m, Share of Company Sales from Concentrating Solar Power Market %, Net Income / Loss US$m, Net Capital ExpenditureUS$m, Strongest Business Region, Business Segment in the Market, HQ, Founded, No. of Employees, IR Contact, Ticker, Website)
Table 7.10 Selected Recent eSolar Inc. Concentrating Solar Power Contracts / Projects / Programmes 2016 (Projects, Country, Subcontractor, Technology, Status, Capacity (MW))
Table 7.11 Acciona S.A. 2015 (CEO, Total Company Sales US$m, Sales in the Market US$m, Share of Company Sales from Concentrating Solar Power Market %, Net Income / Loss US$m, Net Capital Expenditure US$m, Strongest Business Region, Business Segment in the Market, HQ, Founded, No. of Employees, IR Contact, Ticker, Website)
Table 7.12 Selected Recent Acciona S.A. Concentrating Solar Power Contracts / Projects / Programmes 2016 (Projects, Country, Subcontractor, Technology, Status, Capacity (MW))
Table 7.13 Acciona S.A. Total Company Sales 2011-2015 (US$m, AGR %)
Table 7.14 Solar Millennium AG 2015 (CEO, Total Company Sales US$m, Sales in the Market US$m, Share of Company Sales from Concentrating Solar Power Market %, Net Income / Loss US$m, Net Capital Expenditure US$m, Strongest Business Region, Business Segment in the Market, HQ, Founded, No. of Employees, IR Contact, Ticker, Website)
Table 7.15 Selected Recent Solar Millennium AG Concentrating Solar Power Contracts / Projects / Programmes 2016 (Projects, Country, Subcontractor, Technology, Status, Capacity (MW))
Table 7.16 SolarReserve LLC (CEO, Total Company Sales US$m, Sales in the Market US$m, Share of Company Sales from Concentrating Solar Power Market %, Net Income / Loss US$m, Net Capital Expenditure US$m, Strongest Business Region, Business Segment in the Market, HQ, Founded, No. of Employees, IR Contact, Ticker, Website)
Table 7.17 Selected Recent SolarReserve LLC Concentrating Solar Power Contracts / Projects / Programmes 2016 (Projects, Country, Subcontractor, Technology, Status, Capacity (MW))
Table 7.18 SCHOTT Solar AG (CEO, Total Company Sales US$m, Sales in the Market US$m, Share of Company Sales from Concentrating Solar Power %, Net Income / Loss US$m, Net Capital Expenditure US$m, Strongest Business Region, Business Segment in the Market, HQ, Founded, No. of Employees, IR Contact, Ticker, Website)
Table 7.19 TSK Flagsol Engineering GmbH (CEO, Total Company Sales US$m, Sales in the Market US$m, Share of Company Sales from Concentrating Solar Power Market %, Net Income / Loss US$m, Net Capital Expenditure US$m, Strongest Business Region, Business Segment in the Market, HQ, Founded, No. of Employees, IR Contact, Ticker, Website)
Table 7.20 Selected Recent TSk Flagsol Engineering GmbH Concentrating Solar Power Contracts / Projects / Programmes 2016 (Products, Country, Subcontractor, Technology, Status, Capacity (MW))
Table 7.21 TSK Flagsol Engineering GmbH Total Company Sales 2011-2015 (US$m, AGR %)
Table 7.22 GDF Suez/Engie (CEO, Total Company Sales US$m, Sales in the Market US$m, Share of Company Sales from Concentrating Solar Power Market %, Net Income / Loss US$m, Net Capital Expenditure US$m, Strongest Business Region, Business Segment in the Market, HQ, Founded, No. of Employees, IR Contact, Ticker, Website)
Table 7.23 Selected Recent GDF SUEZ/Engie Concentrating solar power Contracts / Projects / Programmes 2016 (Projects, Country, Subcontractor, Technology, Status, Capacity (MW))
Table 7.24 GDF Suez/Engie Total Company Sales 2011-2015 (US$m, AGR %)
Table 7.25 NextEra Energy Resources LLC (CEO, Total Company Sales US$m, Sales in the Market US$m, Share of Company Sales from Concentrating solar power Market %, Net Income / Loss US$m, Net Capital ExpenditureUS$m, Strongest Business Region, Business Segment in the Market, HQ, Founded, No. of Employees, IR Contact, Ticker, Website)
Table 7.26 Selected Recent NextEra Energy Resources LLC Concentrating Solar Power Contracts / Projects / Programmes 2016 (Projects, Country, Subcontractor, Technology, Status, Capacity (MW))
Table 7.27 NextEra Energy Resources LLC Total Company Sales 2011-2015 (US$m, AGR %)
Table 7.28 Other Companies Involved in the Concentrating Solar Power Market 2016 (Company, Location)
Table 8.1 Global Concentrating Solar Power by Country Market Forecast 2017-2027 (US$mn, AGR %, CAGR %, Cumulative)
Table 8.2 Global Concentrating Solar Power By Technology Forecast 2017-2027 (US$mn, AGR %, Cumulative)
List of Figures
Figure 1.1 Concentrating Solar Power Market by Technology Market Share Forecast 2017, 2022, 2027 (% Share)
Figure 2.1 Global Concentrating Solar Power Market Segmentation Overview
Figure 3.1 Global Concentrating Solar Power Market Forecast 2017-2027 (US$mn, AGR %)
Figure 4.1 Global Concentrating Solar Power By Technology AGR Forecast 2017-2027 (AGR %)
Figure 4.2 Global Concentrating Solar Power By Technology Share Forecast 2017 (% Share)
Figure 4.3 Global Concentrating Solar Power By Technology Share Forecast 2022 (% Share)
Figure 4.4 Global Concentrating Solar Power By Technology Range Share Forecast 2027 (% Share)
Figure 4.5 Global Concentrating Solar Power Parabolic Trough Technology by Country Market 2017-2027 (US$mn, Global AGR %)
Figure 4.6 Global Concentrating Solar Power Parabolic Trough Technology By Country Market Forecast 2017 (% Share)
Figure 4.7 Global Concentrating Solar Power Parabolic Trough Technology By Country Market Forecast 2022 (% Share)
Figure 4.8 Global Concentrating Solar Power Parabolic Trough Technology By Country Market Forecast 2027 (% Share)
Figure 4.9 Global Concentrating Solar Power Linear Fresnel Reflector By Country Market 2017-2027 (US$mn, Global AGR %)
Figure 4.10 Global Concentrating Solar Power Linear Fresnel Reflector Technology By Country Market Forecast 2017 (% Share)
Figure 4.11 Global Concentrating Solar Power Linear Fresnel Reflector Technology By Country Market Forecast 2022 (% Share)
Figure 4.12 Global Concentrating Solar Power Linear Fresnel Reflector Technology By Country Market Forecast 2027 (% Share)
Figure 4.13 Global Concentrating Solar Power Solar Tower By Country Market 2017-2027 (US$mn, Global AGR %)
Figure 4.14 Global Concentrating Solar Power Solar Tower Technology By Country Market Forecast 2017 (% Share)
Figure 4.15 Global Concentrating Solar Power Solar Tower Technology By Country Market Forecast 2022 (% Share)
Figure 4.16 Global Concentrating Solar Power Solar Tower Technology By Country Market Forecast 2027 (% Share)
Figure 4.17 Global Concentrating Solar Power Solar Dish By Country Market 2017-2027 (US$Mn, Global AGR %)
Figure 4.18 Global Concentrating Solar Power Solar Dish Technology By Country Market Forecast 2017 (% Share)
Figure 4.19 Global Concentrating Solar Power Solar Dish Technology By Country Market Forecast 2022 (% Share)
Figure 4.20 Global Concentrating Solar Power Solar Dish Technology By Country Market Forecast 2027 (% Share)
Figure 5.1 Leading National Concentrating Solar Power Market Forecast 2017-2027 (US$mn, AGR%)
Figure 5.2 Leading National Concentrating Solar Power Market Forecast 2017 (%)
Figure 5.3 Leading National Concentrating Solar Power Market Forecast 2022 (%)
Figure 5.4 Leading National Concentrating Solar Power Market Forecast 2027 (%)
Figure 5.5 Leading National Concentrating Solar Power Market Forecast 2017-2027 (US$mn)
Figure 5.6 Leading National Concentrating Solar Power Market Cumulative Total Sales 2017-2027 (US$mn)
Figure 5.7 US Concentrating Solar Power By Technology AGR Forecast 2017-2027 (AGR %)
Figure 5.8 U.S.Concentrating Solar Power Market Forecast by Technology 2017-2027 (US$mn, AGR%)
Figure 5.9 U.S. Concentrating Solar Power Market Share by Technology Forecast 2017, 2022, 2027 (% Share)
Figure 5.10 Spain Concentrating Solar Power Market by Technology Forecast 2017-2027 (US$mn, AGR%)
Figure 5.11 Spain Concentrating Solar Power Market Share by Technology Forecast 2017, 2022, 2027 (% Share)
Figure 5.12 Australia Concentrating Solar Power Market by Technology Forecast 2017-2027 (US$mn, AGR%)
Figure 5.13 Australia Concentrating Solar Power Market by Technology Share Forecast 2017, 2022, 2027 (% Share)
Figure 5.14 China Concentrating Solar Power Market by Technology Forecast 2017-2027 (US$mn, AGR%)
Figure 5.15 China Concentrating Solar Power Market Share by Technology Forecast 2017, 2022, 2027 (% Share)
Figure 5.16 India Concentrating Solar Power Market by Technology Forecast 2017-2027 (US$mn, AGR%)
Figure 5.17 India Concentrating Solar Power Market Share by Technology Forecast 2017, 2022, 2027 (% Share)
Figure 5.18 Morocco Concentrating Solar Power Market by Technology Forecast 2017-2027 (US$mn, AGR%)
Figure 5.19 Morocco Concentrating Solar Power Market Share by Technology Forecast 2017, 2022, 2027 (% Share)
Figure 5.20 Saudi Arabia Concentrating Solar Power Market by Technology Forecast 2017-2027 (US$mn, AGR%)
Figure 5.21 Saudi Arabia Concentrating Solar Power Market Share by Technology Forecast 2022, 2027 (% Share)
Figure 5.22 South Africa Concentrating Solar Power Market Technology Forecast 2017-2027 (US$mn, AGR%)
Figure 5.23 South Africa Concentrating Solar Power Market Share by Technology Forecast 2017, 2022, 2027 (% Share)
Figure 5.24 UAE Concentrating Solar Power Market by Technology Forecast 2017-2027 (US$mn, AGR%)
Figure 5.25 UAE Concentrating Solar Power Market Share by Technology Forecast 2017, 2022, 2027 (% Share)
Figure 5.26 Chile Concentrating Solar Power Market by Technology Forecast 2017-2027 (US$mn, AGR%)
Figure 5.27 Chile Concentrating Solar Power Market Share Forecast 2022, 2027 (% Share)
Figure 5.28 Rest of World Concentrating Solar Power Market by Technology Forecast 2017-2027 (US$mn, AGR%)
Figure 5.29 Rest of World Concentrating Solar Power Market Share by Technology Forecast 2017, 2022, 2027 (% Share)
Figure 7.1 Abengoa Solar S.A. Total Company Sales 2011-2015 (US$m, AGR %)
Figure 7.2 Areva Solar Total Company Sales 2011-2015 (US$m, AGR %)
Figure 7.3 Acciona S.A. Total Company Sales 2011-2015 (US$m, AGR %)
Figure 7.4 TSK Flagsol Engineering GmbH Total Company Sales 2011-2015 (US$m, AGR %)
Figure 7.5 GDF Suez/Engie Company Sales 2011-2015 (US$m, AGR %)
Figure 7.6 NextEra Energy Resources LLC Company Sales 2011-2015 (US$m, AGR %)


