CNS Therapeutics Market– Our new study reveals trends, R&D progress, and predicted revenues over the next decade
Analyst Commentary
The global CNS Therapeutics market is projected to reach US$xx billion by 2031 from its previous value of US$xx billion in 2021 while growing at a CAGR of xx% from 2021 to 2031. COVID-19 pandemic is one of the unprecedented situations; the world has faced nearly in a century. Due to the rapid transmittal of the disease, there has been a sharp increase in number of cases worldwide. While some countries have crossed their peak and are returning to normal, many others are seeing ever-rising numbers. As of December 2020, the U.S. remains the worst affected country. However, COVID-19 has significantly affected the CNS drugs market and additionally the healthcare sector. With complete lockdowns, the pharmaceutical supply chain has been hampered during the year 2020. This has caused a shortage of medicines in countries with increasing demand for CNS drugs. However, Visiongain predicts that the scenario is likely to change in future due to easing of restrictions and reopening of international borders for trade.
Regional Analysis
Based on regions, the global CNS therapeutics market is segmented into North America, Europe, Asia Pacific, Latin America, and Middle East & Africa. According to Visiongain analysis, North America dominated the global market due to high number of approved drugs, high awareness levels regarding diagnosis and management of diseases. Furthermore, government funds for geriatric population is also one of the major reason for North America being dominant across the globe. Asia Pacific is anticipated to emerge as the most lucrative region over the forecast period.
Disease Analysis
On the basis of disease, the global CNS therapeutics market has been divided into neurovascular disease, trauma, mental health, degeneration, others. Of which mental health dominated the global market by contributing over 39.0% in 2020 and is predicted to maintain its market position to 41.8% in 2031.
How are prominent players reinforcing their position across the global business?
Our report reveals the technologies and companies that hold the greatest potential. In particular, exploring and analyzing the activities of these companies. See where the expected gains will be. View Visiongain’s assessment of the prospects for established competitors, rising companies, and new market entrants. Our work explains that potential, helping you stay ahead. Gain a thorough understanding of the competitive landscape with profiles of leading companies examining their positioning, capabilities, product portfolios, R&D activity, services, focus, strategies, M&A activity, and outlook.
Discover how to stay ahead
Our 320+ pages report provides 400+ tables and charts/graphs. Read on to discover the most lucrative areas in the industry and the future market prospects. Our new study lets you assess forecasted sales at overall world market and regional level. See financial results, trends, opportunities, and revenue predictions. Much opportunity remains in this growing CNS Therapeutics Market. See how to exploit the opportunities.

CNS Therapeutics Market Segmentation
Disease
• Neurovascular Disease
• Trauma
• Mental Health
• Degenerative
• Others
End-user
• Hospitals
• Home Care
• Others
Region
• North America
• Europe
• Asia Pacific
• Latin America
• Middle East and Africa
Need industry data? Please contact us today.
COVID-19 Impact Recovery Scenarios
This report includes Baseline Forecasts along with Different Rebound Scenarios to help analyze the global CNS therapeutics market-no matter how COVID-19 affects the economy.
To access the data contained in this document please email contactus@visiongain.com
Forecasts to 2031 and other analyses reveal the commercial prospects
• In addition to revenue forecasting to 2031, our new study provides you with recent results, growth rates, and market shares.
• You find original analyses, with business outlooks and developments.
• Discover qualitative analyses (including market dynamics, drivers, opportunities, restraints, and challenges), product profiles and commercial developments.
Leading countries and the potential for market growth
Overall world revenue for CNS therapeutics Market will surpass $xx billion in 2021, our work calculates. We predict strong revenue growth through to 2031. Our work identifies which organizations hold the greatest potential. Discover their capabilities, progress, and commercial prospects, helping you stay ahead.
How the CNS Therapeutics Market report helps you
In summary, our 320+ page report provides you with the following knowledge:
• Revenue forecasts to 2031 for CNS therapeutics Market, with forecasts for disease and end use, each forecasted at a global and regional level– discover the industry’s prospects, finding the most lucrative places for investments and revenues
• Revenue forecasts to 2031 for 5 regional and 17 key national markets– See forecasts for the CNS therapeutics market in North America, Europe, Asia-Pacific, Latin America, and Middle East and Africa. Also forecasted is the market in the US, Canada, Germany, UK, France, Italy, Russia, Spain, Japan, China, India, Brazil, Mexico, UAE, and South Africa among other prominent economies.
• Prospects for established firms and those seeking to enter the market– including company profiles for more than 15 of the major companies involved in the CNS therapeutics Market. Some of the companies profiled in this report are Johnson & Johnson Services, Inc., Pfizer Inc., Novartis AG, GSK, Merck KGaA, F. Hoffmann-La Roche Ltd., Amgen Inc., AstraZeneca PLC, Mitsubishi Tanabe Pharma Corporation, Otsuka Pharmaceutical Co., Ltd, Biogen Inc, Corestem, AB Science, Sun Pharmaceutical, Ionis Pharmaceuticals, Inc, Amylyx Pharmaceuticals, BrainStorm Therapeutics.
Find quantitative and qualitative analyses with independent predictions. Receive information that only our report contains, staying informed with this invaluable business intelligence.
Information found nowhere else
With our newly report title, you are less likely to fall behind in knowledge or miss out on opportunities. See how our work could benefit your research, analyses, and decisions. Visiongain’s study is for everybody needing commercial analyses for the CNS therapeutics market and leading companies. You will find data, trends, and predictions.
Who should read this report?
• Senior Executives
• Business Development Managers
• Marketing Directors
• Consultants
• Chief Executive Officers
• Governments, agencies & organizations actively working or interested in the CNS therapeutics industry will also find significant value in our research.
Customization Available: Global CNS Therapeutics Market
• Do you have any custom requirements we can help you with?
• Any specific country, geography, country, market segment or specific company information?
To access the data contained in this document please email contactus@visiongain.com
Buy our report today CNS Therapeutics Market Report 2021-2031: Forecasts by Diseases (Neurovascular Disease, Trauma, Mental Health, Degenerative, Others), by End Users (Hospitals, Home Care, Others) AND Leading National Market Analysis PLUS Analysis of Leading CNS Therapeutics Companies AND COVID-19 Recovery Scenarios. Avoid missing out by staying informed – order our report now.
Visiongain is a trading partner with the US Federal Government
CCR Ref number: KD4R6
Do you have any custom requirements we can help you with? Any need for a specific country, geo region, market segment or specific company information? Contact us today, we can discuss your needs and see how we can help: sara.peerun@visiongain.com
1. Global CNS Therapeutics Market 2020-2031
1.1 Executive Summary
1.2 Why You Should Read This Report
1.3 What This Report Delivers
1.4 Key Questions Answered by This Analytical Report Include:
1.5 Who is This Report For?
1.6 Methodology
1.7 Frequently Asked Questions (FAQs)
1.8 Associated Visiongain Reports
1.9 About Visiongain
2 Introduction to the CNS Therapeutics Market
2.1 Introduction to the CNS Therapeutics
2.1.1 Global Burden of CNS Disease
2.2 CNS Therapeutics Segmentation
2.2.1 CNS Therapeutics Segmentation
3 Industry Insights
3.1 Market Drivers
3.1.1 Increasing geriatric population to trigger overall rise in neurological disorders
3.1.2 Increasing awareness in society regarding CNS disorders by social groups
3.1.3 Increasing pipeline and research with special focus on Alzheimer’s Disease
3.2 Market Restraints/Challenges
3.2.1 Large number of failed trial candidates
3.3 Market Opportunities
3.3.1 Countries with highest ratio of geriatric population
3.4 Porter’s five forces
3.4.1 Bargaining Power of Buyers
3.4.2 Bargaining Power of Suppliers
3.4.3 Threat of Substitutes
3.4.4 Threat of New Entrants
3.4.5 Industry Rivalry
3.5 SWOT Analysis
3.5.1 Strength
3.5.2 Weakness
3.5.3 Opportunities
3.5.4 Threat
4 Global CNS Therapeutics Market by End Users
4.1 Hospitals Submarket Forecast 2020-2031
4.1.1 Global CNS Therapeutics Market for Hospitals Segment: Revenue Forecast, V Shaped Recovery
4.1.2 Global CNS Therapeutics Market for Hospitals Segment: Revenue Forecast, U Shaped Recovery
4.1.3 Global CNS Therapeutics Market for Hospitals Segment: Revenue Forecast, W Shaped Recovery
4.1.4 Global CNS Therapeutics Market for Hospitals Segment: Revenue Forecast, L Shaped Recovery
4.2 Home Care Submarket Forecast 2020-2031
4.2.1 Global CNS Therapeutics Market for Home Care Segment: Revenue Forecast, V Shaped Recovery
4.2.2 Global CNS Therapeutics Market for Home Care Segment: Revenue Forecast, U Shaped Recovery
4.2.3 Global CNS Therapeutics Market for Home Care Segment: Revenue Forecast, W Shaped Recovery
4.2.4 Global CNS Therapeutics Market for Hospitals Segment: Revenue Forecast, L Shaped Recovery
4.3 Others Submarket Forecast 2020-2031
4.3.1 Global CNS Therapeutics Market for Others Segment: Revenue Forecast, V Shaped Recovery
4.3.2 Global CNS Therapeutics Market for Others Segment: Revenue Forecast, U Shaped Recovery
4.3.3 Global CNS Therapeutics Market for Others Segment: Revenue Forecast, W Shaped Recovery
4.3.4 Global CNS Therapeutics Market for Others Segment: Revenue Forecast, L Shaped Recovery
5 Global CNS Therapeutics Market by Disease
5.1 Neurovascular Disease Submarket Forecast 2020-2031
5.1.1 Global CNS Therapeutics Market for Neurovascular Disease Segment: Revenue Forecast, V Shaped Recovery
5.1.2 Global CNS Therapeutics Market for Neurovascular Disease Segment: Revenue Forecast, U Shaped Recovery
5.1.3 Global CNS Therapeutics Market for Neurovascular Disease Segment: Revenue Forecast, W Shaped Recovery
5.1.4 Global CNS Therapeutics Market for Neurovascular Disease Segment: Revenue Forecast, L Shaped Recovery
5.2 Trauma Submarket Forecast 2020-2031
5.2.1 Global CNS Therapeutics Market for Trauma Segment: Revenue Forecast, V Shaped Recovery
5.2.2 Global CNS Therapeutics Market for Trauma Segment: Revenue Forecast, U Shaped Recovery
5.2.3 Global CNS Therapeutics Market for Trauma Segment: Revenue Forecast, W Shaped Recovery
5.2.4 Global CNS Therapeutics Market for Trauma Segment: Revenue Forecast, L Shaped Recovery
5.3 Mental Health Submarket Forecast 2020-2031
5.3.1 Global CNS Therapeutics Market for Mental Health Segment: Revenue Forecast, V Shaped Recovery
5.3.2 Global CNS Therapeutics Market for Mental Health Segment: Revenue Forecast, U Shaped Recovery
5.3.3 Global CNS Therapeutics Market for Mental Health Segment: Revenue Forecast, W Shaped Recovery
5.3.4 Global CNS Therapeutics Market for Mental Health Segment: Revenue Forecast, L Shaped Recovery
5.4 Degenerative Submarket Forecast 2020-2031
5.4.1 Global CNS Therapeutics Market for Degenerative Segment: Revenue Forecast, V Shaped Recovery
5.4.2 Global CNS Therapeutics Market for Degenerative Segment: Revenue Forecast, U Shaped Recovery
5.4.3 Global CNS Therapeutics Market for Degenerative Segment: Revenue Forecast, W Shaped Recovery
5.4.4 Global CNS Therapeutics Market for Degenerative Segment: Revenue Forecast, L Shaped Recovery
5.5 Others Submarket Forecast 2020-2031
5.5.1 Global CNS Therapeutics Market for Others Segment: Revenue Forecast, V Shaped Recovery
5.5.2 Global CNS Therapeutics Market for Others Segment: Revenue Forecast, U Shaped Recovery
5.5.3 Global CNS Therapeutics Market for Others Segment: Revenue Forecast, W Shaped Recovery
5.5.4 Global CNS Therapeutics Market for Others Segment: Revenue Forecast, L Shaped Recovery
6 Regional and Leading National CNS Therapeutics Forecasts 2020-2031
6.1 Global CNS Therapeutics by National Market Share Forecast 2020-2031
6.2 North America CNS Therapeutics Forecast 2020-2031
6.2.1 North America CNS Therapeutics Market Forecast by Country, 2021-2031 (US$ bn, AGR%, CAGR%)
6.2.2 North America CNS Therapeutics Market Forecast by End Use, 2021-2031 (US$ bn, AGR%, CAGR%
6.2.3 North America CNS Therapeutics Market Forecast by Disease, 2021-2031 (US$ bn, AGR%, CAGR%)
6.2.4 North America CNS Therapeutics Market: Revenue Forecast, V Shaped Recovery
6.2.5 North America CNS Therapeutics Market: Revenue Forecast, U Shaped Recovery
6.2.6 North America CNS Therapeutics Market: Revenue Forecast, W Shaped Recovery
6.2.7 North America CNS Therapeutics Market: Revenue Forecast, L Shaped Recovery
6.2.8 U.S. CNS Therapeutics Forecast 2020-2031
6.2.8.1 U.S. CNS Therapeutics Market: Revenue Forecast, V Shaped Recovery
6.2.8.2 U.S. CNS Therapeutics Market: Revenue Forecast, U Shaped Recovery
6.2.8.3 U.S. CNS Therapeutics Market: Revenue Forecast, W Shaped Recovery
6.2.8.4 U.S. CNS Therapeutics Market: Revenue Forecast, L Shaped Recovery
6.2.9 Canada CNS Therapeutics Forecast 2020-2031
6.2.9.1 Canada CNS Therapeutics Market: Revenue Forecast, V Shaped Recovery
6.2.9.2 Canada CNS Therapeutics Market: Revenue Forecast, U Shaped Recovery
6.2.9.3 Canada CNS Therapeutics Market: Revenue Forecast, W Shaped Recovery
6.2.9.4 Canada CNS Therapeutics Market: Revenue Forecast, L Shaped Recovery
6.3 Europe CNS Therapeutics Forecast 2020-2031
6.3.1 Europe CNS Therapeutics Market Forecast by Country, 2021-2031 (US$ bn, AGR%, CAGR%)
6.3.2 Europe CNS Therapeutics Market Forecast by End Use, 2021-2031 (US$ bn, AGR%, CAGR%)
6.3.3 Europe CNS Therapeutics Market Forecast by Disease, 2021-2031 (US$ bn, AGR%, CAGR%)
6.3.4 Europe CNS Therapeutics Market: Revenue Forecast, V Shaped Recovery
6.3.5 Europe CNS Therapeutics Market: Revenue Forecast, U Shaped Recovery
6.3.6 Europe CNS Therapeutics Market: Revenue Forecast, W Shaped Recovery
6.3.7 Europe CNS Therapeutics Market: Revenue Forecast, L Shaped Recovery
6.3.8 UK CNS Therapeutics Forecast 2020-2031
6.3.8.1 UK CNS Therapeutics Market: Revenue Forecast, V Shaped Recovery
6.3.8.2 UK CNS Therapeutics Market: Revenue Forecast, U Shaped Recovery
6.3.8.3 UK CNS Therapeutics Market: Revenue Forecast, W Shaped Recovery
6.3.8.4 UK CNS Therapeutics Market: Revenue Forecast, L Shaped Recovery
6.3.9 France CNS Therapeutics Forecast 2020-2031
6.3.9.1 France CNS Therapeutics Market: Revenue Forecast, V Shaped Recovery
6.3.9.2 France CNS Therapeutics Market: Revenue Forecast, U Shaped Recovery
6.3.9.3 France CNS Therapeutics Market: Revenue Forecast, W Shaped Recovery
6.3.9.4 France CNS Therapeutics Market: Revenue Forecast, L Shaped Recovery
6.3.10 Germany CNS Therapeutics Forecast 2020-2031
6.3.10.1Germany CNS Therapeutics Market: Revenue Forecast, V Shaped Recovery
6.3.10.2Germany CNS Therapeutics Market: Revenue Forecast, U Shaped Recovery
6.3.10.3Germany CNS Therapeutics Market: Revenue Forecast, W Shaped Recovery
6.3.10.4Germany CNS Therapeutics Market: Revenue Forecast, L Shaped Recovery
6.3.11 Italy CNS Therapeutics Forecast 2020-2031
6.3.11.1 Italy CNS Therapeutics Market: Revenue Forecast, V Shaped Recovery
6.3.11.2 Italy CNS Therapeutics Market: Revenue Forecast, U Shaped Recovery
6.3.11.3 Italy CNS Therapeutics Market: Revenue Forecast, W Shaped Recovery
6.3.11.4 Italy CNS Therapeutics Market: Revenue Forecast, L Shaped Recovery
6.3.12 Spain CNS Therapeutics Forecast 2020-2031
6.3.12.1 Spain CNS Therapeutics Market: Revenue Forecast, V Shaped Recovery
6.3.12.2 Spain CNS Therapeutics Market: Revenue Forecast, U Shaped Recovery
6.3.12.3 Spain CNS Therapeutics Market: Revenue Forecast, W Shaped Recovery
6.3.12.4 Spain CNS Therapeutics Market: Revenue Forecast, L Shaped Recovery
6.3.13 Russia CNS Therapeutics Forecast 2020-2031
6.3.13.1 Russia CNS Therapeutics Market: Revenue Forecast, V Shaped Recovery
6.3.13.2 Russia CNS Therapeutics Market: Revenue Forecast, U Shaped Recovery
6.3.13.3 Russia CNS Therapeutics Market: Revenue Forecast, W Shaped Recovery
6.3.13.4 Russia CNS Therapeutics Market: Revenue Forecast, L Shaped Recovery
6.3.14 Denmark CNS Therapeutics Forecast 2020-2031
6.3.14.1 Denmark CNS Therapeutics Market: Revenue Forecast, V Shaped Recovery
6.3.14.2 Denmark CNS Therapeutics Market: Revenue Forecast, U Shaped Recovery
6.3.14.3 Denmark CNS Therapeutics Market: Revenue Forecast, W Shaped Recovery
6.3.14.4 Denmark CNS Therapeutics Market: Revenue Forecast, L Shaped Recovery
6.3.15 Netherland CNS Therapeutics Forecast 2020-2031
6.3.15.1 Netherland CNS Therapeutics Market: Revenue Forecast, V Shaped Recovery
6.3.15.2 Netherland CNS Therapeutics Market: Revenue Forecast, U Shaped Recovery
6.3.15.3 Netherland CNS Therapeutics Market: Revenue Forecast, W Shaped Recovery
6.3.15.4 Netherland CNS Therapeutics Market: Revenue Forecast, L Shaped Recovery
6.3.16 Rest of Europe CNS Therapeutics Forecast 2020-2031
6.3.16.1 Rest of Europe CNS Therapeutics Market: Revenue Forecast, V Shaped Recovery
6.3.16.2 Rest of Europe CNS Therapeutics Market: Revenue Forecast, U Shaped Recovery
6.3.16.3 Rest of Europe CNS Therapeutics Market: Revenue Forecast, W Shaped Recovery
6.3.16.4 Rest of Europe CNS Therapeutics Market: Revenue Forecast, L Shaped Recovery
6.4 Asia Pacific CNS Therapeutics Forecast 2020-2031
6.4.1 APAC CNS Therapeutics Market Forecast by Country, 2021-2031 (US$ bn, AGR%, CAGR%)
6.4.2 APAC CNS Therapeutics Market Forecast by End Use, 2021-2031 (US$ bn, AGR%, CAGR%)
6.4.3 APAC CNS Therapeutics Market Forecast by Disease, 2021-2031 (US$ bn, AGR%, CAGR%)
6.4.4 Asia Pacific CNS Therapeutics Market: Revenue Forecast, V Shaped Recovery
6.4.5 Asia Pacific CNS Therapeutics Market: Revenue Forecast, U Shaped Recovery
6.4.6 Asia Pacific CNS Therapeutics Market: Revenue Forecast, W Shaped Recovery
6.4.7 Asia Pacific CNS Therapeutics Market: Revenue Forecast, L Shaped Recovery
6.4.8 China CNS Therapeutics Forecast 2020-2031
6.4.8.1 China CNS Therapeutics Market: Revenue Forecast, V Shaped Recovery
6.4.8.2 China CNS Therapeutics Market: Revenue Forecast, U Shaped Recovery
6.4.8.3 China CNS Therapeutics Market: Revenue Forecast, W Shaped Recovery
6.4.8.4 China CNS Therapeutics Market: Revenue Forecast, L Shaped Recovery
6.4.9 India CNS Therapeutics Forecast 2020-2031
6.4.9.1 India CNS Therapeutics Market: Revenue Forecast, V Shaped Recovery
6.4.9.2 India CNS Therapeutics Market: Revenue Forecast, U Shaped Recovery
6.4.9.3 India CNS Therapeutics Market: Revenue Forecast, W Shaped Recovery
6.4.9.4 India CNS Therapeutics Market: Revenue Forecast, L Shaped Recovery
6.4.10 Japan CNS Therapeutics Forecast 2020-2031
6.4.10.1 Japan CNS Therapeutics Market: Revenue Forecast, V Shaped Recovery
6.4.10.2 Japan CNS Therapeutics Market: Revenue Forecast, U Shaped Recovery
6.4.10.3 Japan CNS Therapeutics Market: Revenue Forecast, W Shaped Recovery
6.4.10.4 Japan CNS Therapeutics Market: Revenue Forecast, L Shaped Recovery
6.5 Latin America CNS Therapeutics Forecast 2020-2031
6.5.1 Latin America CNS Therapeutics Market Forecast by Country, 2021-2031 (US$ bn, AGR%, CAGR%)
6.5.2 Latin America CNS Therapeutics Market Forecast by End Use, 2021-2031 (US$ bn, AGR%, CAGR%)
6.5.3 Latin America CNS Therapeutics Market Forecast by Disease, 2021-2031 (US$ bn, AGR%, CAGR%)
6.5.4 Latin America CNS Therapeutics Market: Revenue Forecast, V Shaped Recovery
6.5.5 Latin America CNS Therapeutics Market: Revenue Forecast, U Shaped Recovery
6.5.6 Latin America CNS Therapeutics Market: Revenue Forecast, W Shaped Recovery
6.5.7 Latin America CNS Therapeutics Market: Revenue Forecast, L Shaped Recovery
6.5.8 Brazil CNS Therapeutics Forecast 2020-2031
6.5.8.1 Brazil CNS Therapeutics Market: Revenue Forecast, V Shaped Recovery
6.5.8.2 Brazil CNS Therapeutics Market: Revenue Forecast, U Shaped Recovery
6.5.8.3 Brazil CNS Therapeutics Market: Revenue Forecast, W Shaped Recovery
6.5.8.4 Brazil CNS Therapeutics Market: Revenue Forecast, L Shaped Recovery
6.5.9 Mexico CNS Therapeutics Forecast 2020-2031
6.5.9.1 Mexico CNS Therapeutics Market: Revenue Forecast, V Shaped Recovery
6.5.9.2 Mexico CNS Therapeutics Market: Revenue Forecast, U Shaped Recovery
6.5.9.3 Mexico CNS Therapeutics Market: Revenue Forecast, W Shaped Recovery
6.5.9.4 Mexico CNS Therapeutics Market: Revenue Forecast, L Shaped Recovery
6.5.10 Rest of LATAM CNS Therapeutics Forecast 2020-2031
6.5.10.1 Rest of LATAM CNS Therapeutics Market: Revenue Forecast, V Shaped Recovery
6.5.10.2 Rest of LATAM CNS Therapeutics Market: Revenue Forecast, U Shaped Recovery
6.5.10.3 Rest of LATAM CNS Therapeutics Market: Revenue Forecast, W Shaped Recovery
6.5.10.4 Rest of LATAM CNS Therapeutics Market: Revenue Forecast, L Shaped Recovery
6.6 Middle East and Africa CNS Therapeutics Forecast 2020-2031
6.6.1 Middle East and Africa CNS Therapeutics Market Forecast by Country, 2021-2031 (US$ bn, AGR%, CAGR%)
6.6.2 Middle East and Africa CNS Therapeutics Market Forecast by End Use, 2021-2031 (US$ bn, AGR%, CAGR%)
6.6.3 Middle East and Africa CNS Therapeutics Market Forecast by Disease, 2021-2031 (US$ bn, AGR%, CAGR%)
6.6.4 Middle East and Africa CNS Therapeutics Market: Revenue Forecast, V Shaped Recovery
6.6.5 Middle East and Africa CNS Therapeutics Market: Revenue Forecast, U Shaped Recovery
6.6.6 Middle East and Africa CNS Therapeutics Market: Revenue Forecast, W Shaped Recovery
6.6.7 Middle East and Africa CNS Therapeutics Market: Revenue Forecast, L Shaped Recovery
6.6.8 UAE CNS Therapeutics Forecast 2020-2031
6.6.8.1 UAE CNS Therapeutics Market: Revenue Forecast, V Shaped Recovery
6.6.8.2 UAE CNS Therapeutics Market: Revenue Forecast, U Shaped Recovery
6.6.8.3 UAE CNS Therapeutics Market: Revenue Forecast, W Shaped Recovery
6.6.8.4 UAE CNS Therapeutics Market: Revenue Forecast, L Shaped Recovery
6.6.9 South Africa CNS Therapeutics Forecast 2020-2031
6.6.9.1 South Africa CNS Therapeutics Market: Revenue Forecast, V Shaped Recovery
6.6.9.2 South Africa CNS Therapeutics Market: Revenue Forecast, U Shaped Recovery
6.6.9.3 South Africa CNS Therapeutics Market: Revenue Forecast, W Shaped Recovery
6.6.9.4 South Africa CNS Therapeutics Market: Revenue Forecast, L Shaped Recovery
6.6.10 Rest of MEA CNS Therapeutics Forecast 2020-2031
6.6.10.1 Rest of MEA CNS Therapeutics Market: Revenue Forecast, V Shaped Recovery
6.6.10.2 Rest of MEA CNS Therapeutics Market: Revenue Forecast, U Shaped Recovery
6.6.10.3 Rest of MEA CNS Therapeutics Market: Revenue Forecast, W Shaped Recovery
6.6.10.4 Rest of MEA CNS Therapeutics Market: Revenue Forecast, L Shaped Recovery
7 Leading Companies in the CNS Therapeutics
7.1 Johnson & Johnson Services, Inc.
7.1.1 Company Overview
7.1.2 Products / Services
7.1.3 Financials, 2015-2019 (US$ million, AGR %)
7.2 Pfizer Inc.
7.2.1 Company Overview
7.2.2 Products / Services
7.2.3 Financials, 2015-2019 (US$ million, AGR %)
7.3 Novartis AG
7.3.1 Company Overview
7.3.2 Products / Services
7.3.3 Total Company Sales, 2015-2018
7.4 GSK
7.4.1 Company Overview
7.4.2 Products / Services
7.4.3 Financials, 2015-2019 (US$ million, AGR %)
7.5 Merck KGaA
7.5.1 Company Overview
7.5.2 Products / Services
7.5.3 Financials, 2015-2019 (US$ million, AGR %)
7.6 F. Hoffmann-La Roche Ltd.
7.6.1 Company Overview
7.6.2 Products / Services
7.6.3 Financials, 2015-2019 (US$ million, AGR %)
7.7 Amgen Inc.
7.7.1 Company Overview
7.7.2 Products / Services
7.7.3 Financials, 2015-2019 (US$ million, AGR %)
7.8 AstraZeneca PLC
7.8.1 AstraZeneca PLC: Company Snapshot
7.8.2 AstraZeneca PLC: Company Overview
7.8.3 Products / Services
7.8.4 AstraZeneca PLC: Financials
7.9 Mitsubishi Tanabe Pharma Corporation
7.9.1 Total Company Sales 2016 - 2019
7.9.2 Products / Services
7.9.3 Mergers & Acquisitions (M&A) Activity
7.10 Otsuka Pharmaceutical Co., Ltd
7.10.1 Total Company Sales 2016 - 2019
7.10.2 Products / Services
7.11 Biogen Inc
7.11.1 Total Company Sales 2016 - 2019
7.11.2 Products / Services
7.12 Corestem
7.12.1 Total Company Sales 2016 - 2019
7.12.2 Products / Services
7.12.3 Mergers & Acquisitions (M&A) Activity
7.13 AB Science
7.13.1 Total Company Sales 2016 - 2018
7.13.2 Products / Services
7.13.3 Mergers & Acquisitions (M&A) Activity
7.14 F.Hoffmann-La Roche AG
7.14.1 Total Company Sales 2016 - 2019
7.14.2 Products / Services
7.15 Sun Pharmaceutical
7.15.1 Total Company Sales 2016 - 2019
7.15.2 Products / Services
7.16 Ionis Pharmaceuticals, Inc
7.16.1 Total Company Sales 2016 - 2019
7.16.2 Products / Services
7.16.3 Mergers & Acquisitions (M&A) Activity
7.17 Amylyx Pharmaceuticals
7.17.1 Products / Services
7.17.2 Mergers & Acquisitions (M&A) Activity
7.18 BrainStorm Therapeutics
7.18.1 Products / Services
7.18.2 Mergers & Acquisitions (M&A) Activity
8 Conclusions and Recommendations
8.1 Associated Visiongain Reports
9 Glossary
List of Tables
Table 1. Global CNS Therapeutics Market, Executive Summary, 2020-2030, CAGR(%), USD (billion)
Table 2. Number of DALYs for neurological disorders and as percentage of global DALYs projected for 2005, 2015 and 2030
Table 3. Stages and symptoms of dementia (Alzheimer’s disease)
Table 4. Agents in Phase 3 of Alzheimer's disease drug development
Table 5. Top 20 Countries with the largest percentage of older adults
Table 6. Top Countries Largest Share of People Age 65-85
Table 7. Key Factors Affecting the Bargaining Power of Buyer
Table 8. Key Factors Affecting the Bargaining Power of Suppliers
Table 9. Key Factors Affecting the Threat of Substitutes
Table 10. Key Factors Affecting the Threat of New Entrants
Table 11. Key Factors Affecting the Industry Rivalry
Table 12. Global CNS Therapeutics Market Forecast by End Use, 2021-2031 (US$ bn, AGR%, CAGR%)
Table 13. Global CNS Therapeutics Market Forecast by Hospitals, 2021-2031 (US$ bn, AGR%, CAGR%)
Table 18. Global CNS Therapeutics Market Forecast by Home Care, 2021-2031 (US$ bn, AGR%, CAGR%)
Table 23. Global CNS Therapeutics Market Forecast by Others, 2021-2031 (US$ bn, AGR%, CAGR%)
Table 28. Global CNS Therapeutics Market Forecast by Disease, 2021-2031 (US$ bn, AGR%, CAGR%)
Table 29. Global CNS Therapeutics Market Forecast by Neurovascular Disease, 2021-2031 (US$ bn, AGR%, CAGR%)
Table 34. Global CNS Therapeutics Market Forecast by Trauma, 2021-2031 (US$ bn, AGR%, CAGR%)
Table 39. Global CNS Therapeutics Market Forecast by Mental Health, 2021-2031 (US$ bn, AGR%, CAGR%)
Table 44. Global CNS Therapeutics Market Forecast by Degenerative, 2021-2031 (US$ bn, AGR%, CAGR%)
Table 49. Global CNS Therapeutics Market Forecast by Others, 2021-2031 (US$ bn, AGR%, CAGR%)
Table 60. U.S. CNS Therapeutics Market Forecast, 2021-2031 (US$ bn, AGR%, CAGR%)
Table 61. U.S. CNS Therapeutics Revenue Forecast, V Shaped Recovery, 2021-2031 (US$ bn, AGR%, CAGR%)
Table 62. U.S. CNS Therapeutics Revenue Forecast, U Shaped Recovery, 2021-2031 (US$ bn, AGR%, CAGR%)
Table 63. U.S. CNS Therapeutics Revenue Forecast, W Shaped Recovery, 2021-2031 (US$ bn, AGR%, CAGR%)
Table 64. U.S. CNS Therapeutics Revenue Forecast, L Shaped Recovery, 2021-2031 (US$ bn, AGR%, CAGR%)
Table 65. Canada CNS Therapeutics Market Forecast, 2021-2031 (US$ bn, AGR%, CAGR%)
Table 66. Canada CNS Therapeutics Revenue Forecast, V Shaped Recovery, 2021-2031 (US$ bn, AGR%, CAGR%)
Table 67. Canada CNS Therapeutics Revenue Forecast, U Shaped Recovery, 2021-2031 (US$ bn, AGR%, CAGR%)
Table 68. Canada CNS Therapeutics Revenue Forecast, W Shaped Recovery, 2021-2031 (US$ bn, AGR%, CAGR%)
Table 69. Canada CNS Therapeutics Revenue Forecast, L Shaped Recovery, 2021-2031 (US$ bn, AGR%, CAGR%)
Table 73. UK CNS Therapeutics Market Forecast, 2021-2031 (US$ bn, AGR%, CAGR%)
Table 74. UK CNS Therapeutics Revenue Forecast, V Shaped Recovery, 2021-2031 (US$ bn, AGR%, CAGR%)
Table 75. UK CNS Therapeutics Revenue Forecast, U Shaped Recovery, 2021-2031 (US$ bn, AGR%, CAGR%)
Table 76. UK CNS Therapeutics Revenue Forecast, W Shaped Recovery, 2021-2031 (US$ bn, AGR%, CAGR%)
Table 77. UK CNS Therapeutics Revenue Forecast, L Shaped Recovery, 2021-2031 (US$ bn, AGR%, CAGR%)
Table 78. France CNS Therapeutics Market Forecast, 2021-2031 (US$ bn, AGR%, CAGR%)
Table 79. France CNS Therapeutics Revenue Forecast, V Shaped Recovery, 2021-2031 (US$ bn, AGR%, CAGR%)
Table 80. France CNS Therapeutics Revenue Forecast, U Shaped Recovery, 2021-2031 (US$ bn, AGR%, CAGR%)
Table 81. France CNS Therapeutics Revenue Forecast, W Shaped Recovery, 2021-2031 (US$ bn, AGR%, CAGR%)
Table 82. France CNS Therapeutics Revenue Forecast, L Shaped Recovery, 2021-2031 (US$ bn, AGR%, CAGR%)
Table 83. Germany CNS Therapeutics Market Forecast, 2021-2031 (US$ bn, AGR%, CAGR%)
Table 84. Germany CNS Therapeutics Revenue Forecast, V Shaped Recovery, 2021-2031 (US$ bn, AGR%, CAGR%)
Table 85. Germany CNS Therapeutics Revenue Forecast, U Shaped Recovery, 2021-2031 (US$ bn, AGR%, CAGR%)
Table 86. Germany CNS Therapeutics Revenue Forecast, W Shaped Recovery, 2021-2031 (US$ bn, AGR%, CAGR%)
Table 87. Germany CNS Therapeutics Revenue Forecast, L Shaped Recovery, 2021-2031 (US$ bn, AGR%, CAGR%)
Table 88. Italy CNS Therapeutics Market Forecast, 2021-2031 (US$ bn, AGR%, CAGR%)
Table 89. Italy CNS Therapeutics Revenue Forecast, V Shaped Recovery, 2021-2031 (US$ bn, AGR%, CAGR%)
Table 90. Italy CNS Therapeutics Revenue Forecast, U Shaped Recovery, 2021-2031 (US$ bn, AGR%, CAGR%)
Table 91. Italy CNS Therapeutics Revenue Forecast, W Shaped Recovery, 2021-2031 (US$ bn, AGR%, CAGR%)
Table 92. Italy CNS Therapeutics Revenue Forecast, L Shaped Recovery, 2021-2031 (US$ bn, AGR%, CAGR%)
Table 93. Spain CNS Therapeutics Market Forecast, 2021-2031 (US$ bn, AGR%, CAGR%)
Table 94. Spain CNS Therapeutics Revenue Forecast, V Shaped Recovery, 2021-2031 (US$ bn, AGR%, CAGR%)
Table 95. Spain CNS Therapeutics Revenue Forecast, U Shaped Recovery, 2021-2031 (US$ bn, AGR%, CAGR%)
Table 96. Spain CNS Therapeutics Revenue Forecast, W Shaped Recovery, 2021-2031 (US$ bn, AGR%, CAGR%)
Table 97. Spain CNS Therapeutics Revenue Forecast, L Shaped Recovery, 2021-2031 (US$ bn, AGR%, CAGR%)
Table 98. Russia CNS Therapeutics Market Forecast, 2021-2031 (US$ bn, AGR%, CAGR%)
Table 99. Russia CNS Therapeutics Revenue Forecast, V Shaped Recovery, 2021-2031 (US$ bn, AGR%, CAGR%)
Table 100. Russia CNS Therapeutics Revenue Forecast, U Shaped Recovery, 2021-2031 (US$ bn, AGR%, CAGR%)
Table 101. Russia CNS Therapeutics Revenue Forecast, W Shaped Recovery, 2021-2031 (US$ bn, AGR%, CAGR%)
Table 102. Russia CNS Therapeutics Revenue Forecast, L Shaped Recovery, 2021-2031 (US$ bn, AGR%, CAGR%)
Table 103. Denmark CNS Therapeutics Market Forecast, 2021-2031 (US$ bn, AGR%, CAGR%)
Table 104. Denmark CNS Therapeutics Revenue Forecast, V Shaped Recovery, 2021-2031 (US$ bn, AGR%, CAGR%)
Table 105. Denmark CNS Therapeutics Revenue Forecast, U Shaped Recovery, 2021-2031 (US$ bn, AGR%, CAGR%)
Table 106. Denmark CNS Therapeutics Revenue Forecast, W Shaped Recovery, 2021-2031 (US$ bn, AGR%, CAGR%)
Table 107. Denmark CNS Therapeutics Revenue Forecast, L Shaped Recovery, 2021-2031 (US$ bn, AGR%, CAGR%)
Table 108. Netherland CNS Therapeutics Market Forecast, 2021-2031 (US$ bn, AGR%, CAGR%)
Table 109. Netherland CNS Therapeutics Revenue Forecast, V Shaped Recovery, 2021-2031 (US$ bn, AGR%, CAGR%)
Table 110. Netherland CNS Therapeutics Revenue Forecast, U Shaped Recovery, 2021-2031 (US$ bn, AGR%, CAGR%)
Table 111. Netherland CNS Therapeutics Revenue Forecast, W Shaped Recovery, 2021-2031 (US$ bn, AGR%, CAGR%)
Table 112. Netherland CNS Therapeutics Revenue Forecast, L Shaped Recovery, 2021-2031 (US$ bn, AGR%, CAGR%)
Table 113. Rest of Europe CNS Therapeutics Market Forecast, 2021-2031 (US$ bn, AGR%, CAGR%)
Table 114. Rest of Europe CNS Therapeutics Revenue Forecast, V Shaped Recovery, 2021-2031 (US$ bn, AGR%, CAGR%)
Table 115. Rest of Europe CNS Therapeutics Revenue Forecast, U Shaped Recovery, 2021-2031 (US$ bn, AGR%, CAGR%)
Table 116. Rest of Europe CNS Therapeutics Revenue Forecast, W Shaped Recovery, 2021-2031 (US$ bn, AGR%, CAGR%)
Table 117. Rest of Europe CNS Therapeutics Revenue Forecast, L Shaped Recovery, 2021-2031 (US$ bn, AGR%, CAGR%)
Table 121. China CNS Therapeutics Market Forecast, 2021-2031 (US$ bn, AGR%, CAGR%)
Table 122. China CNS Therapeutics Revenue Forecast, V Shaped Recovery, 2021-2031 (US$ bn, AGR%, CAGR%)
Table 123. China CNS Therapeutics Revenue Forecast, U Shaped Recovery, 2021-2031 (US$ bn, AGR%, CAGR%)
Table 124. China CNS Therapeutics Revenue Forecast, W Shaped Recovery, 2021-2031 (US$ bn, AGR%, CAGR%)
Table 125. China CNS Therapeutics Revenue Forecast, L Shaped Recovery, 2021-2031 (US$ bn, AGR%, CAGR%)
Table 126. India CNS Therapeutics Market Forecast, 2021-2031 (US$ bn, AGR%, CAGR%)
Table 127. India CNS Therapeutics Revenue Forecast, V Shaped Recovery, 2021-2031 (US$ bn, AGR%, CAGR%)
Table 128. India CNS Therapeutics Revenue Forecast, U Shaped Recovery, 2021-2031 (US$ bn, AGR%, CAGR%)
Table 129. India CNS Therapeutics Revenue Forecast, W Shaped Recovery, 2021-2031 (US$ bn, AGR%, CAGR%)
Table 130. India CNS Therapeutics Revenue Forecast, L Shaped Recovery, 2021-2031 (US$ bn, AGR%, CAGR%)
Table 131. Japan CNS Therapeutics Market Forecast, 2021-2031 (US$ bn, AGR%, CAGR%)
Table 132. Japan CNS Therapeutics Revenue Forecast, V Shaped Recovery, 2021-2031 (US$ bn, AGR%, CAGR%)
Table 133. Japan CNS Therapeutics Revenue Forecast, U Shaped Recovery, 2021-2031 (US$ bn, AGR%, CAGR%)
Table 134. Japan CNS Therapeutics Revenue Forecast, W Shaped Recovery, 2021-2031 (US$ bn, AGR%, CAGR%)
Table 135. Japan CNS Therapeutics Revenue Forecast, L Shaped Recovery, 2021-2031 (US$ bn, AGR%, CAGR%)
Table 139. Brazil CNS Therapeutics Market Forecast, 2021-2031 (US$ bn, AGR%, CAGR%)
Table 140. Brazil CNS Therapeutics Revenue Forecast, V Shaped Recovery, 2021-2031 (US$ bn, AGR%, CAGR%)
Table 141. Brazil CNS Therapeutics Revenue Forecast, U Shaped Recovery, 2021-2031 (US$ bn, AGR%, CAGR%)
Table 142. Brazil CNS Therapeutics Revenue Forecast, W Shaped Recovery, 2021-2031 (US$ bn, AGR%, CAGR%)
Table 143. Brazil CNS Therapeutics Revenue Forecast, L Shaped Recovery, 2021-2031 (US$ bn, AGR%, CAGR%)
Table 144. Mexico CNS Therapeutics Market Forecast, 2021-2031 (US$ bn, AGR%, CAGR%)
Table 145. Mexico CNS Therapeutics Revenue Forecast, V Shaped Recovery, 2021-2031 (US$ bn, AGR%, CAGR%)
Table 146. Mexico CNS Therapeutics Revenue Forecast, U Shaped Recovery, 2021-2031 (US$ bn, AGR%, CAGR%)
Table 147. Mexico CNS Therapeutics Revenue Forecast, W Shaped Recovery, 2021-2031 (US$ bn, AGR%, CAGR%)
Table 148. Mexico CNS Therapeutics Revenue Forecast, L Shaped Recovery, 2021-2031 (US$ bn, AGR%, CAGR%)
Table 149. Rest of LATAM CNS Therapeutics Market Forecast, 2021-2031 (US$ bn, AGR%, CAGR%)
Table 150. Rest of LATAM CNS Therapeutics Revenue Forecast, V Shaped Recovery, 2021-2031 (US$ bn, AGR%, CAGR%)
Table 151. Rest of LATAM CNS Therapeutics Revenue Forecast, U Shaped Recovery, 2021-2031 (US$ bn, AGR%, CAGR%)
Table 152. Rest of LATAM CNS Therapeutics Revenue Forecast, W Shaped Recovery, 2021-2031 (US$ bn, AGR%, CAGR%)
Table 153. Rest of LATAM CNS Therapeutics Revenue Forecast, L Shaped Recovery, 2021-2031 (US$ bn, AGR%, CAGR%)
Table 157. UAE CNS Therapeutics Market Forecast, 2021-2031 (US$ bn, AGR%, CAGR%)
Table 158. UAE CNS Therapeutics Revenue Forecast, V Shaped Recovery, 2021-2031 (US$ bn, AGR%, CAGR%)
Table 159. UAE CNS Therapeutics Revenue Forecast, U Shaped Recovery, 2021-2031 (US$ bn, AGR%, CAGR%)
Table 160. UAE CNS Therapeutics Revenue Forecast, W Shaped Recovery, 2021-2031 (US$ bn, AGR%, CAGR%)
Table 161. UAE CNS Therapeutics Revenue Forecast, L Shaped Recovery, 2021-2031 (US$ bn, AGR%, CAGR%)
Table 162. South Africa CNS Therapeutics Market Forecast, 2021-2031 (US$ bn, AGR%, CAGR%)
Table 163. South Africa CNS Therapeutics Revenue Forecast, V Shaped Recovery, 2021-2031 (US$ bn, AGR%, CAGR%)
Table 164. South Africa CNS Therapeutics Revenue Forecast, U Shaped Recovery, 2021-2031 (US$ bn, AGR%, CAGR%)
Table 165. South Africa CNS Therapeutics Revenue Forecast, W Shaped Recovery, 2021-2031 (US$ bn, AGR%, CAGR%)
Table 166. South Africa CNS Therapeutics Revenue Forecast, L Shaped Recovery, 2021-2031 (US$ bn, AGR%, CAGR%)
Table 167. Rest of MEA CNS Therapeutics Market Forecast, 2021-2031 (US$ bn, AGR%, CAGR%)
Table 168. Rest of MEA CNS Therapeutics Revenue Forecast, V Shaped Recovery, 2021-2031 (US$ bn, AGR%, CAGR%)
Table 169. Rest of MEA CNS Therapeutics Revenue Forecast, U Shaped Recovery, 2021-2031 (US$ bn, AGR%, CAGR%)
Table 170. Rest of MEA CNS Therapeutics Revenue Forecast, W Shaped Recovery, 2021-2031 (US$ bn, AGR%, CAGR%)
Table 171. Rest of MEA CNS Therapeutics Revenue Forecast, L Shaped Recovery, 2021-2031 (US$ bn, AGR%, CAGR%)
Table 172. Johnson & Johnson Services, Inc. Profile 2020 (CEO, HQ, Founded, No. of Employees, Company Type, Website, Business Segment)
Table 173. Products / Services
Table 174. Total Company Sales 2015-2019 (US$ million, AGR %)
Table 175. Pfizer Inc. Profile 2020 (CEO, HQ, Founded, No. of Employees, Company Type, Website, Business Segment)
Table 176. Products / Services
Table 177. Total Company Sales, 2015-2019 (US$ million, AGR %)
Table 178. Novartis AG Profile 2020 (CEO, HQ, Founded, No. of Employees, Company Type, Website, Business Segment)
Table 179. Products / Services
Table 180. Total Company Sales, 2015-2019 (US$ million, AGR %)
Table 181. GSK Profile 2020 (CEO, HQ, Founded, No. of Employees, Company Type, Website, Business Segment)
Table 182. Products / Services
Table 183. Total Company Sales, 2015-2019 (US$ million, AGR %)
Table 184. Merck KGaA Profile 2020 (CEO, HQ, Founded, No. of Employees, Company Type, Website, Business Segment)
Table 185. Products / Services
Table 186. Total Company Sales, 2015-2019 (US$ million, AGR %)
Table 187. F. Hoffmann-La Roche Ltd. Profile 2020 (CEO, HQ, Founded, No. of Employees, Company Type, Website, Business Segment)
Table 188. Products / Services
Table 189. Total Company Sales, 2015-2019 (US$ million, AGR %)
Table 190. Amgen Inc. Profile 2020 (CEO, HQ, Founded, No. of Employees, Company Type, Website, Business Segment)
Table 191. Products / Services
Table 192. Total Company Sales, 2015-2019 (US$ million, AGR %)
Table 193. AstraZeneca PLC: Key Details, 2020 (CEO, HQ, Founded, No. of Employees, Company Type, Website, Business Segment)
Table 194. Products / Services
Table 195. Company overview
Table 196. Products / Services
Table 197. Mergers & Acquisitions (M&A) Activity
Table 198. Company overview
Table 199. Products / Services
Table 200. Company overview
Table 201. Products / Services
Table 202. Company overview
Table 203. Products / Services
Table 204. Mergers & Acquisitions (M&A) Activity
Table 205. Company overview
Table 206. Products / Services
Table 207. Mergers & Acquisitions (M&A) Activity
Table 208. Company overview
Table 209. Products / Services
Table 210. Company overview
Table 211. Products / Services
Table 212. Company overview
Table 213. Products / Services
Table 214. Mergers & Acquisitions (M&A) Activity
Table 215. Company overview
Table 216. Products / Services
Table 217. Mergers & Acquisitions (M&A) Activity
Table 218. Company overview
Table 219. Products / Services
Table 220. Mergers & Acquisitions (M&A) Activity
List of Figures
Figure 1. Global CNS Therapeutics Revenue Forecast 2020-2031 (US $ billion, AGR%)
Figure 2. Ranking of age-standardized DALY rates for all neurological disorders by region, 2020
Figure 3. CNS Therapeutics Segmentation
Figure 4. Most common neurovascular malformations
Figure 5. Global CNS Therapeutics Revenue Forecast 2020-2031 (US $ billion, AGR%)
Figure 6. Market Drivers/ Restraints/ Opportunities
Figure 7. Global population projections by region, 2015-2025, Million
Figure 8. Global population breakdown, by age group, 2017
Figure 9. 2020 Alzheimer’s drug development pipeline
Figure 10. Mechanisms of action of agents in Phase 3 of the Alzheimer's disease drug development pipeline
Figure 11. Location of sites for Phase 2 and Phase 3 trials in the Alzheimer's disease drug development pipeline
Figure 12. CNS drugs approval snapshot
Figure 13. Porter’s Five Forces
Figure 14. CNS Therapeutics SWOT Analysis
Figure 15. CNS Therapeutics Market by End Users
Figure 16. Global CNS Therapeutics Revenue Forecast 2020-2031 End Users (%)
Figure 17. Global CNS Therapeutics Revenue Forecast 2020-2031 End Users (%)
Figure 18. Global Hospitals Revenue Forecast 2020-2031 (US$ million, AGR %)
Figure 19. Global CNS Therapeutics Market for Hospitals Segment : Revenue Forecast, V Shaped Recovery
Figure 20. Global CNS Therapeutics Market for Hospitals Segment : Revenue Forecast, U Shaped Recovery
Figure 21. Global CNS Therapeutics Market for Hospitals Segment : Revenue Forecast, W Shaped Recovery
Figure 22. Global CNS Therapeutics Market for Hospitals Segment: Revenue Forecast, L Shaped Recovery
Figure 23. Global Home Care Revenue Forecast 2020-2031 (US$ million, AGR %)
Figure 24. Global CNS Therapeutics Market for Home Care Segment : Revenue Forecast, V Shaped Recovery
Figure 25. Global CNS Therapeutics Market for Home Care Segment : Revenue Forecast, U Shaped Recovery
Figure 26. Global CNS Therapeutics Market for Home Care Segment : Revenue Forecast, W Shaped Recovery
Figure 27. Global CNS Therapeutics Market for Hospitals Segment: Revenue Forecast, L Shaped Recovery
Figure 28. Global Others Revenue Forecast 2020-2031 (US$ million, CAGR %)
Figure 29. Global CNS Therapeutics Market for Others Segment : Revenue Forecast, V Shaped Recovery
Figure 30. Global CNS Therapeutics Market for Others Segment : Revenue Forecast, U Shaped Recovery
Figure 31. Global CNS Therapeutics Market for Others Segment : Revenue Forecast, W Shaped Recovery
Figure 32. Global CNS Therapeutics Market for Others Segment: Revenue Forecast, L Shaped Recovery
Figure 33. CNS Therapeutics Market by Disease
Figure 34. Global CNS Therapeutics Revenue Forecast 2020-2031 Disease (%)
Figure 35. Global CNS Therapeutics Revenue Forecast 2020-2031 Disease (%)
Figure 36. Global Neurovascular Disease Revenue Forecast 2020-2031 (US$ million, AGR %)
Figure 37. Global CNS Therapeutics Market for Neurovascular Disease Segment : Revenue Forecast, V Shaped Recovery
Figure 38. Global CNS Therapeutics Market for Neurovascular Disease Segment : Revenue Forecast, U Shaped Recovery
Figure 39. Global CNS Therapeutics Market for Neurovascular Disease Segment : Revenue Forecast, W Shaped Recovery
Figure 40. Global CNS Therapeutics Market for Neurovascular Disease Segment: Revenue Forecast, L Shaped Recovery
Figure 41. Global Trauma Revenue Forecast 2020-2031 (US$ million, AGR %)
Figure 42. Global CNS Therapeutics Market for Trauma Segment : Revenue Forecast, V Shaped Recovery
Figure 43. Global CNS Therapeutics Market for Trauma Segment : Revenue Forecast, U Shaped Recovery
Figure 44. Global CNS Therapeutics Market for Trauma Segment : Revenue Forecast, W Shaped Recovery
Figure 45. Global CNS Therapeutics Market for Trauma Segment: Revenue Forecast, L Shaped Recovery
Figure 46. Global Mental Health Revenue Forecast 2020-2031 (US$ million, AGR %)
Figure 47. Global CNS Therapeutics Market for Mental Health Segment : Revenue Forecast, V Shaped Recovery
Figure 48. Global CNS Therapeutics Market for Mental Health Segment : Revenue Forecast, U Shaped Recovery
Figure 49. Global CNS Therapeutics Market for Mental Health Segment : Revenue Forecast, W Shaped Recovery
Figure 50. Global CNS Therapeutics Market for Mental Health Segment: Revenue Forecast, L Shaped Recovery
Figure 51. Global Degenerative Revenue Forecast 2020-2031 (US$ million, AGR %)
Figure 52. Global CNS Therapeutics Market for Degenerative Segment : Revenue Forecast, V Shaped Recovery
Figure 53. Global CNS Therapeutics Market for Degenerative Segment : Revenue Forecast, U Shaped Recovery
Figure 54. Global CNS Therapeutics Market for Degenerative Segment : Revenue Forecast, W Shaped Recovery
Figure 55. Global CNS Therapeutics Market for Degenerative Segment: Revenue Forecast, L Shaped Recovery
Figure 56. Global Others Revenue Forecast 2020-2031 (US$ million, AGR %)
Figure 57. Global CNS Therapeutics Market for Others Segment : Revenue Forecast, V Shaped Recovery
Figure 58. Global CNS Therapeutics Market for Others Segment : Revenue Forecast, U Shaped Recovery
Figure 59. Global CNS Therapeutics Market for Others Segment : Revenue Forecast, W Shaped Recovery
Figure 60. Global CNS Therapeutics Market for Others Segment: Revenue Forecast, L Shaped Recovery
Figure 61. Global CNS Therapeutics Revenue Forecast 2020-2031 (%)
Figure 62. North America CNS Therapeutics Market Forecast, 2021-2031 (US$ bn, AGR%, CAGR%)
Figure 63. North America CNS Therapeutics Market: Revenue Forecast, V Shaped Recovery
Figure 64. North America CNS Therapeutics Market: Revenue Forecast, U Shaped Recovery
Figure 65. North America CNS Therapeutics Market: Revenue Forecast, W Shaped Recovery
Figure 66. North America CNS Therapeutics Market: Revenue Forecast, L Shaped Recovery
Figure 67. U.S. CNS Therapeutics Market Forecast, 2021-2031 (US$ bn, AGR%)
Figure 68. U.S. CNS Therapeutics Market: Revenue Forecast, V Shaped Recovery, 2021-2031 (US$ bn, AGR%, CAGR%)
Figure 69. U.S. CNS Therapeutics Market: Revenue Forecast, U Shaped Recovery, 2021-2031 (US$ bn, AGR%, CAGR%)
Figure 70. U.S. CNS Therapeutics Market: Revenue Forecast, W Shaped Recovery, 2021-2031 (US$ bn, AGR%, CAGR%)
Figure 71. U.S. CNS Therapeutics Market: Revenue Forecast, L Shaped Recovery, 2021-2031 (US$ bn, AGR%, CAGR%)
Figure 72. Canada CNS Therapeutics Market Forecast, 2021-2031 (US$ bn, AGR%)
Figure 73. Canada CNS Therapeutics Market: Revenue Forecast, V Shaped Recovery, 2021-2031 (US$ bn, AGR%, CAGR%)
Figure 74. Canada CNS Therapeutics Market: Revenue Forecast, U Shaped Recovery, 2021-2031 (US$ bn, AGR%, CAGR%)
Figure 75. Canada CNS Therapeutics Market: Revenue Forecast, W Shaped Recovery, 2021-2031 (US$ bn, AGR%, CAGR%)
Figure 76. Canada CNS Therapeutics Market: Revenue Forecast, L Shaped Recovery, 2021-2031 (US$ bn, AGR%, CAGR%)
Figure 77. Europe CNS Therapeutics Market Forecast, 2021-2031 (US$ bn, AGR%, CAGR%)
Figure 78. Europe CNS Therapeutics Market: Revenue Forecast, V Shaped Recovery
Figure 79. Europe CNS Therapeutics Market: Revenue Forecast, U Shaped Recovery
Figure 80. Europe CNS Therapeutics Market: Revenue Forecast, W Shaped Recovery
Figure 81. Europe CNS Therapeutics Market: Revenue Forecast, L Shaped Recovery
Figure 82. UK CNS Therapeutics Market Forecast, 2021-2031 (US$ bn, AGR%)
Figure 83. UK CNS Therapeutics Market: Revenue Forecast, V Shaped Recovery, 2021-2031 (US$ bn, AGR%, CAGR%)
Figure 84. UK CNS Therapeutics Market: Revenue Forecast, U Shaped Recovery, 2021-2031 (US$ bn, AGR%, CAGR%)
Figure 85. UK CNS Therapeutics Market: Revenue Forecast, W Shaped Recovery, 2021-2031 (US$ bn, AGR%, CAGR%)
Figure 86. UK CNS Therapeutics Market: Revenue Forecast, L Shaped Recovery, 2021-2031 (US$ bn, AGR%, CAGR%)
Figure 87. France CNS Therapeutics Market Forecast, 2021-2031 (US$ bn, AGR%)
Figure 88. France CNS Therapeutics Market: Revenue Forecast, V Shaped Recovery, 2021-2031 (US$ bn, AGR%, CAGR%)
Figure 89. France CNS Therapeutics Market: Revenue Forecast, U Shaped Recovery, 2021-2031 (US$ bn, AGR%, CAGR%)
Figure 90. France CNS Therapeutics Market: Revenue Forecast, W Shaped Recovery, 2021-2031 (US$ bn, AGR%, CAGR%)
Figure 91. France CNS Therapeutics Market: Revenue Forecast, L Shaped Recovery, 2021-2031 (US$ bn, AGR%, CAGR%)
Figure 92. Germany CNS Therapeutics Market Forecast, 2021-2031 (US$ bn, AGR%)
Figure 93. Germany CNS Therapeutics Market: Revenue Forecast, V Shaped Recovery, 2021-2031 (US$ bn, AGR%, CAGR%)
Figure 94. Germany CNS Therapeutics Market: Revenue Forecast, U Shaped Recovery, 2021-2031 (US$ bn, AGR%, CAGR%)
Figure 95. Germany CNS Therapeutics Market: Revenue Forecast, W Shaped Recovery, 2021-2031 (US$ bn, AGR%, CAGR%)
Figure 96. Germany CNS Therapeutics Market: Revenue Forecast, L Shaped Recovery, 2021-2031 (US$ bn, AGR%, CAGR%)
Figure 97. Italy CNS Therapeutics Market Forecast, 2021-2031 (US$ bn, AGR%)
Figure 98. Italy CNS Therapeutics Market: Revenue Forecast, V Shaped Recovery, 2021-2031 (US$ bn, AGR%, CAGR%)
Figure 99. Italy CNS Therapeutics Market: Revenue Forecast, U Shaped Recovery, 2021-2031 (US$ bn, AGR%, CAGR%)
Figure 100. Italy CNS Therapeutics Market: Revenue Forecast, W Shaped Recovery, 2021-2031 (US$ bn, AGR%, CAGR%)
Figure 101. Italy CNS Therapeutics Market: Revenue Forecast, L Shaped Recovery, 2021-2031 (US$ bn, AGR%, CAGR%)
Figure 102. Spain CNS Therapeutics Market Forecast, 2021-2031 (US$ bn, AGR%)
Figure 103. Spain CNS Therapeutics Market: Revenue Forecast, V Shaped Recovery, 2021-2031 (US$ bn, AGR%, CAGR%)
Figure 104. Spain CNS Therapeutics Market: Revenue Forecast, U Shaped Recovery, 2021-2031 (US$ bn, AGR%, CAGR%)
Figure 105. Spain CNS Therapeutics Market: Revenue Forecast, W Shaped Recovery, 2021-2031 (US$ bn, AGR%, CAGR%)
Figure 106. Spain CNS Therapeutics Market: Revenue Forecast, L Shaped Recovery, 2021-2031 (US$ bn, AGR%, CAGR%)
Figure 107. Russia CNS Therapeutics Market Forecast, 2021-2031 (US$ bn, AGR%)
Figure 108. Russia CNS Therapeutics Market: Revenue Forecast, V Shaped Recovery, 2021-2031 (US$ bn, AGR%, CAGR%)
Figure 109. Russia CNS Therapeutics Market: Revenue Forecast, U Shaped Recovery, 2021-2031 (US$ bn, AGR%, CAGR%)
Figure 110. Russia CNS Therapeutics Market: Revenue Forecast, W Shaped Recovery, 2021-2031 (US$ bn, AGR%, CAGR%)
Figure 111. Russia CNS Therapeutics Market: Revenue Forecast, L Shaped Recovery, 2021-2031 (US$ bn, AGR%, CAGR%)
Figure 112. Denmark CNS Therapeutics Market Forecast, 2021-2031 (US$ bn, AGR%)
Figure 113. Denmark CNS Therapeutics Market: Revenue Forecast, V Shaped Recovery, 2021-2031 (US$ bn, AGR%, CAGR%)
Figure 114. Denmark CNS Therapeutics Market: Revenue Forecast, U Shaped Recovery, 2021-2031 (US$ bn, AGR%, CAGR%)
Figure 115. Denmark CNS Therapeutics Market: Revenue Forecast, W Shaped Recovery, 2021-2031 (US$ bn, AGR%, CAGR%)
Figure 116. Denmark CNS Therapeutics Market: Revenue Forecast, L Shaped Recovery, 2021-2031 (US$ bn, AGR%, CAGR%)
Figure 117. Netherland CNS Therapeutics Market Forecast, 2021-2031 (US$ bn, AGR%)
Figure 118. Netherland CNS Therapeutics Market: Revenue Forecast, V Shaped Recovery, 2021-2031 (US$ bn, AGR%, CAGR%)
Figure 119. Netherland CNS Therapeutics Market: Revenue Forecast, U Shaped Recovery, 2021-2031 (US$ bn, AGR%, CAGR%)
Figure 120. Netherland CNS Therapeutics Market: Revenue Forecast, W Shaped Recovery, 2021-2031 (US$ bn, AGR%, CAGR%)
Figure 121. Netherland CNS Therapeutics Market: Revenue Forecast, L Shaped Recovery, 2021-2031 (US$ bn, AGR%, CAGR%)
Figure 122. Rest of Europe CNS Therapeutics Market Forecast, 2021-2031 (US$ bn, AGR%)
Figure 123. Rest of Europe CNS Therapeutics Market: Revenue Forecast, V Shaped Recovery, 2021-2031 (US$ bn, AGR%, CAGR%)
Figure 124. Rest of Europe CNS Therapeutics Market: Revenue Forecast, U Shaped Recovery, 2021-2031 (US$ bn, AGR%, CAGR%)
Figure 125. Rest of Europe CNS Therapeutics Market: Revenue Forecast, W Shaped Recovery, 2021-2031 (US$ bn, AGR%, CAGR%)
Figure 126. Rest of Europe CNS Therapeutics Market: Revenue Forecast, L Shaped Recovery, 2021-2031 (US$ bn, AGR%, CAGR%)
Figure 127. Asia Pacific CNS Therapeutics Market Forecast, 2021-2031 (US$ bn, AGR%, CAGR%)
Figure 128. Asia Pacific CNS Therapeutics Market: Revenue Forecast, V Shaped Recovery
Figure 129. Asia Pacific CNS Therapeutics Market: Revenue Forecast, U Shaped Recovery
Figure 130. Asia Pacific CNS Therapeutics Market: Revenue Forecast, W Shaped Recovery
Figure 131. Asia Pacific CNS Therapeutics Market: Revenue Forecast, L Shaped Recovery
Figure 132. China CNS Therapeutics Market Forecast, 2021-2031 (US$ bn, AGR%)
Figure 133. China CNS Therapeutics Market: Revenue Forecast, V Shaped Recovery, 2021-2031 (US$ bn, AGR%, CAGR%)
Figure 134. China CNS Therapeutics Market: Revenue Forecast, U Shaped Recovery, 2021-2031 (US$ bn, AGR%, CAGR%)
Figure 135. China CNS Therapeutics Market: Revenue Forecast, W Shaped Recovery, 2021-2031 (US$ bn, AGR%, CAGR%)
Figure 136. China CNS Therapeutics Market: Revenue Forecast, L Shaped Recovery, 2021-2031 (US$ bn, AGR%, CAGR%)
Figure 137. India CNS Therapeutics Market Forecast, 2021-2031 (US$ bn, AGR%)
Figure 138. India CNS Therapeutics Market: Revenue Forecast, V Shaped Recovery, 2021-2031 (US$ bn, AGR%, CAGR%)
Figure 139. India CNS Therapeutics Market: Revenue Forecast, U Shaped Recovery, 2021-2031 (US$ bn, AGR%, CAGR%)
Figure 140. India CNS Therapeutics Market: Revenue Forecast, W Shaped Recovery, 2021-2031 (US$ bn, AGR%, CAGR%)
Figure 141. India CNS Therapeutics Market: Revenue Forecast, L Shaped Recovery, 2021-2031 (US$ bn, AGR%, CAGR%)
Figure 142. Japan CNS Therapeutics Market Forecast, 2021-2031 (US$ bn, AGR%)
Figure 143. Japan CNS Therapeutics Market: Revenue Forecast, V Shaped Recovery, 2021-2031 (US$ bn, AGR%, CAGR%)
Figure 144. Japan CNS Therapeutics Market: Revenue Forecast, U Shaped Recovery, 2021-2031 (US$ bn, AGR%, CAGR%)
Figure 145. Japan CNS Therapeutics Market: Revenue Forecast, W Shaped Recovery, 2021-2031 (US$ bn, AGR%, CAGR%)
Figure 146. Japan CNS Therapeutics Market: Revenue Forecast, L Shaped Recovery, 2021-2031 (US$ bn, AGR%, CAGR%)
Figure 147. Latin America CNS Therapeutics Market Forecast, 2021-2031 (US$ bn, AGR%, CAGR%)
Figure 148. Latin America CNS Therapeutics Market: Revenue Forecast, V Shaped Recovery
Figure 149. Latin America CNS Therapeutics Market: Revenue Forecast, U Shaped Recovery
Figure 150. Latin America CNS Therapeutics Market: Revenue Forecast, W Shaped Recovery
Figure 151. Latin America CNS Therapeutics Market: Revenue Forecast, L Shaped Recovery
Figure 152. Brazil CNS Therapeutics Market Forecast, 2021-2031 (US$ bn, AGR%)
Figure 153. Brazil CNS Therapeutics Market: Revenue Forecast, V Shaped Recovery, 2021-2031 (US$ bn, AGR%, CAGR%)
Figure 154. Brazil CNS Therapeutics Market: Revenue Forecast, U Shaped Recovery, 2021-2031 (US$ bn, AGR%, CAGR%)
Figure 155. Brazil CNS Therapeutics Market: Revenue Forecast, W Shaped Recovery, 2021-2031 (US$ bn, AGR%, CAGR%)
Figure 156. Brazil CNS Therapeutics Market: Revenue Forecast, L Shaped Recovery, 2021-2031 (US$ bn, AGR%, CAGR%)
Figure 157. Mexico CNS Therapeutics Market Forecast, 2021-2031 (US$ bn, AGR%)
Figure 158. Mexico CNS Therapeutics Market: Revenue Forecast, V Shaped Recovery, 2021-2031 (US$ bn, AGR%, CAGR%)
Figure 159. Mexico CNS Therapeutics Market: Revenue Forecast, U Shaped Recovery, 2021-2031 (US$ bn, AGR%, CAGR%)
Figure 160. Mexico CNS Therapeutics Market: Revenue Forecast, W Shaped Recovery, 2021-2031 (US$ bn, AGR%, CAGR%)
Figure 161. Mexico CNS Therapeutics Market: Revenue Forecast, L Shaped Recovery, 2021-2031 (US$ bn, AGR%, CAGR%)
Figure 162. Rest of LATAM CNS Therapeutics Market Forecast, 2021-2031 (US$ bn, AGR%)
Figure 163. Rest of LATAM CNS Therapeutics Market: Revenue Forecast, V Shaped Recovery, 2021-2031 (US$ bn, AGR%, CAGR%)
Figure 164. Rest of LATAM CNS Therapeutics Market: Revenue Forecast, U Shaped Recovery, 2021-2031 (US$ bn, AGR%, CAGR%)
Figure 165. Rest of LATAM CNS Therapeutics Market: Revenue Forecast, W Shaped Recovery, 2021-2031 (US$ bn, AGR%, CAGR%)
Figure 166. Rest of LATAM CNS Therapeutics Market: Revenue Forecast, L Shaped Recovery, 2021-2031 (US$ bn, AGR%, CAGR%)
Figure 167. Middle East and Africa CNS Therapeutics Market Forecast, 2021-2031 (US$ bn, AGR%, CAGR%)
Figure 168. Middle East and Africa CNS Therapeutics Market: Revenue Forecast, V Shaped Recovery
Figure 169. Middle East and Africa CNS Therapeutics Market: Revenue Forecast, U Shaped Recovery
Figure 170. Middle East and Africa CNS Therapeutics Market: Revenue Forecast, W Shaped Recovery
Figure 171. Middle East and Africa CNS Therapeutics Market: Revenue Forecast, L Shaped Recovery
Figure 172. UAE CNS Therapeutics Market Forecast, 2021-2031 (US$ bn, AGR%)
Figure 173. UAE CNS Therapeutics Market: Revenue Forecast, V Shaped Recovery, 2021-2031 (US$ bn, AGR%, CAGR%)
Figure 174. UAE CNS Therapeutics Market: Revenue Forecast, U Shaped Recovery, 2021-2031 (US$ bn, AGR%, CAGR%)
Figure 175. UAE CNS Therapeutics Market: Revenue Forecast, W Shaped Recovery, 2021-2031 (US$ bn, AGR%, CAGR%)
Figure 176. UAE CNS Therapeutics Market: Revenue Forecast, L Shaped Recovery, 2021-2031 (US$ bn, AGR%, CAGR%)
Figure 177. South Africa CNS Therapeutics Market Forecast, 2021-2031 (US$ bn, AGR%)
Figure 178. South Africa CNS Therapeutics Market: Revenue Forecast, V Shaped Recovery, 2021-2031 (US$ bn, AGR%, CAGR%)
Figure 179. South Africa CNS Therapeutics Market: Revenue Forecast, U Shaped Recovery, 2021-2031 (US$ bn, AGR%, CAGR%)
Figure 180. South Africa CNS Therapeutics Market: Revenue Forecast, W Shaped Recovery, 2021-2031 (US$ bn, AGR%, CAGR%)
Figure 181. South Africa CNS Therapeutics Market: Revenue Forecast, L Shaped Recovery, 2021-2031 (US$ bn, AGR%, CAGR%)
Figure 182. Rest of MEA CNS Therapeutics Market Forecast, 2021-2031 (US$ bn, AGR%)
Figure 183. Rest of MEA CNS Therapeutics Market: Revenue Forecast, V Shaped Recovery, 2021-2031 (US$ bn, AGR%, CAGR%)
Figure 184. Rest of MEA CNS Therapeutics Market: Revenue Forecast, U Shaped Recovery, 2021-2031 (US$ bn, AGR%, CAGR%)
Figure 185. Rest of MEA CNS Therapeutics Market: Revenue Forecast, W Shaped Recovery, 2021-2031 (US$ bn, AGR%, CAGR%)
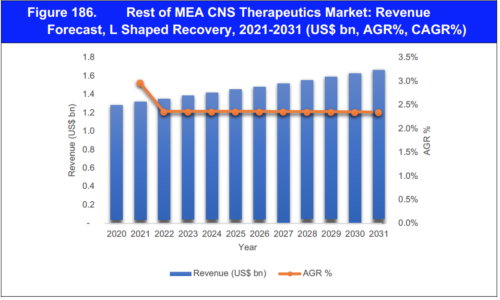
Figure 186. Rest of MEA CNS Therapeutics Market: Revenue Forecast, L Shaped Recovery, 2021-2031 (US$ bn, AGR%, CAGR%)
Figure 187. Total Company Sales (US$ million, AGR %)
Figure 188. Total Company Sales, 2015-2019 (US$ million, AGR %)
Figure 189. Total Company Sales 2015-2018 (US$ million, AGR %)
Figure 190. Total Company Sales, 2015-2019 (US$ million, AGR %)
Figure 191. Total Company Sales, 2015-2019 (US$ million, AGR %)
Figure 192. Total Company Sales, 2015-2019 (US$ million, AGR %)
Figure 193. Total Company Sales, 2015-2019 (US$ million, AGR %)
Figure 194. Total Company Sales, 2015-2019 (US$ Mn, AGR%)
Figure 195. Total Company Sales 2016 – 2019
Figure 196. Total Company Sales 2016 – 2019
Figure 197. Total Company Sales 2016 – 2019
Figure 198. Total Company Sales 2016 – 2019
Figure 199. Total Company Sales 2016 – 2018
Figure 200. Total Company Sales 2016 – 2019
Figure 201. Total Company Sales 2016 – 2019
Figure 202. Total Company Sales 2016 – 2019
Figure 203. Global CNS Therapeutics market, 2020-2031
Figure 204. Global CNS Therapeutics Market: Revenue Forecast, V Shaped Recovery
Figure 205. Global CNS Therapeutics Market: Revenue Forecast, U Shaped Recovery
Figure 206. Global CNS Therapeutics Market: Revenue Forecast, W Shaped Recovery
Figure 207. Global CNS Therapeutics Market: Revenue Forecast, L Shaped Recovery
Figure 208. Global CNS Therapeutics Revenue Forecast 2020-2031 Disease (%)
Figure 209. Global CNS Therapeutics Revenue Forecast 2020-2031 End Use (%)
Companies Profiled in the Report
AB Science
Amgen Inc.
Amylyx Pharmaceuticals
AstraZeneca PLC
Biogen Inc
BrainStorm Therapeutics
Corestem
F. Hoffmann-La Roche Ltd.
GSK
Ionis Pharmaceuticals, Inc
Johnson & Johnson Services, Inc.
Merck KGaA
Mitsubishi Tanabe Pharma Corporation
Novartis AG
Otsuka Pharmaceutical Co., Ltd
Pfizer Inc.
Sun Pharmaceutical
List of Other Companies in the Global CNS Therapeutics Market
AcelRx Pharmaceuticals
Centurion Laboratories Private Limited
Drawbridge Pharmaceuticals
Linux Laboratories
Neuraxpharm
Noveome
PsychoGenics
Sanjar Pharma LLP
SOM Biotech
Supernus Pharmaceuticals, Inc.
Tonix
Vardhaman Healthcare
List of Organizations
Alzheimer's Association
Alzheimer’s Disease International
Banner Alzheimer's Institute
European Parkinson’s Disease Association
International Association for the Study of Pain
International Bureau for Epilepsy
International Headache Society
International League Against Epilepsy
Multiple Sclerosis International Federation
World Federation of Neurology
World Federation of Neurosurgical Societies
World Headache Alliance
World Health Organization