1. Report Overview
1.1 Global Chemical EOR Market Overview
1.2 Global Chemical EOR Market Segmentation
1.3 Why You Should Read This Report
1.4 How This Report Delivers
1.5 Key Questions Answered by This Analytical Report Include:
1.6 Who is This Report For?
1.7 Chemical EOR Market Definition
1.8 Methodology
1.9 Frequently Asked Questions (FAQ)
1.10 Associated Visiongain Reports
1.11 About Visiongain
2. Introduction to the Chemical Enhanced Oil Recovery (EOR) Market
2.1 How is the Enhanced Oil Recovery (EOR) Market Structured?
2.1.1 Primary Recovery
2.1.2 Secondary Recovery
2.1.3 Tertiary Recovery
2.2 Chemical EOR Processes
2.2.1 Polymer Flooding
2.2.2 Surfactant Flooding
2.2.3 Alkaline Flooding
2.2.4 Micellar Flooding
2.3 Major Chemicals Used in EOR Projects
2.4 Major Themes Impacting the Chemical EOR Market
3. Impact of Oil Price Crash and Oil Price Movements on the Chemical EOR Market
3.1 Visiongain’s Oil Price Forecast and Analysis
3.1.1 Supply-Side Factors
3.1.2 Demand-Side Factors
3.1.3 Other Major Variables that Impact the Oil Price
3.1.4 Visiongain’s Oil Price Assumptions and Forecast
3.2 How the Oil Price Will Impact the Chemical EOR Market
4. Global Chemical EOR Market Forecast 2017-2027
4.1 What are the Drivers and Restraints of the Global Chemical EOR Market?
4.1.1 Major Chemical EOR Drivers
4.1.2 Major Chemical EOR Restraints
5. Chemical EOR Technology Forecast 2017-2027
5.1 Global Chemical EOR Technology Production Forecast 2017-2027
5.2 Global Chemical EOR Technology Market Analysis
5.2.1 The Characteristics Governing Chemical EOR Projects
5.2.2 The Current Status of EOR Projects Globally
5.3 Global Alkali Surfactant Polymer Flooding (ASP) Production Forecast 2017-2027
5.4 Global Alkali Surfactant Polymer Flooding (ASP) Market Analysis
5.5 Global Polymer Flooding Production Forecast 2017-2027
5.6 Global Polymer Flooding Market Analysis
5.7 Global Surfactant EOR Production Forecast 2017-2027
5.8 Global Surfactant EOR Market Analysis
5.9 Global Biopolymer Flooding Production Forecast 2017-2027
5.10 Global Biopolymer Flooding Market Analysis
5.11 Global Polymer/ASP Production Flooding Forecast 2017-2027
5.12 Global Polymer/ASP Flooding Market Analysis
5.13 Global Polymer/Surfactant Flooding Production Forecast 2017-2027
5.14 Global Polymer/Surfactant Flooding Market Analysis
6. Leading National Chemical EOR Markets 2017-2027
6.1 The Leading National Chemical EOR Markets 2017-2027
6.2 The Chinese Chemical EOR Production and Market Forecast 2017-2027
6.2.1 The Chinese Chemical EOR Production Forecast 2016-2026
6.2.2 The Chinese Chemical EOR Spending Market Forecast 2017-2027
6.2.3 The Chinese Chemical EOR Market Analysis
6.2.4 The Drivers and Restraints Impacting the Chinese Market
6.2.5 The Outlook for China: Will Its Dominance Continue?
6.3 The Canadian Chemical EOR Production and Market Forecast 2017-2027
6.3.1 The Canadian Chemical EOR Production Forecast 2017-2027
6.3.2 The Canadian Chemical EOR Spending Market Forecast 2017-2027
6.3.3 The Canadian Chemical EOR Market Analysis
6.3.4 What is Driving and Restraining the Canadian Chemical EOR Market?
6.3.5 Future Prospects for Chemical EOR in Canada
6.4 The Russian Chemical EOR Production and Market Forecast 2017-2027
6.4.1 The Russian Chemical EOR Production Forecast 2017-2027
6.4.2 The Russian Chemical EOR Spending Market Forecast 2017-2027
6.4.3 The Russian Chemical EOR Market Analysis
6.4.4 Drivers and Restraints in the Russian Chemical EOR Market
6.5 The Omani Chemical EOR Production and Market Forecast 2017-2027
6.5.1 The Omani Chemical EOR Production Forecast 2017-2027
6.5.2 The Omani Chemical EOR Spending Market Forecast 2017-2027
6.5.3 The Omani Chemical EOR Market Analysis
6.5.4 The Drivers and Restraints Impacting the Omani Chemical EOR Market
6.5.5 What is the Overall Outlook for Oman?
6.6 The Rest of the Middle East Chemical EOR Production and Market Forecast 2017-2027
6.6.1 The Rest of the Middle East Chemical EOR Production Forecast 2017-2027
6.6.2 The Rest of the Middle East Chemical EOR Spending Market Forecast 2017-2027
6.6.3 The Rest of the Middle East Chemical EOR Market Analysis
6.7 The Indonesian Chemical EOR Production and Market Forecast 2017-2027
6.7.1 The Indonesian Chemical EOR Production Forecast 2017-2027
6.7.2 The Indonesian Chemical EOR Spending Market Forecast 2017-2027
6.7.3 The Indonesian Chemical EOR Market Analysis
6.7.4 Drivers and Restraints for the Indonesian Chemical EOR Market
6.8 The Venezuelan Chemical EOR Production and Market Forecast 2017-2027
6.8.1 The Venezuelan Chemical EOR Production Forecast 2017-2027
6.8.2 The Venezuelan Chemical EOR Spending Market Forecast 2017-2027
6.8.3 The Venezuelan Chemical EOR Market Analysis
6.8.4 The Drivers and Restraints in the Venezuelan Chemical EOR Market
6.8.5 What is the Outlook for Venezuela?
6.9 The Colombian Chemical EOR Production and Market Forecast 2017-2027
6.9.1 The Colombian Chemical EOR Production Forecast 2017-2027
6.9.2 The Colombian Chemical EOR Spending Market Forecast 2016-2026
6.9.3 The Colombian Chemical EOR Market Analysis
6.9.4 The Drivers and Restraints Impacting the Colombian Market
6.10 The Rest of Latin American Chemical EOR Production and Market Forecast 2017-2027
6.10.1 The Rest of Latin America Chemical EOR Production Forecast 2017-2027
6.10.2 The Rest of Latin America EOR Spending Market Forecast 2017-2027
6.10.3 The Rest of Latin America Chemical EOR Market Analysis
6.11 The United States Chemical EOR Production and Market Forecast 2017-2027
6.11.1 The United States Chemical EOR Production Forecast 2016-2026
6.11.2 The United States EOR Spending Market Forecast 2017-2027
6.11.3 The United States Chemical EOR Market Analysis
6.11.4 The Drivers and Restraints Impacting the US Chemical EOR Market
6.11.5 The Outlook for the US: Experience from Pilot Projects
6.12 The Indian Chemical EOR Production and Market Forecast 2017-2027
6.12.1 The Indian Chemical EOR Production Forecast 2017-2027
6.12.2 The Indian EOR Spending Market Forecast 2017-2027
6.12.3 The Indian Chemical EOR Market Analysis
6.12.4 What are the Major Drivers and Restraints in the Indian Chemical EOR Market?
6.12.5 Indian Chemical EOR Market Outlook: Future Projects and Opportunities
6.13 The Mexican Chemical EOR Production and Market Forecast 2017-2027
6.13.1 The Mexican Chemical EOR Production Forecast 2017-2027
6.13.2 The Mexican EOR Spending Market Forecast 2017-2027
6.13.3 The Mexican Chemical EOR Market Analysis
6.13.4 The Drivers and Restraints in the Mexican Chemical EOR Market
6.13.5 What is the Outlook for Mexico?
6.14 The North Sea Chemical EOR Production and Market Forecast 2017-2027
6.14.1 The North Sea Chemical EOR Production Forecast 2017-2027
6.14.2 The North Sea EOR Spending Market Forecast 2017-2027
6.14.3 The North Sea Chemical EOR Market
6.14.4 The Drivers and Restraints for the North Sea Chemical EOR Market
6.14.5 Is Chemical EOR Likely to be the Chosen Technology Going Forward?
6.15 The Malaysian Chemical EOR Production and Market Forecast 2017-2027
6.15.1 The Malaysian Chemical EOR Production Forecast 2017-2027
6.15.2 The Malaysian EOR Spending Market Forecast 2016-2026
6.15.3 The Malaysian Chemical EOR Market
6.15.4 Drivers and Restraints for the Malaysian Chemical EOR Market
6.15.5 The Outlook for Chemical EOR in Malaysia
7. Emerging Technologies and Future Trends
7.1 Biopolymers
7.2 Hybrid Chemical Formulas
7.3 Nanoplate Surfactants
7.4 Microbial EOR
7.5 The Outlook for Emerging Technologies
8. PEST Analysis of the Chemical EOR Market 2016-2026
9. Expert Opinion
9.1. Kemira
9.1.1 Introduction
9.1.2 Effects of The Oil Price Collapse
9.1.3 Future Role of Emerging Chemical EOR Projects
9.1.4 Offshore Chemical EOR Developments
9.1.5 What Are Other Important Drivers and Restraints in The Market?
10. Major Companies in the Chemical EOR Market 2016-2026
10.1 Major Oil Companies in the Chemical EOR Market
10.1.1 BlackPearl Resources Inc.
10.1.2 Cenovus Energy Inc.
10.1.3 PetroChina (CNPC)
10.1.4 China National Offshore Oil Corporation (CNOOC) Ltd.
10.1.5 Canadian Natural Resources (CNRL)
10.1.6 Murphy Oil Corporation
10.1.7 Petroleum Development Oman (PDO)
10.1.8 Rex Energy
10.1.9 Sinopec Corp (China Petroleum & Chemical Corporation)
10.1.10 Zargon Oil and Gas
10.2 Chemical Companies – Providers and Developers
10.2.1 BASF
10.2.2 Huntsman
10.2.3 Kemira
10.2.4 Sasol
10.2.5 Shandong Polymer
10.2.6 SNF Group
10.2.7 Solvay
10.2.8 Surtek
10.2.9 Tiorco
11. Conclusions & Recommendations
11.1 Chemical EOR Market Outlook
11.2 Key Findings in the Chemical EOR Market
11.3 Recommendations for the Chemical EOR Market
12. Glossary
Associated Visiongain Reports
Visiongain Report Sales Order Form
Appendix A
Appendix B
List of Tables
Table 1.1 Leading National Chemical EOR Market Forecast 2017-2027
Table 3.1 Visiongain’s Anticipated Brent Crude Oil Price, 2015, 2016, 2017, 2018-2021, 2022-2026 ($/bbl)
Table 4.1 Global Chemical EOR Production Forecast, 2017-2027 (bbl/d, AGR %, CAGR%, Cumulative)
Table 4.2 Global Chemical EOR Spending Market Forecast, 2017-2027 ($m, AGR %, CAGR%, Cumulative)
Table 4.3 Drivers and Restraints in the Global Chemical EOR Market
Table 5.1 Chemical EOR Production Forecasts by Technology 2017-2027 (bbl/day, AGR %, Cumulative)
Table 5.2 Global ASP EOR Production Forecast, 2017-2027 (bbl/d, AGR %, CAGR%, Cumulative)
Table 5.3 Global Polymer Flooding EOR Production Forecast, 2017-2027 (bbl/d, AGR %, CAGR%, Cumulative)
Table 5.4 Global Surfactant EOR Production Forecast, 2017-2027 (bbl/d, AGR %, CAGR%, Cumulative)
Table 5.5 Global Biopolymer EOR Production Forecast, 2017-2027 (bbl/d, AGR %, CAGR%, Cumulative)
Table 5.6 Global Polymer/ASP EOR Production Forecast, 2017-2027 (bbl/d, AGR %, CAGR%, Cumulative)
Table 6.1 Leading National Chemical EOR Production Forecasts 2017-2027 ($ m)
Table 6.2 Leading National Chemical EOR Production Forecasts 2017-2027 (bbl/day)
Table 6.3 The Chinese Chemical EOR Production Forecast, 2017-2027 (bbl/d, AGR %, CAGR%, Cumulative)
Table 6.4 The Chinese Chemical EOR Spending Market Forecast, 2017-2027 ($m, AGR %, CAGR%, Cumulative)
Table 6.5 Oil, Population and Economic Growth Statistics for China (‘000 bbl/d, bn, AGR %)
Table 6.6 Drivers and Restraints in the Chinese Chemical EOR Market
Table 6.7 The Canadian Chemical EOR Production Forecast, 2017-2027 (bbl/d, AGR %, CAGR%, Cumulative)
Table 6.8 The Canadian Chemical EOR Spending Market Forecast, 2017-2027 ($m, AGR %, CAGR%, Cumulative)
Table 6.9 Characteristics of the Pelican Lake Field, Canada (Field Name, Location, Geology, Oil Characteristics, Other Characteristics
Table 6.10 Major ASP Projects in Canada
Table 6.11 Drivers and Restraints in the Canadian Chemical EOR Market
Table 6.12 The Russian Chemical EOR Production Forecast, 2017-2027 (bbl/d, AGR %, CAGR%, Cumulative)
Table 6.13 The Russian Chemical EOR Spending Market Forecast, 2016-2026 ($m, AGR %, CAGR%, Cumulative)
Table 6.14 Drivers and Restraints in the Russian Chemical EOR Market
Table 6.15 The Omani Chemical EOR Production Forecast, 2017-2027 (bbl/d, AGR %, CAGR%, Cumulative)
Table 6.16 The Omani Chemical EOR Spending Market Forecast, 2017-2027 ($m, AGR %, CAGR%, Cumulative)
Table 6.17 Major Characteristics of the Marmul Field (Field, Operator, Location, Lithology, Oil Type, Discovery Date)
Table 6.18 Drivers and Restraints in the Oman Chemical EOR Market
Table 6.19 Omani Oil Consumption 1990-2013 (Year, bbl/d, % Change)
Table 6.20 The Rest of the Middle East Chemical EOR Production Forecast, 2017-2027 (bbl/d, AGR %, CAGR%, Cumulative)
Table 6.21 The Rest of the Middle East Chemical EOR Spending Market Forecast, 2017-2027 ($m, AGR %, CAGR%, Cumulative)
Table 6.22 The Indonesian Chemical EOR Production Forecast, 2017-2027 (bbl/d, AGR %, CAGR%, Cumulative)
Table 6.23 The Indonesian Chemical EOR Spending Market Forecast, 2017-2027 ($m, AGR %, CAGR%, Cumulative)
Table 6.24 Drivers and Restraints in the Indonesian Chemical EOR Market
Table 6.25 The Venezuelan Chemical EOR Production Forecast, 2017-2027 (bbl/d, AGR %, CAGR%, Cumulative)
Table 6.26 The Venezuelan Chemical EOR Spending Market Forecast, 2017-2027 ($m, AGR %, CAGR%, Cumulative)
Table 6.27 Characteristics of the Petrocedeño Chemical EOR Pilot Project
Table 6.28 Drivers and Restraints in the Venezuelan Chemical EOR Market
Table 6.29 The Colombian Chemical EOR Production Forecast, 2017-2027 (bbl/d, AGR %, CAGR%, Cumulative)
Table 6.30 The Colombian Chemical EOR Spending Market Forecast, 2017-2027 ($m, AGR %, CAGR%, Cumulative)
Table 6.31 Drivers and Restraints in the Colombian Chemical EOR Market
Table 6.32 The Rest of Latin America Chemical EOR Production Forecast, 2017-2027 (bbl/d, AGR %)
Table 6.33 The Rest of Latin America Chemical EOR Spending Market Forecast, 2017-2027 ($m, AGR %, CAGR%, Cumulative)
Table 6.34 Chemical EOR Pilot Projects in Argentina (Field, Type, Details, Project Dates)
Table 6.35 Drivers and Restraints in the Argentine Chemical EOR Market
Table 6.36 The US Chemical EOR Production Forecast, 2017-2027 (bbl/d, AGR %, CAGR%, Cumulative)
Table 6.37 The US Chemical EOR Spending Market Forecast, 2017-2027 ($m, AGR %, CAGR%, Cumulative)
Table 6.38 Drivers and Restraints in the US Chemical EOR Market
Table 6.39 Part-Funded Chemical EOR Projects in the US
Table 6.40 The Indian Chemical EOR Market Forecast, 2017-2027 (bbl/d, AGR %, CAGR%, Cumulative)
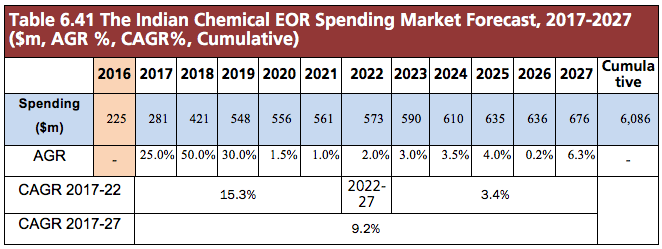
Table 6.41 The Indian Chemical EOR Spending Market Forecast, 2017-2027 ($m, AGR %, CAGR%, Cumulative)
Table 6.42 Project Characteristics for the Mangala Chemical EOR Project
Table 6.43 Drivers and Restraints in the Indian Chemical EOR Market
Table 6.44 The Mexican Chemical EOR Production Forecast, 2017-2027 (bbl/d, AGR %, CAGR%, Cumulative)
Table 6.45 The Mexican Chemical EOR Spending Market Forecast, 2017-2027 ($m, AGR %, CAGR%, Cumulative)
Table 6.46 Drivers and Restraints in the Mexican Chemical EOR Market
Table 6.47 PEMEX’s Upcoming Pilot Chemical EOR Projects
Table 6.48 The North Sea Chemical EOR Production Forecast, 2017-2027 (bbl/d, AGR %, CAGR%, Cumulative)
Table 6.49 The North Sea Chemical EOR Spending Market Forecast, 2017-2027 ($m, AGR %, CAGR%, Cumulative)
Table 6.50 Drivers and Restraints in the North Sea Chemical EOR Market
Table 6.51 The Malaysian Chemical EOR Production Forecast, 2017-2027 (bbl/d, AGR %, CAGR%, Cumulative)
Table 6.52 The Malaysian Chemical EOR Spending Market Forecast, 2017-2027 ($m, AGR %, CAGR%, Cumulative)
Table 6.53 Drivers and Restraints in the Malaysian Chemical EOR Market
Table 8.1 PEST Analysis of the Chemical EOR Market 2016-2026
Table 10.1 Leading Companies in Global Chemical EOR, 2016 Production Forecast, 2016 Production Share (bbl/d, %)
Table 10.2 BlackPearl Resources Overview: Total Daily Production, 2016 Chemical EOR Production Forecast, Oil and Gas Sales 2015, 2015 Chemical EOR Global Production Share, 2015 Chemical EOR Global Production Rank, Headquarters, Ticker, Employees, Website (bbl/d, $m, %)
Table 10.3 Cenovus Overview: Total Daily Production 20145, Revenue 2015, 2016 Global Production Share, 2016 Chemical EOR Production Forecast, 2016 Global Production Rank, Headquarters, Ticker, Employees, Website (bbl/d, $m, %)
Table 10.4 PetroChina (CNPC) Overview: Total Oil Production 2014, Total Operating Income 2014, 2016 Chemical EOR Production Forecast, 2016 Global Chemical EOR Production Share, 2016 Global Production Share, 2016 Production Rank, Headquarters, Employees, Ticker, Website (bbl/d, $m, %)
Table 10.5 CNOOC Overview: Total Daily Production 2014, Sales 2014, 2016 Chemical EOR Production Forecast, 2016 Global Chemical EOR Production Share, 2016 Chemical EOR Production Rank, Headquarters, Employees, Website (bbl/d, $m, %)
Table 10.6 CNRL Overview: Total Daily Production (2014, Total Sales (2014), 2015 Chemical EOR Production Forecast, 2015 Global Chemical EOR Production Share, 2015 Chemical EOR Production Rank, Headquarters, Employees, Ticker, Website (bbl/d, $m, %)
Table 10.7 Murphy Oil Overview: Total Daily Production 2015, Total Revenue 2014, 2016 Chemical EOR Production Forecast, 2016 Global Chemical EOR Production Share, 2016 Chemical EOR Production Rank, Headquarters, Employees, Ticker, Website (bbl/d, $m, %)
Table 10.8 PDO Overview: Total Daily Production 2014, 2015 Chemical EOR Production Forecast, 2016 Global Chemical EOR Production Share, 2016 Global Chemical EOR Production Rank, Headquarters, Employees, Website (bbl/d, $m, %)
Table 10.9 Rex Energy Overview: Total Daily Production 2014, Revenue 2014, 2016 Chemical EOR Production Forecast, 2016 Global Chemical EOR Production Share, 2016 Chemical EOR Production Rank, Headquarters, Employees, Ticker, Website (bbl/d, $m, %)
Table 10.10 Sinopec Overview: Total Oil Production 2014, Operating Income 2014, 2015 Chemical EOR Production Forecast, 2015 Global Chemical EOR Production Share, 2015 Global Chemical EOR Production Rank, Headquarters, Employees, Ticker, Website (bbl/d, $m, %)
Table 10.11 Sinopec Chemical EOR Projects (Field, Type, Project Start Date)
Table 10.12 Zargon Oil and Gas Overview: Total Daily Production 2015, Revenue 2015, 2016 Chemical EOR Production Forecast, 2015 Global Chemical EOR Production Share, 2015 Market Rank, Headquarters, Employees, Ticker, Website)
List of Figures
Figure 1.1 Global Oil Consumption 1980-2014 (‘000 bbl/d)
Figure 1.2 Global Chemical EOR Market Segmentation Overview
Figure 1.3 Global Chemical EOR National Market Breakdown
Figure 1.4 Barriers to Entry Analysis 2017 (Market Size vs. AGR%)
Figure 2.1 Enhanced Oil Recovery by Segment
Figure 2.2 Main Properties for Chemical EOR
Figure 2.3 Major Chemicals Used in Enhanced Oil Recovery
Figure 2.4 Major Trends Affecting the Chemical EOR Market
Figure 3.1 WTI and Brent Oil Prices 2003-2014 ($/bbl)
Figure 3.2 Weekly WTI and Brent Oil Prices January 2014 – March 2016 ($/bbl)
Figure 3.3 Chinese and Indian Annual GDP Growth 2005-2014 (%)
Figure 3.4 US Refined Product Consumption January 2014 to December 2015 Four-Week Average (Mbpd)
Figure 3.5 Visiongain’s Anticipated Brent Crude Oil Price, 2015, 2016, 2017, 2018-2021, 2022-2026 ($/bbl)
Figure 3.6 WTI Crude Spot Price and the Number of EOR Projects Implemented Each Year 1980-2015
Figure 3.7 Degree of Oil Price Impact on Leading National Markets 2017-2027
Figure 4.1 Global Chemical EOR Production Forecast, 2017-2027 (bbl/d, AGR%)
Figure 4.2 Global Chemical EOR Spending Market Forecast, 2017-2027 ($m, AGR%)
Figure 4.3 Locations of Known Active Chemical EOR Projects and Pilots 2016
Figure 4.4 Total Spending per National Market, 2027 ($m)
Figure 4.5 National Chemical EOR Market Share by Spend, 2017, 2022, 2027 (%)
Figure 4.6 Factors Influencing the Economic Viability of a Chemical EOR Project
Figure 5.1 Chemical EOR Production Forecasts by Technology 2017-2027 (bbl/d)
Figure 5.2 Chemical EOR Technology Market Shares 2017-2027 (%)
Figure 5.3 Chemical EOR Total Production Forecasts by Technology 2017-2027 (bbl/d)
Figure 5.4 Chemical EOR Total Production Split by Polymer and Non-Polymer Technology 2017-2027 (bbl/d)
Figure 5.5 Global ASP EOR Production Forecast, 2017-2027 (bbl/d, AGR %)
Figure 5.6 The Global ASP Flooding Production Share Forecast 2017, 2022 and 2027 (%)
Figure 5.7 Global Polymer EOR Production Forecast, 2017-2027 (bbl/d, AGR%)
Figure 5.8 The Global Polymer Flooding Production Share Forecast 2017, 2022 and 2027 (%)
Figure 5.9 Global Surfactant EOR Production Forecast, 2017-2027 (bbl/d, AGR%)
Figure 5.10 The Global Surfactant EOR Production Share Forecast 2017, 2022 and 2027 (%)
Figure 5.11 Global Biopolymer EOR Production Forecast, 2017-2027 (bbl/d, AGR%)
Figure 5.12 The Biopolymer Flooding Production Share Forecast 2017, 2022 and 2027 (%)
Figure 5.13 Global Polymer/ASP EOR Production Forecast, 2017-2027 (bbl/d, AGR%)
Figure 5.14 The Global Polymer/ASP Production Share Forecast 2017, 2022 and 2027 (%)
Figure 5.15 Global Polymer/Surfactant EOR Production Forecast, 2017-2027 (bbl/d, AGR%)
Figure 5.16 Global Polymer/Surfactant EOR Production Forecast, 2017-2027 (bbl/d, AGR%)
Figure 5.17 The Global Polymer/Surfactant Flooding Production Share Forecast 2017, 2022 and 2027 (%)
Figure 6.1 Leading National Chemical EOR Production Forecasts 2017-2027 (bbl/d)
Figure 6.2 Leading National Chemical EOR Production Forecasts 2017-2027 Excluding China (bbl/d)
Figure 6.3 Leading National Chemical EOR Spending Market Forecasts 2017-2027 ($m)
Figure 6.4 Leading National Chemical EOR Production and Market Share Forecast 2017 (%)
Figure 6.5 Leading National Chemical EOR Production and Market Share Forecast 2022 (%)
Figure 6.6 Leading National Chemical EOR Production and Market Share Forecast 2027 (%)
Figure 6.7 Barriers to Entry vs. Regional Market Size vs. CAGR 2017-2027 ($m, CAGR%)
Figure 6.8 The Chinese Chemical EOR Production Forecast, 2017-2027 (bbl/d, AGR %)
Figure 6.9 The Chinese Chemical EOR Production Share Forecast 2017, 2022 and 2027 (%)
Figure 6.10 The Chinese Chemical EOR Spending Market Forecast, 2017-2027 ($m, AGR %)
Figure 6.11 The Chinese Chemical EOR Spending Market Share Forecast, 2017, 2022 and 2027 (%)
Figure 6.12 Major Chemical EOR Projects in China
Figure 6.13 Chemical EOR Developments within the Daqing Field, China 1970-2007
Figure 6.14 Chinese Chemical EOR Project Breakdown
Figure 6.15 The Canadian Chemical EOR Production Forecast, 2017-2027 (bbl/d, AGR %)
Figure 6.16 The Canadian Chemical EOR Production Share Forecast 2017, 2022 and 2027 (%)
Figure 6.17 The Canadian Chemical EOR Spending Market Forecast, 2017-2027 ($m, AGR %)
Figure 6.18 The Canadian Chemical EOR Spending Market Share Forecast, 2017, 2022 and 2027 (%)
Figure 6.19 Total Oil Production (bbl/d) in Canada by Year 1980-2014 (‘000 bbl/d)
Figure 6.20 Top 10 Oil Producers Globally 2016 (‘000 bbl/d)
Figure 6.21 Timeline of Developments in the Pelican Lake Field, Canada 1970-2005
Figure 6.23 The Russian Chemical EOR Production Forecast, 2017-2027 (bbl/d, AGR %)
Figure 6.24 The Russian Chemical EOR Production Share Forecast 2017, 2022 and 2027 (%)
Figure 6.25 The Russian Chemical EOR Spending Market Forecast, 2016-2026 ($m, AGR %)
Figure 6.26 The Russian Chemical EOR Spending Market Share Forecast, 2016, 2021 and 2026 (%)
Figure 6.27 The Omani Chemical EOR Production Forecast, 2017-2027 (bbl/d, AGR %)
Figure 6.28 The Omani Chemical EOR Production Share Forecast, 2017, 2022 and 2027 (%)
Figure 6.29 The Omani Chemical EOR Spending Market Forecast, 2017-2027 ($m, AGR %)
Figure 6.30 The Omani Chemical EOR Spending Market Share Forecast, 2017, 2022 and 2027 (%)
Figure 6.31 Estimated Oil Recovery Before and After Polymer Flooding (%)
Figure 6.32 The Rest of the Middle East Chemical EOR Production Forecast, 2017-2027 (bbl/d, AGR %)
Figure 6.21 The Rest of the Middle East Chemical EOR Production Share Forecast, 2017, 2022 and 2027 (%)
Figure 6.33 The Rest of the Middle East Chemical EOR Spending Market Forecast, 2017-2027 ($m, AGR %)
Figure 6.34 The Rest of the Middle East Chemical EOR Spending Market Share Forecast, 2017, 2022 and 2027 (%)
Figure 6.35 The Indonesian Chemical EOR Production Forecast, 2017-2027 (bbl/d, AGR %)
Figure 6.36 The Indonesian Chemical EOR Production Share Forecast, 2017, 2022 and 2027 (%)
Figure 6.37 The Indonesian Chemical EOR Spending Market Forecast, 2017-2027 ($m, AGR %)
Figure 6.38 The Indonesian Chemical EOR Spending Market Share Forecast, 2017, 2022 and 2027 (%)
Figure 6.39 Indonesian Oil Production and Proven Reserves 1980-2014 (Thousand bpd, Billion Barrels)
Figure 6.40 The Venezuelan Chemical EOR Production Forecast, 2017-2027 (bbl/d, AGR %)
Figure 6.41 The Venezuelan Chemical EOR Production Share Forecast, 2017, 2022 and 2027 (%)
Figure 6.42 The Venezuelan Chemical EOR Spending Market Forecast, 2017-2027 ($m, AGR %)
Figure 6.43 The Venezuelan Chemical EOR Spending Market Share Forecast, 2017, 2022 and 2027 (%)
Figure 6.44 Total Oil Production and Proved Reserves in Venezuela 1980-2014 1990-2013 (‘000 bbl/d, billion bbl)
Figure 6.45 The Colombian Chemical EOR Production Forecast, 2017-2027 (bbl/d, AGR %)
Figure 6.46 The Colombian Chemical EOR Production Share Forecast, 2017, 2022 and 2027 (%)
Figure 6.47 The Colombian Chemical EOR Spending Market Forecast, 2017-2027 ($m, AGR %)
Figure 6.48 The Colombian Chemical EOR Spending Market Share Forecast, 2017, 2022 and 2027 (%)
Figure 6.49 The Rest of Latin America Chemical EOR Production Forecast, 2017-2027 (bbl/d, AGR %, CAGR%, Cumulative)
Figure 6.50 Rest of Latin America Chemical EOR Production Share Forecast, 2017, 2022 and 2027 (%)
Figure 6.51 The Rest of Latin America Chemical EOR Spending Market Forecast, 2017-2027 ($m, AGR %)
Figure 6.52 Rest of Latin America Chemical EOR Market Share Forecast, 2017, 2022 and 2027 (%)
Figure 6.53 The US Chemical EOR Production Forecast, 2017-2027 (bbl/d, AGR %)
Figure 6.54 The US Chemical EOR Production Share Forecast, 2017, 2022 and 2027 (%)
Figure 6.55 The US Chemical EOR Spending Market Forecast, 2017-2027
Figure 6.56 The US Chemical EOR Spending Market Share Forecast, 2017, 2022 and 2027 (%)
Figure 6.57 Locations of US Chemical Pilot Projects by Type: ASP, Alkaline, AP, AS and SP
Figure 6.58 Department of Energy Funding Allocation, Ultra-Deepwater Vs. Unconventional Resources Vs. Small Producer
Figure 6.59 Onshore and Offshore Crude Oil Production in the US 1981-2015 (Thousand Barrels per Day)
Figure 6.60 The Indian Chemical EOR Production Forecast, 2017-2027 (bbl/d, AGR %)
Figure 6.61 The Indian Chemical EOR Production Share Forecast, 2017, 2022 and 2027 (%)
Figure 6.62 The Indian Chemical EOR Spending Market Forecast, 2017-2027 ($m, AGR %)
Figure 6.63 The Indian Chemical EOR Spending Market Share Forecast, 2017, 2022 and 2027 (%)
Figure 6.64 Total Oil Production in India 1980-2014 (‘000 bbl/d)
Figure 6.65 Oil Production and Consumption in India 1980-2014 (‘000 bbl/d)
Figure 6.66 The Mexican Chemical EOR Production Forecast, 2017-2027 (bbl/d, AGR %)
Figure 6.67 The Mexican Chemical EOR Production Share Forecast, 2017, 2022 and 2027 (%)
Figure 6.68 The Mexican Chemical EOR Spending Market Forecast, 2017-2027 ($m, AGR %)
Figure 6.69 The Mexican Chemical EOR Spending Market Share Forecast, 2017, 2022 and 2027 (%)
Figure 6.70 Crude Oil Production in Mexico 1980-2014 (Thousand bbl/d)
Figure 6.71 The North Sea Chemical EOR Production Forecast, 2017-2027 (bbl/d, AGR %)
Figure 6.72 The North Sea Chemical EOR Production Share Forecast, 2017, 2022 and 2027 (%)
Figure 6.73 The North Sea Chemical EOR Spending Market Forecast, 2017-2027 ($m, AGR %)
Figure 6.74 The North Sea Chemical EOR Spending Market Share Forecast, 2017, 2022 and 2027 (%)
Figure 6.75 UK Offshore and Norwegian Crude Oil Production 1980-2014 (Thousand Barrels/Day)
Figure 6.76 Offshore Development for Chemical EOR – The Benefits and Challenges
Figure 6.77 The Malaysian Chemical EOR Production Forecast, 2017-2027 (bbl/d, AGR %)
Figure 6.78 The Malaysian Chemical EOR Production Share Forecast, 2017, 2022 and 2027 (%)
Figure 6.79 The Malaysian Chemical EOR Spending Market Forecast, 2017-2027 ($m, AGR %)
Figure 6.80 The Malaysian Chemical EOR Spending Market Share Forecast, 2017, 2022 and 2027 (%)
Figure 7.1 SWOT Analysis for Biopolymers
Figure 7.2 SWOT Analysis for Hybrid Approaches to Chemical EOR
Figure 7.3 SWOT Analysis for Nanotechnology Development
Figure10.1 Leading Companies and Research Bodies in the Global Chemical EOR Market (Operators, Chemical Providers and Developers and R&D Institutes)
Figure 10.2 Distribution of BlackPearl Resources’ Capital Expenditure in 2016
Figure 10.3 Cenovus’ EOR Production Split (%) Thermal, Gas and Chemical
Figure 10.4 CNOOC 2014 Crude and Liquid Production by Region
Figure 10.5 CNRL Sales Values 2012, 2013 and 2014 (US $m)
Figure 10.6 Murphy Oil Crude Oil and Liquids Production per Global Region (bbl/d)
Figure 10.7 Rex Energy Production by Region (%)
Figure 10.8 Sinopec’s 2014 Crude Oil Production by Region (million bbl/d)
Figure 10.9 Zargon Oil and Gas Budget by Production Type: Non ASP Vs. ASP (%) in 2016