Canadian Oil & Gas Market – our new study reveals trends, technological advancement, future projects, and predicted revenues
Key questions answered are – What are the current and future projects in the Canadian oil & gas market? What are the technological advancements over the recent years? What are the clean energy projects taken up by companies? Where is the Canadian oil & gas market heading? If you are involved in this sector you must read this newly updated report. Visiongain’s report shows you the potential revenues streams to 2035, assessing data, trends, opportunities and business prospects there.
Discover how to stay ahead
Our 267 page report provides 169 tables and 150 charts/graphs. Read on to discover the most lucrative areas in the industry and the future market prospects. Our new study lets you assess forecasted sales in Canada. See financial results, trends, opportunities, and revenue predictions. Much opportunity remains in this growing Canadian Oil & Gas Market. See how to exploit the opportunities.
Forecasts to 2035 and other analysis reveal the commercial prospects
• In addition to revenue forecasting to 2035, our new study provides you with recent results, growth rates, and market shares.
• You find original analysis, with business outlooks and developments.
• Discover qualitative analysis (including market dynamics, drivers, opportunities, restraints and challenges), current & future projects, and clean energy initiatives.
• Discover sales predictions for the Canadian market and submarkets
This report includes data analysis and invaluable insight into how COVID-19 will affect your industry. Four COVID-19 recovery patterns and their impact, namely, V, L, W, and U are discussed in this report.
To access the data contained in this document please email contactus@visiongain.com
Canadian Oil & Gas: By Energy Sources
• Oil
• Natural Gas
• Liquified Natural Gas
Canadian Oil & Gas: By Operating Segment
• Upstream
• Midstream
• Downstream
• Services
Canadian Oil & Gas: By Method
• Conventional
• Unconventional
The report also includes profiles and for some of the leading companies in the Canadian Oil & Gas Market, with a focus on this segment of these companies’ operations.
Need industry data? Please contact us today.
Leading companies and the potential for market growth
Overall world revenue for Canadian Oil & Gas Market will surpass US$xx billion in 2021, our work calculates. We predict strong revenue growth through to 2035. Our work identifies which organizations hold the greatest potential. Discover their capabilities, progress, and commercial prospects, helping you stay ahead.
How the Canadian Oil & Gas Market report helps you
In summary, our 260+ page report provides you with the following knowledge:
• Revenue forecasts to 2035 for Canadian Oil & Gas Market, with forecasts for Energy Sources, Operating Segment, and Method, each forecasted at a regional level– discover the industry’s prospects, finding the most lucrative places for investments and revenues
• Prospects for established firms and those seeking to enter the market– including company profiles for 17 of the major companies involved in the Canadian Oil & Gas Market. Some of the company’s profiled in this report include Suncor Energy Inc., Imperial Oil Ltd., Canadian Natural Resources Ltd., Cenovus Energy Inc., Husky Energy Inc., TC Energy Corp., Pembina Pipeline Corp., Chevron Canada Ltd., CNOOC International Limited, Repsol Oil & Gas Canada, Inc., Shell Canada Ltd., Syncrude Canada Ltd, MEG Energy, Athabasca Oil Corporation, TE Connectivity Ltd., ConocoPhillips Canada, Enbridge Inc.
Find quantitative and qualitative analysis with independent predictions. Receive information that only our report contains, staying informed with this invaluable business intelligence.
Information found nowhere else
With our newly report title, you are less likely to fall behind in knowledge or miss out on opportunities. See how our work could benefit your research, analysis, and decisions. Visiongain’s study is for everybody needing commercial analysis for the Canadian Oil & Gas Market and leading companies. You will find data, trends and predictions in the report.
To access the data contained in this document please email contactus@visiongain.com
Buy our report today Canadian Oil & Gas Market Report 2021-2035: Forecasts by Energy Sources (Oil, Natural Gas, Liquefied Natural Gas), by Operating Segment (Upstream, Midstream, Downstream, Services), by Method (Conventional, Unconventional). PLUS Profiles of Leading Manufacturing Companies and National Market Analysis. PLUS COVID-19 Recovery Scenarios. Avoid missing out by staying informed – order our report now.
Visiongain is a trading partner with the US Federal Government
CCR Ref number: KD4R6
Do you have any custom requirements we can help you with? Any need for a specific country, geo region, market segment or specific company information? Contact us today, we can discuss your needs and see how we can help: sara.peerun@visiongain.com
1 Report Overview
1.1 Introduction
1.2 Why You Should Read This Report
1.3 What This Report Delivers
1.4 Key Questions Answered By This Analytical Report Include:
1.5 Who is This Report For?
1.6 Methodology
1.6.1 COVID-19 Impact: Recovery Scenarios
1.6.2 Market Evaluation & Forecasting Methodology
1.6.3 Market Size Estimation
1.7 Frequently Asked Questions (FAQs)
1.8 Associated Visiongain Reports
1.9 About Visiongain
2 Introduction to the Canadian Oil & Gas Market
2.1 Canadian Oil & Gas Market Definition
2.2 Energy Sources Submarkets Definitions
2.2.1 Oil
2.2.2 Natural Gas
2.2.3 Liquefied Natural Gas (LNG)
2.3 Operating Segment Submarkets Definitions
2.3.1 Upstream
2.3.2 Midstream
2.3.3 Downstream
2.3.4 Services
2.4 Method Submarkets Definitions
2.4.1 Conventional
2.4.2 Unconventional
2.5 Oil & Gas Prices Analysis and Estimations
2.5.1 Crude Oil Prices
2.5.1.1 Canadian Light Sweet (CLS) Oil Prices, 2010-2029F
2.5.1.2 Western Canadian Select (WCS) Oil Prices, 2010-2029F
2.5.1.3 Forecasted Oil Prices, 2020-2050
2.5.2 Natural Gas Prices
2.5.2.1 Henry Hub Natural Gas Prices, 2010-2029F
2.5.2.2 AECO-C Natural Gas Prices, 2010-2029F
2.6 Canadian Oil & Gas Imports and Exports Analysis
2.6.1 Crude Oil Import & Export Analysis
2.6.2 Natural Gas Import & Export Analysis
3 Canadian Oil & Gas Market Overview
3.1 Canadian Oil & Gas Market Size and Forecast
3.2 Market Dynamics
3.2.1 Market Drivers
3.2.1.1 Unconventional Sources Exploration Maintains Momentum
3.2.1.2 Production Cuts and Regulations as a Market Stabilization Driver
3.2.1.3 Increased Technological Expertise and Higher Efficiency in the Production Chain
3.2.2 Market Restraints/Challenges
3.2.2.1 Debt Financing Weakens as the Number of Oil & Gas Players Declaring Bankruptcy Increases in 2020
3.2.2.2 Economic Growth Declines Globally
3.2.2.3 Period of High Political Risk and Uncertainty at a Global Scale
3.2.3 Opportunities
3.2.3.1 Combination of Oil & Gas with Green Energy Projects Becomes more Attractive, as Renewable Energy Increases Its Competitiveness
3.2.3.2 Shale Projects to Develop with Higher Capital Efficiency
3.2.3.3 CO2 Enhanced Oil Recovery to Increase its Commercial Viability
3.2.3.4 Natural Gas & LNG to Play the Role of Transition Fuels, as Energy Transition Accelerates
3.2.4 Canadian Oil & Gas Market: Trends
3.2.4.1 Energy Transition Gains Momentum as Oil & Gas Market Giants Invest in Green Energy Portfolios
3.2.4.2 Production Drops as Energy Demand Decreases in Covid-19 Era
3.2.4.3 Operations to Be More Efficient in the Long-Term
3.2.4.4 Equity Financing Gains Momentum Within the Uncertainty
3.3 SWOT Analysis
3.3.1 Strengths
3.3.1.1 Large Proven Oil & Gas Reserve
3.3.1.2 Investment & Associations in Clean Energy Initiatives
3.3.2 Weaknesses
3.3.2.1 Heavy Reliance on U.S. Trade
3.3.2.2 Pipeline Network & Capacity Challenges
3.3.3 Opportunities
3.3.3.1 Innovation in the Oil & Gas Industry
3.3.4 Threats
3.3.4.1 Oil Price Volatility
3.4 Porter’s Five Force Analysis
3.4.1 Competitive Rivalry
3.4.2 Bargaining Power of Suppliers
3.4.3 Bargaining Power of Buyers
3.4.4 Threat of Substitute
3.4.5 Threat of New Entrant
3.5 Technological Investments in the Oil & Gas Industry
3.5.1 COSIA Largest Investor in Oil & Gas Sustainable Technology
3.5.2 Steam Additives and Non-Condensable Gas Injection to Reduce GHG Emission
3.5.3 Water Technology Development Centre (WTDC) Develops Technologies to Decrease Water Input
3.5.4 Nano Materials Application to Promote Sustainable Development
3.5.5 Enhanced Oil Recovery Implemented in Several Fields to Boost Well Efficiency
3.5.6 Enhanced Solvent Extraction Incorporating Electromagnetic Heating (ESEIEH) Consortium
3.5.7 O&G Companies Increase Investment in Sustainable Flue Production
4 Canadian Oil & Gas Market Analysis and Forecast 2021-2035, by Energy Source
4.1 Market Overview
4.1.1 Oil
4.1.1.1 Increasing Oil Stocks and Demand Drop
4.1.1.2 COVID Recovery Scenario: V,U,W,L
4.1.2 Natural Gas
4.1.2.1 Canada Produces Less than its Capacity During the Early COVID 19 Phase
4.1.2.2 COVID Recovery Scenario: V,U,W,L
4.1.3 Liquefied Natural Gas (LNG)
4.1.3.1 Cancellation of Deliveries During the Lockdown Period and the Increased Reserves Curb LNG’s Momentum
4.1.3.2 COVID Recovery Scenario: V,U,W,L
5 Canadian Oil & Gas Market Analysis and Forecast 2021-2035, by Operating Segment
5.1 Market Overview
5.1.1 Upstream
5.1.1.1 Expansion Projects Postponement as a Result of COVID 19 Disruptions
5.1.1.2 COVID Recovery Scenario: V,U,W,L
5.1.2 Midstream
5.1.2.1 The Indirect Exposure of Midstream Segment to Oil Price Drop
5.1.2.2 COVID Recovery Scenario: V,U,W,L
5.1.3 Downstream
5.1.3.1 The Short-Term and Long-Term Impacts of Sharp Oil & Gas Production Drops
5.1.3.2 COVID Recovery Scenario: V,U,W,L
5.1.4 Services
5.1.4.1 COVID Recovery Scenario: V,U,W,L
6 Canadian Oil & Gas Market Analysis and Forecast 2021-2035, by Method
6.1 Market Overview
6.1.1 Conventional
6.1.1.1 Conventional Production Retains a Small Share in the Domestic Oil & Gas Market
6.1.1.2 COVID Recovery Scenario: V,U,W,L
6.1.2 Unconventional
6.1.2.1 Oil Sands to Maintain Their Dynamic in the Canadian Market
6.1.2.2 COVID Recovery Scenario: V,U,W,L
7 Canadian Oil & Gas Market Industry in Energy Transition
7.1 Market Overview
7.2 Oil & Gas Companies Investment in Canadian Clean Energy Projects
7.3 Oil & Gas Companies Investment in Global Clean Energy Projects
7.4 Oil & Gas Companies Future Investment in Canadian Clean Energy Projects
7.5 Oil & Gas Companies Future Investment in Global Clean Energy Projects
8 Companies in the Canadian Oil & Gas Market
8.1 Suncor Energy Inc.
8.1.1 Company Snapshot
8.1.2 Company Overview
8.1.3 Financial Performance (2015-2019)
8.1.3.1 Net Revenue
8.1.3.2 Gross Profit
8.1.3.3 Geographic Revenue, 2019
8.1.3.4 Segmental Revenue, 2019
8.1.4 Recent Projects
8.1.4.1 Terra Nova FPSO
8.1.4.2 EV Fast Charging Stations
8.1.4.3 Syncrude Project
8.1.4.4 Hebron Project
8.1.5 Clean Energy Initiatives
8.1.5.1 LanzaTech & LanzaJet
8.1.5.2 Enerkem
8.1.5.3 Enhanced Solvent Extraction Incorporating Electromagnetic Heating (ESEIEH) Consortium
8.1.5.4 Forty Mile Wind Project
8.2 Imperial Oil Ltd.
8.2.1 Company Snapshot
8.2.2 Company Overview
8.2.3 Financials, 2015-2019
8.2.3.1 Net Revenue
8.2.3.2 Gross Profit
8.2.3.3 Segmental Revenue, 2019
8.2.4 Recent Projects
8.2.4.1 Expansion Plans
8.2.4.2 Exploration Permit
8.2.4.3 XTO Energy Canada
8.2.4.4 Waterdown to Finch Project
8.2.4.5 Aspen Oil Project Shutdown
8.2.5 Clean Energy Initiatives
8.2.5.1 Cogeneration
8.2.5.2 Cyclic Solvent Process (CSP) & LASER Project at Cold Lake
8.2.5.3 Advanced Fuels
8.2.5.4 Kearl Flue Gas Heat and Water Recovery Project
8.3 Canadian Natural Resources Ltd.
8.3.1 Company Snapshot
8.3.2 Company Overview
8.3.3 Financials, 2015-2019
8.3.3.1 Net Revenue
8.3.3.2 Gross Profit
8.3.3.3 Geographical Revenue, 2019
8.3.3.4 Segmental Revenue, 2019
8.3.4 Recent Projects
8.3.4.1 Polymer Flooding project at Pelican Lake
8.3.4.2 Horizon Oil Sands and the Athabasca Oil Sands Project (AOSP)
8.3.4.3 Kirby North Project
8.3.4.4 CNRL Acquisitions
8.3.5 Clean Energy Initiatives
8.3.5.1 GHG Emissions Reduction Program
8.3.5.2 Froth Treatment Tailings Technology
8.3.5.3 Continuous Emissions Monitoring System (CEMS)
8.3.5.4 Partnership with Canada's Oil Sands Innovation Alliance (COSIA)
8.3.5.5 Cogeneration Unit
8.4 Cenovus Energy Inc.
8.4.1 Company Snapshot
8.4.2 Company Overview
8.4.3 Financials, 2015-2019
8.4.3.1 Net Revenue
8.4.3.2 Gross Profit
8.4.3.3 Geographical Revenue, 2019
8.4.3.4 Segmental Revenue, 2019
8.4.4 Recent Projects
8.4.4.1 Christina Lake
8.4.4.2 Foster Creek
8.4.4.3 Narrows Lake
8.4.4.4 Telephone Lake
8.4.4.5 Wood River Refinery
8.4.4.6 Cenovus & Husky Plan to Integrate Operations
8.4.5 Clean Energy Initiatives
8.4.5.1 GHG Emissions Reduction
8.4.5.2 Collaborations
8.5 Husky Energy Inc.
8.5.1 Company Snapshot
8.5.2 Company Overview
8.5.3 Financials, 2015-2019
8.5.3.1 Net Revenue
8.5.3.2 Gross Profit
8.5.3.3 Geographical Revenue, 2019
8.5.3.4 Segmental Revenue, 2019
8.5.4 Recent Projects
8.5.4.1 Lima Refinery Crude Oil Flexibility Project
8.5.4.2 Thermal Bitumen Projects
8.5.4.3 Liwan Gas Project
8.5.4.4 Gas Project
8.5.4.5 West White Rose Project (WWRP)
8.5.4.6 Lloyd Upgrader Debottlenecking
8.5.5 Clean Energy Initiative
8.5.5.1 Carbon Capture and Storage
8.5.5.2 Husky’s Innovation Gateway program
8.6 TC Energy Corp.
8.6.1 Company Snapshot
8.6.2 Company Overview
8.6.3 Financials, 2015-2019
8.6.3.1 Net Revenue
8.6.3.2 Gross Profit
8.6.3.3 Geographical Revenue, 2019
8.6.3.4 Segmental Revenue, 2019
8.6.4 Recent Projects
8.6.4.1 Projects Under Development
8.6.4.2 Secured Projects
8.6.5 Clean Energy Initiative
8.6.5.1 Nuclear Power Facility
8.6.5.2 Solar plus Storage Electricity Generation
8.6.5.3 Waste Heat Power Generation Facility in Alberta
8.7 Pembina Pipeline Corp.
8.7.1 Company Snapshot
8.7.2 Company Overview
8.7.3 Financials, 2015-2019
8.7.3.1 Net Revenue
8.7.3.2 Gross Profit
8.7.3.3 Segmental Revenue, 2019
8.7.4 Recent Projects
8.7.4.1 Pipeline: Projects & New Development
8.7.4.2 Facilities: Projects & New Development
8.7.4.3 Marketing & New Ventures: Projects & New Development
8.7.5 Clean Energy Initiative
8.7.5.1 Co-generation Facilities
8.8 Chevron Canada Ltd.
8.8.1 Company Snapshot
8.8.2 Company Overview
8.8.3 Financials, 2015-2019
8.8.3.1 Net Revenue
8.8.3.2 Gross Profit
8.8.3.3 Geographical Revenue, 2019
8.8.3.4 Segmental Revenue, 2019
8.8.4 Recent Projects
8.8.4.1 Kaybob Duvernay Program
8.8.4.2 Kitimat LNG Project
8.8.4.3 Atlantic Canada
8.8.5 Clean Energy Initiative
8.8.5.1 Zap Energy
8.8.5.2 Renewable Base Oil Production
8.9 CNOOC International Limited
8.9.1 Company Snapshot
8.9.2 Company Overview
8.9.3 Financials, 2015-2019
8.9.3.1 Net Revenue
8.9.3.2 Gross Profit
8.9.3.3 Geographical Revenue, 2019
8.9.3.4 Segmental Revenue, 2019
8.9.4 Recent Projects
8.9.4.1 Long Lake Project
8.9.4.2 Atlantic Canada
8.9.5 Clean Energy Initiatives
8.9.5.1 Balzac Abandonment and Reclamation Project
8.10 Repsol Oil & Gas Canada, Inc.
8.10.1 Company Snapshot
8.10.2 Company Overview
8.10.3 Financials, 2015-2019
8.10.3.1 Net Revenue
8.10.3.2 Gross Profit
8.10.3.3 Geographical Revenue, 2019
8.10.3.4 Segmental Revenue, 2019
8.10.4 Recent Projects
8.10.4.1 Canaport LNG Terminal Conversion Project
8.10.5 Clean Energy Initiative
8.10.5.1 WindFloat Atlantic
8.11 Shell Canada Limited
8.11.1 Company Snapshot
8.11.2 Company Overview
8.11.3 Financials, 2015-2019
8.11.3.1 Net Revenue
8.11.3.2 Gross Profit
8.11.3.3 Geographical Revenue, 2019
8.11.3.4 Segmental Revenue, 2019
8.11.4 Recent Projects
8.11.4.1 LNG Canada
8.11.4.2 Athabasca Oil Sands Project (AOSP)
8.11.4.3 Sale of Foothills Assets
8.11.4.4 Shelburne Basin Exploration Project
8.11.5 Clean Energy Initiative
8.11.5.1 Quest Carbon capture, utilisation and storage
8.11.5.2 Electricity Generation & Storage
8.12 Syncrude Canada Ltd.
8.12.1 Company Snapshot
8.12.2 Company Overview
8.12.2.1 Syncrude: Synthetic Sweet Premium Production
8.12.2.2 Syncrude: Bitumen Production
8.12.3 Recent Projects
8.12.3.1 Mildred Lake West Extension
8.12.3.2 Syncrude bi-directional pipelines
8.12.4 Clean Energy Initiatives
8.12.4.1 Centrifuge Plant
8.12.4.2 GHG Enhancement and Energy Efficiency Performance
8.12.4.3 Flue Gas Desulphurization (FGD) Unit
8.13 MEG Energy
8.13.1 Company Snapshot
8.13.2 Company Overview
8.13.3 Financials, 2015-2019
8.13.3.1 Net Revenue
8.13.3.2 Gross Profit
8.13.3.3 Geographical Revenue, 2019
8.13.3.4 Segmental Revenue, 2019
8.13.4 Recent Developments (2016-2020)
8.13.4.1 Christina Lake Project
8.13.4.2 Surmont Project
8.13.4.3 Trans Mountain Expansion Project
8.13.5 Clean Energy Initiatives
8.13.5.1 eMSAGP and eMVAPEX Technology
8.14 Athabasca Oil Corporation
8.14.1 Company Snapshot
8.14.2 Company Overview
8.14.3 Financial Performance, 2015-2019
8.14.3.1 Net Revenue
8.14.3.2 Gross Profit
8.14.3.3 Segmental Revenue, 2019
8.14.4 Recent Projects
8.14.4.1 Thermal Oil
8.14.4.2 Light Oil
8.14.4.3 Leismer Infrastructure Transaction
8.14.5 Clean Energy Initiatives
8.15 TE Connectivity
8.15.1 Company Snapshot
8.15.2 Company Overview
8.15.3 Financials, 2015-2019
8.15.3.1 Net Revenue
8.15.3.2 Gross Profit
8.15.3.3 Geographical Revenue, 2019
8.15.3.4 Segmental Revenue, 2019
8.15.4 Recent Projects
8.15.4.1 Infrastructure for oil extraction platform in North Sea
8.16 ConocoPhillips Canada
8.16.1 Company Snapshot
8.16.2 Company Overview
8.16.3 Financials, 2015-2019
8.16.3.1 Net Revenue
8.16.3.2 Gross Profit
8.16.3.3 Geographical Revenue, 2019
8.16.3.4 Segmental Revenue, 2019
8.16.4 Recent Projects
8.16.4.1 Surmont Project
8.16.4.2 Montney Project
8.16.5 Clean Energy Initiatives
8.16.5.1 Non-Condensable Gas (NCG) Co-Injection
8.17 Enbridge Inc.
8.17.1 Company Snapshot
8.17.2 Company Overview
8.17.3 Financials, 2015-2019
8.17.3.1 Net Revenue
8.17.3.2 Gross Profit
8.17.3.3 Geographical Revenue, 2019
8.17.3.4 Segmental Revenue, 2019
8.17.4 Recent Projects
8.17.4.1 Liquid Pipelines
8.17.4.2 Gas Transmission and Midstream
8.17.4.3 Gas Distribution and Storage
8.17.4.4 Other Projects
8.17.5 Clean Energy Initiative
8.17.5.1 Renewable Power Generation Projects
8.17.5.2 Five Year Modernization Program
8.18 Other Notable Players
9 Conclusion
9.1 Concluding Remarks from Visiongain
9.2 Recommendations for Market Players
9.2.1 Investing in EOR Technologies
9.2.2 Divesting into Renewable Energy Generation
9.2.3 Research & Development in Sustainable Fuels and Technologies
9.2.4 Investment in LNG Infrastructure
10 Glossary
LIST OF TABLES
Table 1 Canada Crude Oil Import, 2018 & 2019 (Million Tonnes, Thousand Bbl/d)
Table 2 Canada Crude Oil Export, 2018 & 2019 (Million Tonnes, Thousand Bbl/d)
Table 3 Canadian Oil & Gas Market, 2021-2035 (US$ billion, CAGR %)
Table 4 Suncor Energy Inc.: Wind Power Facilities
Table 5 Enbridge: Wind Power Generation: Projects & New Developments
Table 6 Stock Prices: COVID-19 Pandemic Low v/s Jan 2021
Table 7 Canadian Oil Market Production Forecast, 2021-2028 (Thousand Barrels Per Day, AGR %, CAGR %) (Pre COVID 19)
Table 8 Canadian Oil Market Production Forecast, 2028-2035 (Thousand Barrels Per Day, AGR %, CAGR %) (Pre COVID 19)
Table 9 Canadian Oil Market Revenue Forecast, 2021-2028 ($billion, AGR %, CAGR %) (Pre COVID 19)
Table 10 Canadian Oil Market Revenue Forecast, 2028-2035 ($billion, AGR %, CAGR %) (Pre COVID 19)
Table 11 V Shaped Recovery: Canadian Oil Market Production Forecast, 2021-2028 (Thousand Barrels Per Day, AGR %, CAGR %)
Table 12 V Shaped Recovery: Canadian Oil Market Production Forecast, 2028-2035 (Thousand Barrels Per Day, AGR %, CAGR %)
Table 13 V Shaped Recovery: Canadian Oil Market Revenue Forecast, 2021-2028 ($billion, AGR %, CAGR %)
Table 14 V Shaped Recovery: Canadian Oil Market Revenue Forecast, 2028-2035 ($billion, AGR %, CAGR %)
Table 15 U Shaped Recovery: Canadian Oil Market Production Forecast, 2021-2028 (Thousand Barrels Per Day, AGR %, CAGR %)
Table 16 U Shaped Recovery: Canadian Oil Market Production Forecast, 2028-2035 (Thousand Barrels Per Day, AGR %, CAGR %)
Table 17 U Shaped Recovery: Canadian Oil Market Revenue Forecast, 2021-2028 ($billion, AGR %, CAGR %)
Table 18 U Shaped Recovery: Canadian Oil Market Revenue Forecast, 2028-2035 ($billion, AGR %, CAGR %)
Table 19 W Shaped Recovery: Canadian Oil Market Production Forecast, 2021-2028 (Thousand Barrels Per Day, AGR %, CAGR %)
Table 20 W Shaped Recovery: Canadian Oil Market Production Forecast, 2028-2035 (Thousand Barrels Per Day, AGR %, CAGR %)
Table 21 W Shaped Recovery: Canadian Oil Market Revenue Forecast, 2021-2028 ($billion, AGR %, CAGR %)
Table 22 W Shaped Recovery: Canadian Oil Market Revenue Forecast, 2028-2035 ($billion, AGR %, CAGR %)
Table 23 L Shaped Recovery: Canadian Oil Market Production Forecast, 2021-2028 (Thousand Barrels Per Day, AGR %, CAGR %)
Table 24 L Shaped Recovery: Canadian Oil Market Production Forecast, 2028-2035 (Thousand Barrels Per Day, AGR %, CAGR %)
Table 25 L Shaped Recovery: Canadian Oil Market Revenue Forecast, 2021-2028 ($billion, AGR %, CAGR %)
Table 26 L Shaped Recovery: Canadian Oil Market Revenue Forecast, 2028-2035 ($billion, AGR %, CAGR %)
Table 27 Canadian Natural Gas Market Production Forecast, 2021-2028 (Billion Cubic Feet Per Day, AGR %, CAGR %) (Pre COVID 19)
Table 28 Canadian Natural Gas Market Production Forecast, 2028-2035 (Billion Cubic Feet Per Day, AGR %, CAGR %) (Pre COVID 19)
Table 29 Canadian Natural Gas Market Revenue Forecast, 2021-2028 ($billion, AGR %, CAGR %) (Pre COVID 19)
Table 30 Canadian Natural Gas Market Revenue Forecast, 2028-2035 ($billion, AGR %, CAGR %) (Pre COVID 19)
Table 31 V Shaped Recovery: Canadian Natural Gas Market Production Forecast, 2021-2028 (Billion Cubic Feet Per Day, AGR %, CAGR %)
Table 32 V Shaped Recovery: Canadian Natural Gas Market Production Forecast, 2028-2035 (Billion Cubic Feet Per Day, AGR %, CAGR %)
Table 33 V Shaped Recovery: Canadian Natural Gas Market Revenue Forecast, 2021-2028 ($billion, AGR %, CAGR %)
Table 34 V Shaped Recovery: Canadian Natural Gas Market Revenue Forecast, 2028-2035 ($billion, AGR %, CAGR %)
Table 35 U Shaped Recovery: Canadian Natural Gas Market Production Forecast, 2021-2028 (Billion Cubic Feet Per Day, AGR %, CAGR %)
Table 36 U Shaped Recovery: Canadian Natural Gas Market Production Forecast, 2028-2035 (Billion Cubic Feet Per Day, AGR %, CAGR %)
Table 37 U Shaped Recovery: Canadian Natural Gas Market Revenue Forecast, 2021-2028 ($billion, AGR %, CAGR %)
Table 38 U Shaped Recovery: Canadian Natural Gas Market Revenue Forecast, 2028-2035 ($billion, AGR %, CAGR %)
Table 39 W Shaped Recovery: Canadian Natural Gas Market Production Forecast, 2021-2028 (Billion Cubic Feet Per Day, AGR %, CAGR %)
Table 40 W Shaped Recovery: Canadian Natural Gas Market Production Forecast, 2028-2035 (Billion Cubic Feet Per Day, AGR %, CAGR %)
Table 41 W Shaped Recovery: Canadian Natural Gas Market Revenue Forecast, 2021-2028 ($billion, AGR %, CAGR %)
Table 42 W Shaped Recovery: Canadian Natural Gas Market Revenue Forecast, 2028-2035 ($billion, AGR %, CAGR %)
Table 43 L Shaped Recovery: Canadian Natural Gas Market Production Forecast, 2021-2028 (Billion Cubic Feet Per Day, AGR %, CAGR %)
Table 44 L Shaped Recovery: Canadian Natural Gas Market Production Forecast, 2028-2035 (Billion Cubic Feet Per Day, AGR %, CAGR %)
Table 45 L Shaped Recovery: Canadian Natural Gas Market Revenue Forecast, 2021-2028 ($billion, AGR %, CAGR %)
Table 46 L Shaped Recovery: Canadian Natural Gas Market Revenue Forecast, 2028-2035 ($billion, AGR %, CAGR %)
Table 47 Key LNG Projects in Canada
Table 48 Canadian LNG Market Production Forecast, 2021-2028 (Billion Cubic Feet Per Day, AGR %, CAGR %) (Pre COVID 19)
Table 49 Canadian LNG Market Production Forecast, 2028-2035 (Billion Cubic Feet Per Day, AGR %, CAGR %) (Pre COVID 19)
Table 50 Canadian LNG Market Revenue Forecast, 2021-2028 ($billion, AGR %, CAGR %) (Pre COVID 19)
Table 51 Canadian LNG Market Revenue Forecast, 2028-2035 ($billion, AGR %, CAGR %) (Pre COVID 19)
Table 52 V Shaped Recovery: Canadian LNG Market Production Forecast, 2021-2028 (Billion Cubic Feet Per Day, AGR %, CAGR %)
Table 53 V Shaped Recovery: Canadian LNG Market Production Forecast, 2028-2035 (Billion Cubic Feet Per Day, AGR %, CAGR %)
Table 54 V Shaped Recovery: Canadian LNG Market Revenue Forecast, 2021-2028 ($billion, AGR %, CAGR %)
Table 55 V Shaped Recovery: Canadian LNG Market Revenue Forecast, 2028-2035 ($billion, AGR %, CAGR %)
Table 56 U Shaped Recovery: Canadian LNG Market Production Forecast, 2021-2028 (Billion Cubic Feet Per Day, AGR %, CAGR %)
Table 57 U Shaped Recovery: Canadian LNG Market Production Forecast, 2028-2035 (Billion Cubic Feet Per Day, AGR %, CAGR %)
Table 58 U Shaped Recovery: Canadian LNG Market Revenue Forecast, 2021-2028 ($billion, AGR %, CAGR %)
Table 59 U Shaped Recovery: Canadian LNG Market Revenue Forecast, 2028-2035 ($billion, AGR %, CAGR %)
Table 60 W Shaped Recovery: Canadian LNG Market Production Forecast, 2021-2028 (Billion Cubic Feet Per Day, AGR %, CAGR %)
Table 61 W Shaped Recovery: Canadian LNG Market Production Forecast, 2028-2035 (Billion Cubic Feet Per Day, AGR %, CAGR %)
Table 62 W Shaped Recovery: Canadian LNG Market Revenue Forecast, 2021-2028 ($billion, AGR %, CAGR %)
Table 63 W Shaped Recovery: Canadian LNG Market Revenue Forecast, 2028-2035 ($billion, AGR %, CAGR %)
Table 64 L Shaped Recovery: Canadian LNG Market Production Forecast, 2021-2028 (Billion Cubic Feet Per Day, AGR %, CAGR %)
Table 65 L Shaped Recovery: Canadian LNG Market Production Forecast, 2028-2035 (Billion Cubic Feet Per Day, AGR %, CAGR %)
Table 66 L Shaped Recovery: Canadian LNG Market Revenue Forecast, 2021-2028 ($billion, AGR %, CAGR %)
Table 67 L Shaped Recovery: Canadian LNG Market Revenue Forecast, 2028-2035 ($billion, AGR %, CAGR %)
Table 68 Canadian Oil & Gas Upstream Market Revenue Forecast, 2021-2028 ($billion, AGR %, CAGR %) (Pre COVID 19)
Table 69 Canadian Oil & Gas Upstream Market Revenue Forecast, 2028-2035 ($billion, AGR %, CAGR %) (Pre COVID 19)
Table 70 V Shaped Recovery: Canadian Oil & Gas Upstream Market Revenue Forecast, 2021-2028 ($billion, AGR %, CAGR %)
Table 71 V Shaped Recovery: Canadian Oil & Gas Upstream Market Revenue Forecast, 2028-2035 ($billion, AGR %, CAGR %)
Table 72 U Shaped Recovery: Canadian Oil & Gas Upstream Market Revenue Forecast, 2021-2028 ($billion, AGR %, CAGR %)
Table 73 U Shaped Recovery: Canadian Oil & Gas Upstream Market Revenue Forecast, 2028-2035 ($billion, AGR %, CAGR %)
Table 74 W Shaped Recovery: Canadian Oil & Gas Upstream Market Revenue Forecast, 2021-2028 ($billion, AGR %, CAGR %)
Table 75 W Shaped Recovery: Canadian Oil & Gas Upstream Market Revenue Forecast, 2028-2035 ($billion, AGR %, CAGR %)
Table 76 L Shaped Recovery: Canadian Oil & Gas Upstream Market Revenue Forecast, 2021-2028 ($billion, AGR %, CAGR %)
Table 77 L Shaped Recovery: Canadian Oil & Gas Upstream Market Revenue Forecast, 2028-2035 ($billion, AGR %, CAGR %)
Table 78 Canadian Oil & Gas Midstream Market Revenue Forecast, 2021-2028 ($billion, AGR %, CAGR %) (Pre COVID 19)
Table 79 Canadian Oil & Gas Midstream Market Revenue Forecast, 2028-2035 ($billion, AGR %, CAGR %) (Pre COVID 19)
Table 80 V Shaped Recovery: Canadian Oil & Gas Midstream Market Revenue Forecast, 2021-2028 ($billion, AGR %, CAGR %)
Table 81 V Shaped Recovery: Canadian Oil & Gas Midstream Market Revenue Forecast, 2028-2035 ($billion, AGR %, CAGR %)
Table 82 U Shaped Recovery: Canadian Oil & Gas Midstream Market Revenue Forecast, 2021-2028 ($billion, AGR %, CAGR %)
Table 83 U Shaped Recovery: Canadian Oil & Gas Midstream Market Revenue Forecast, 2028-2035 ($billion, AGR %, CAGR %)
Table 84 W Shaped Recovery: Canadian Oil & Gas Midstream Market Revenue Forecast, 2021-2028 ($billion, AGR %, CAGR %)
Table 85 W Shaped Recovery: Canadian Oil & Gas Midstream Market Revenue Forecast, 2028-2035 ($billion, AGR %, CAGR %)
Table 86 L Shaped Recovery: Canadian Oil & Gas Midstream Market Revenue Forecast, 2021-2028 ($billion, AGR %, CAGR %)
Table 87 L Shaped Recovery: Canadian Oil & Gas Midstream Market Revenue Forecast, 2028-2035 ($billion, AGR %, CAGR %)
Table 88 Canadian Oil & Gas Downstream Market Revenue Forecast, 2021-2028 ($billion, AGR %, CAGR %) (Pre COVID 19)
Table 89 Canadian Oil & Gas Downstream Market Revenue Forecast, 2028-2035 ($billion, AGR %, CAGR %) (Pre COVID 19)
Table 90 V Shaped Recovery: Canadian Oil & Gas Downstream Market Revenue Forecast, 2021-2028 ($billion, AGR %, CAGR %)
Table 91 V Shaped Recovery: Canadian Oil & Gas Downstream Market Revenue Forecast, 2028-2035 ($billion, AGR %, CAGR %)
Table 92 U Shaped Recovery: Canadian Oil & Gas Downstream Market Revenue Forecast, 2021-2028 ($billion, AGR %, CAGR %)
Table 93 U Shaped Recovery: Canadian Oil & Gas Downstream Market Revenue Forecast, 2028-2035 ($billion, AGR %, CAGR %)
Table 94 W Shaped Recovery: Canadian Oil & Gas Downstream Market Revenue Forecast, 2021-2028 ($billion, AGR %, CAGR %)
Table 95 W Shaped Recovery: Canadian Oil & Gas Downstream Market Revenue Forecast, 2028-2035 ($billion, AGR %, CAGR %)
Table 96 L Shaped Recovery: Canadian Oil & Gas Downstream Market Revenue Forecast, 2021-2028 ($billion, AGR %, CAGR %)
Table 97 L Shaped Recovery: Canadian Oil & Gas Downstream Market Revenue Forecast, 2028-2035 ($billion, AGR %, CAGR %)
Table 98 Canadian Oil & Gas Service Market Revenue Forecast, 2021-2028 ($billion, AGR %, CAGR %) (Pre COVID 19)
Table 99 Canadian Oil & Gas Service Market Revenue Forecast, 2028-2035 ($billion, AGR %, CAGR %) (Pre COVID 19)
Table 100 V Shaped Recovery: Canadian Oil & Gas Service Market Revenue Forecast, 2021-2028 ($billion, AGR %, CAGR %)
Table 101 V Shaped Recovery: Canadian Oil & Gas Service Market Revenue Forecast, 2028-2035 ($billion, AGR %, CAGR %)
Table 102 U Shaped Recovery: Canadian Oil & Gas Service Market Revenue Forecast, 2021-2028 ($billion, AGR %, CAGR %)
Table 103 U Shaped Recovery: Canadian Oil & Gas Service Market Revenue Forecast, 2028-2035 ($billion, AGR %, CAGR %)
Table 104 W Shaped Recovery: Canadian Oil & Gas Service Market Revenue Forecast, 2021-2028 ($billion, AGR %, CAGR %)
Table 105 W Shaped Recovery: Canadian Oil & Gas Service Market Revenue Forecast, 2028-2035 ($billion, AGR %, CAGR %)
Table 106 L Shaped Recovery: Canadian Oil & Gas Service Market Revenue Forecast, 2021-2028 ($billion, AGR %, CAGR %)
Table 107 L Shaped Recovery: Canadian Oil & Gas Service Market Revenue Forecast, 2028-2035 ($billion, AGR %, CAGR %)
Table 108 Canadian Conventional Oil & Gas Market Revenue Forecast, 2021-2028 ($billion, AGR %, CAGR %) (Pre COVID 19)
Table 109 Canadian Conventional Oil & Gas Market Revenue Forecast, 2028-2035 ($billion, AGR %, CAGR %) (Pre COVID 19)
Table 110 V Shaped Recovery: Canadian Conventional Oil & Gas Market Revenue Forecast, 2021-2028 ($billion, AGR %, CAGR %)
Table 111 V Shaped Recovery: Canadian Conventional Oil & Gas Market Revenue Forecast, 2028-2035 ($billion, AGR %, CAGR %)
Table 112 U Shaped Recovery: Canadian Conventional Oil & Gas Market Revenue Forecast, 2021-2028 ($billion, AGR %, CAGR %)
Table 113 U Shaped Recovery: Canadian Conventional Oil & Gas Market Revenue Forecast, 2028-2035 ($billion, AGR %, CAGR %)
Table 114 W Shaped Recovery: Canadian Conventional Oil & Gas Market Revenue Forecast, 2021-2028 ($billion, AGR %, CAGR %)
Table 115 W Shaped Recovery: Canadian Conventional Oil & Gas Market Revenue Forecast, 2028-2035 ($billion, AGR %, CAGR %)
Table 116 L Shaped Recovery: Canadian Conventional Oil & Gas Market Revenue Forecast, 2021-2028 ($billion, AGR %, CAGR %)
Table 117 L Shaped Recovery: Canadian Conventional Oil & Gas Market Revenue Forecast, 2028-2035 ($billion, AGR %, CAGR %)
Table 118 Canadian Unconventional Oil & Gas Market Revenue Forecast, 2021-2028 ($billion, AGR %, CAGR %) (Pre COVID 19)
Table 119 Canadian Unconventional Oil & Gas Market Revenue Forecast, 2028-2035 ($billion, AGR %, CAGR %) (Pre COVID 19)
Table 120 V Shaped Recovery: Canadian Unconventional Oil & Gas Market Revenue Forecast, 2021-2028 ($billion, AGR %, CAGR %)
Table 121 V Shaped Recovery: Canadian Unconventional Oil & Gas Market Revenue Forecast, 2028-2035 ($billion, AGR %, CAGR %)
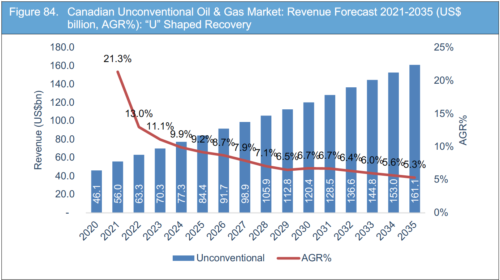
Table 122 U Shaped Recovery: Canadian Unconventional Oil & Gas Market Revenue Forecast, 2021-2028 ($billion, AGR %, CAGR %)
Table 123 U Shaped Recovery: Canadian Unconventional Oil & Gas Market Revenue Forecast, 2028-2035 ($billion, AGR %, CAGR %)
Table 124 W Shaped Recovery: Canadian Unconventional Oil & Gas Market Revenue Forecast, 2021-2028 ($billion, AGR %, CAGR %)
Table 125 W Shaped Recovery: Canadian Unconventional Oil & Gas Market Revenue Forecast, 2028-2035 ($billion, AGR %, CAGR %)
Table 126 L Shaped Recovery: Canadian Unconventional Oil & Gas Market Revenue Forecast, 2021-2028 ($billion, AGR %, CAGR %)
Table 127 L Shaped Recovery: Canadian Unconventional Oil & Gas Market Revenue Forecast, 2028-2035 ($billion, AGR %, CAGR %)
Table 128 Oil & Gas Companies Investments in Canadian Clean Energy Projects
Table 129 Oil & Gas Companies Investments in Global Clean Energy Projects
Table 130 Oil & Gas Companies Future Investments in Canadian Clean Energy Projects
Table 131 Oil & Gas Companies Future Investments in Clean Energy Projects
Table 132 Suncor Energy Inc. Profile 2020 (CEO, HQ, Founded, No. of Employees, Website, Business Segment, Revenue, Crude Oil Output)
Table 133 Suncor Energy Inc.: Terra Nova Owners and their Working Interest
Table 134 Suncor Energy Inc.: Syncrude Joint Venture Owners
Table 135 Suncor Energy Inc.: Wind Power Facilities
Table 136 Imperial Oil Ltd. Profile 2020 (CEO, HQ, Founded, No. of Employees, Website, Ticker, Business Segment, Revenue, Crude Oil Output, Natural Gas)
Table 137 Canadian Natural Resources Ltd. Profile 2020 (President, HQ, Founded, No. of Employees, Website, Ticker, Business Segment, Revenue, Crude Oil Output, Natural Gas)
Table 138 CNRL Polymer Flooding CAPEX
Table 139 Ownership Interests of ASOP
Table 140 Canadian Natural Resources (CNRL) Recent Acquisitions
Table 141 CNRL CCS Projects
Table 142 Cenovus Energy Inc. Profile 2020 (CEO, HQ, Founded, No. of Employees, Website, Ticker, Business Segment, Revenue, Crude Oil Output, Natural Gas)
Table 143 Revised Production Targets of Cenovus for 2020
Table 144 Husky Energy Inc. Company Profile 2020 (CEO, HQ, Founded, No. of Employees, Website, Ticker, Business Segment, Revenue, Crude Oil, NGL, Natural Gas)
Table 145 Husky Energy Project Schedule
Table 146 Husky Energy Inc.: Thermal Projects
Table 147 TC Energy Corp. Profile 2020 (CEO, HQ, Founded, No. of Employees, Website, Business Segment, Revenue, Natural Gas Pipeline, Liquids Pipeline, Power Generation)
Table 148 TC Energy Corp.: Ongoing Projects
Table 149 TC Energy Corp.: Ongoing Projects
Table 150 Pembina Pipeline Corp. Profile 2020 (CEO, HQ, Founded, No. of Employees, Website, Ticker, Business Segment, Revenue, Pipeline)
Table 151 Pipeline: Projects & New Developments
Table 152 Facilities: Projects & New Developments
Table 153 Marketing & New Ventures: Projects & New Developments
Table 154 Chevron Canada Ltd. Profile 2020 (CEO, HQ, Founded, No. of Employees, Website, Ticker, Business Segment, Revenue, Crude Oil Output)
Table 155 CNOOC International Limited. Profile 2020 (CEO, HQ, Founded, No. of Employees, Website, Business Segment, Revenue, Crude Oil Output)
Table 156 Repsol Oil & Gas Canada, Inc. Profile 2020 (CEO, HQ, Founded, No. of Employees, Website, Business Segment, Revenue)
Table 157 Shell Canada Limited, Company Profile 2020 (CEO, HQ, Founded, No. of Employees, Website, Business Segment, Revenue)
Table 158 Syncrude Canada Ltd., Company Profile 2020 (Managing Director, HQ, Founded, No. of Employees, Website, Business Segment, Cumulative Production)
Table 159 Suncor Energy Inc.: Syncrude Joint Venture Owners
Table 160 MEG Energy, Company Profile 2020 (CEO, HQ, Founded, Website, Business Segment, Revenue, Bitumen Production)
Table 161 Athabasca Oil Corporation, Company Profile 2020 (CEO, HQ, Founded, Website, Ticker, Business Segment, Revenue, Crude Oil Output)
Table 162 TE Connectivity, Company Profile 2020 (CEO, HQ, Founded, No. of Employees, Website, Ticker, Business Segment, Revenue)
Table 163 ConocoPhillips Canada, Company Profile 2020 (President, HQ, Founded, No. of Employees, Website, Ticker, Business Segment, Revenue)
Table 164 Enbridge Inc., Profile 2020 (CEO, HQ, Founded, No. of Employees, Website, Ticker, Business Segment, Revenue, Pipeline)
Table 165 Liquid Pipeline: Projects & New Developments
Table 166 Gas Transmission and Midstream: Projects & New Developments
Table 167 Gas Distribution and Storage: Projects & New Developments
Table 168 Other Projects
Table 169 Renewable Power Generation: Projects & New Developments
LIST OF FIGURES
Figure 1. Canada Crude Oil Production (Thousand Barrels/Day)
Figure 2. Canada Natural Gas Production (Billion Cubic Meters)
Figure 3. Market Size Estimation
Figure 4. Canadian Oil & Gas Market Segmentation
Figure 5. Brent Crude Oil Prices 2014 to 2020
Figure 6. Canadian Light Sweet Oil Prices , 2010-2029
Figure 7. Western Canadian Select Oil Prices , 2010-2029
Figure 8. Forecasted Average Oil Prices 2020 to 2050
Figure 9. Henry Hub Natural Gas Prices , 2010-2029
Figure 10. AECO-C Natural Gas Prices , 2010-2029
Figure 12. Canada Crude Oil Import, By Region, 2019 %
Figure 13. Canada Crude Oil Export, By Country/Region, 2019 (%)
Figure 14. Canada Natural Gas Import, 2015-2019 (Bcf/d)
Figure 15. Canada Natural Gas Export to U.S., 2015-2019 (Bcf/d)
Figure 16. Canadian Oil & Gas Market Overview
Figure 17. GDP Growth, 2012-2019 (%)
Figure 18. SWOT Analysis
Figure 19. Porter’s Five Force Analysis
Figure 20. Active Project By COSIA, By Segment, 2019
Figure 21. Canadian Oil & Gas Market, by Energy Source, 2021 & 2035
Figure 22. Wells Drilled in Canada, by Region, 2018, 2019, 2020E
Figure 23. Canada Crude Oil Production and Consumption, 2010 to 2019
Figure 54. Canadian Oil & Gas Market, by Operating Segment, 2021 & 2035
Figure 75. Canadian Oil & Gas Market, by Method, 2021 & 2035
Figure 87. Suncor Power Inc. Net Revenue, 2015-2019 (US$ billion, AGR %)
Figure 88. Suncor Power Inc. Gross Profit, 2015-2019 (US$ million, AGR %)
Figure 89. Suncor Power Inc. Geographic Revenue, 2019 (%)
Figure 90. Suncor Power Inc. Segmental Revenue, 2019 (%)
Figure 91. Imperial Oil Ltd. Net Revenue, 2015-2019 (US$ billion, AGR %)
Figure 92. Imperial Oil Ltd. Gross Profit, 2015-2019 (US$ million, AGR %)
Figure 93. Imperial Oil Ltd., Segmental Revenue, 2019 (%)
Figure 94. Canadian Natural Resources Ltd. Net Revenue, 2015-2019 (US$ billion, AGR %)
Figure 95. Canadian Natural Resources Ltd. Gross Profit, 2015-2019 (US$ million, AGR %)
Figure 96. Canadian Natural Resources Ltd. Geographical Revenue, 2019 (%)
Figure 97. Canadian Natural Resources Ltd., Segmental Revenue, 2019 (%)
Figure 98. Cenovus Energy Inc. Net Revenue, 2015-2019 (US$ billion, AGR %)
Figure 99. Cenovus Energy Inc. Gross Profit, 2015-2019 (US$ million, AGR %)
Figure 100. Cenovus Energy Inc. Geographical Revenue, 2019 (%)
Figure 101. Cenovus Energy Inc., Segmental Revenue, 2019 (%)
Figure 102. Husky Energy Inc. Net Revenue, 2015-2019 (US$ billion, AGR %)
Figure 103. Husky Energy Inc. Gross Profit, 2015-2019 (US$ million, AGR %)
Figure 104. Husky Energy Inc. Geographical Revenue, 2019 (%)
Figure 105. Husky Energy Inc., Segmental Revenue, 2019 (%)
Figure 106. TC Energy Corp. Net Revenue, 2015-2019 (US$ billion, AGR %)
Figure 107. TC Energy Corp. Gross Profit, 2015-2019 (US$ million, AGR %)
Figure 108. TC Energy Corp. Geographical Revenue, 2019 (%)
Figure 109. TC Energy Corp., Segmental Revenue, 2019 (%)
Figure 110. Pembina Pipeline Corp. Net Revenue, 2015-2019 (US$ billion, AGR %)
Figure 111. Pembina Pipeline Corp. Gross Profit, 2015-2019 (US$ million, AGR %)
Figure 112. Pembina Pipeline Corp., Segmental Revenue, 2019 (%)
Figure 113. Chevron Canada Ltd. Net Revenue, 2015-2019 (US$ billion, AGR %)
Figure 114. Chevron Canada Ltd. Gross Profit, 2015-2019 (US$ million, AGR %)
Figure 115. Chevron Canada Ltd. Geographical Revenue, 2019 (%)
Figure 116. Chevron Canada Ltd., Segmental Revenue, 2019 (%)
Figure 117. China National Offshore Oil Corporation (CNOOC) Crude Oil & Liquids, 2019 (mm bbls)
Figure 118. CNOOC International Limited. Net Revenue, 2015-2019 (US$ billion, AGR %)
Figure 119. CNOOC International Limited. Gross Profit, 2015-2019 (US$ billion, AGR %)
Figure 120. CNOOC International Limited. Geographical Revenue, 2019 (%)
Figure 121. CNOOC International Limited., Segmental Revenue, 2019 (US$ million)
Figure 122. Repsol Oil & Gas Canada, Inc. Net Revenue, 2015-2019 (US$ billion, AGR %)
Figure 123. Repsol Oil & Gas Canada, Inc. Gross Profit, 2015-2019 (US$ million, AGR %)
Figure 124. Repsol Oil & Gas Canada, Inc. Geographical Revenue, 2019 (%)
Figure 125. Repsol Oil & Gas Canada, Inc., Segmental Revenue, 2019 (%)
Figure 126. Shell Canada Limited., Net Revenue, 2015-2019 (US$ billion, AGR %)
Figure 127. Shell Canada Limited, Gross Profit, 2015-2019 (US$ Billion, AGR %)
Figure 128. Shell Canada Limited., Geographical Revenue, 2019 (%)
Figure 129. Shell Canada Limited., Segmental Revenue, 2019 (%)
Figure 130. Syncrude: Synthetic Sweet Premium Production, 2015-2019 (US$ billion, AGR %)
Figure 131. Syncrude: Bitumen Production, 2015-2019 (US$ billion, AGR %)
Figure 132. MEG Energy, Net Revenue, 2015-2019 (US$ million, AGR %)
Figure 133. MEG Energy, Gross Profit, 2015-2019 (US$ million, AGR %)
Figure 134. MEG Energy, Geographical Revenue, 2019 (%)
Figure 135. MEG Energy, Segmental Revenue, 2019 (%)
Figure 136. Athabasca Oil Corporation, Net Revenue, 2015-2019 (US$ million, AGR %)
Figure 137. Athabasca Oil Corporation, Gross Profit, 2015-2019 (US$ million, AGR %)
Figure 138. Athabasca Oil Corporation, Segmental Revenue, 2019 (%)
Figure 139. TE Connectivity, Net Revenue, 2015-2019 (US$ billion, AGR %)
Figure 140. TE Connectivity, Gross Profit, 2015-2019 (US$ million, AGR %)
Figure 141. TE Connectivity, Geographical Revenue, 2019 (%)
Figure 142. TE Connectivity, Segmental Revenue, 2019 (%)
Figure 143. ConocoPhillips Canada, Net Revenue, 2015-2019 (US$ billion, AGR %)
Figure 144. ConocoPhillips Canada, Gross Profit, 2015-2019 (US$ million, AGR %)
Figure 145. ConocoPhillips Canada, Geographical Revenue, 2019 (%)
Figure 146. ConocoPhillips Canada, Segmental Revenue, 2019 (%)
Figure 147. Enbridge Inc., Net Revenue, 2015-2019 (US$ billion, AGR %)
Figure 148. Enbridge Inc., Gross Profit, 2015-2019 (US$ million, AGR %)
Figure 149. Enbridge Inc., Geographical Revenue, 2019 (%)
Figure 150. Enbridge Inc., Segmental Revenue, 2019 (%)
Companies Profiled in the Report:
Athabasca Oil Corporation
Canadian Natural Resources Ltd.
Cenovus Energy Inc.
Chevron Canada Ltd.
CNOOC International Limited
ConocoPhillips Canada
Enbridge Inc.
Husky Energy Inc.
Imperial Oil Ltd.
MEG Energy
Pembina Pipeline Corp.
Repsol Oil & Gas Canada, Inc.
Shell Canada Ltd.
Suncor Energy Inc.
Syncrude Canada Ltd
TC Energy Corp.
TE Connectivity Ltd.
List of Companies Mentioned in the Report:
Abraxas Petroleum Corp.
Adams Resources & Energy Inc.
Amplify Energy Corp.
Anadarko Petroleum Corp.
Andeavor
Antero Resources Corp.
Apache Corp.
Approach Resources Inc.
Black Stone Minerals LP
Blue Dolphin Energy Co.
Bonanza Creek Energy Inc.
Breitburn Energy Partners LP
Cabot Oil & Gas Corp.
California Resources Corp.
Callon Petroleum Co.
Calumet Specialty Product Partners LP
Camber Energy Inc.
Carrizo Oil & Gas Inc.
Centennial Resource Development Inc.
Chesapeak Energy Corp.
Chevron Corp.
Cimarex Energy Co.
Citadel Exploration Inc.
CKX Lands Inc.
CNX Resources Corp.
Cobalt International Energy Inc.
Comstock Resources Inc.
Concho Resources Inc.
ConocoPhillips
Contango Oil & Gas Co.
Continental Resources Inc.
CVR Energy Inc.
Daybreak Oil & Gas Inc.
Delek US Holdings
Denbury Resources Inc.
Diamondback Energy Inc.
Dorchester Minerals LP
Earthstone Energy Inc.
Eclipse Resources Corp.
Energen Corp.
Energy XXI Gulf Coast Inc.
EOG Resources Inc.
EP Energy Corp.
EQT Corp.
ERHC Energy Inc.
Erin Energy Corp.
EV Energy Partners LP
Evolution Petroleum Corp.
EXCO Resources Inc.
Extraction Oil & Gas Inc.
ExxonMobil Corp.
FieldPoint Petroleum Corp.
Freeport-McMoRan Inc.
Genie Energy Ltd.
Goodrich Petroleum Corp.
GulfSlope Energy Inc.
Halcon Resources Corp.
Hess Corp.
HighPoint Resources Corp.
HollyFrontier Corp.
Houston American Energy Corp.
Isramco Inc.
Jagged Peak Energy Inc.
Jones Energy Inc.
Kimbell Royalty Partners LP
Kinder Morgan Inc.
Kosmos Energy Ltd.
Laredo Petroleum Inc.
Legacy Reserves LP
Lilis Energy Inc.
Linn Energy Inc.
Lonestar Resources US Inc.
Marathon Oil Corp.
Marathon Petroleum Corp.
Matador Resources Co.
Mexco Energy Corp.
Mid-Con Energy Partners LP
Midstates Petroleum Company Inc.
Murphy Oil Corp.
National Fuel Gas
Newfield Exploration Company
Noble Energy Inc.
Northern Oil & Gas Inc.
Oasis Petroleum Inc.
Occidental Petroleum Corp.
Panhandle Oil & Gas Inc.
Par Pacific Holdings Inc.
Parsley Energy Inc.
PBF Energy Inc.
PDC Energy Inc.
PEDEVCO Corp.
Penn Virginia Corp.
Petrolia Energy Corp.
PetroQuest Energy Inc.
Phillips 66
Pioneer Natural Resources Co.
QEP Resources Inc.
Range Resources Corp.
Resolute Energy Corp.
Rex Energy Corp.
Ring Energy Inc.
Rosehill Resources Inc.
Royale Energy Inc.
RSP Permian Inc.
Sanchez Energy Corp.
SandRidge Energy Inc.
SilverBow Resources Inc.
SM Energy Co.
Southwestern Energy Co.
Spindletop Oil & Gas Co.
SRC Energy Inc.
Stone Energy Corp.
T-Rex Oil Inc.
Tengasco Inc.
Tiger Oil and Energy Inc.
Titan Energy LLC
Torchlight Energy Resources Inc.
Transatlantic Petroleum Ltd.
U.S. Energy Corp.
Ultra Petroleum Corp.
Unit Corp.
Vaalco Energy Inc.
Valero Energy Corp.
Vanguard Natural Resources Inc.
Viper Energy Partners LP
W&T Offshore Inc.
West Texas Resources Inc.
Whiting Petroleum Corp.
WildHorse Resource Development Corp.
WPX Energy Inc.
Yuma Energy Inc.
Zion Oil & Gas Inc.
List of Organizations Mentioned in the Report:
Alberta Land Surveyor’s Association
Association of Energy Service Companies (US)
Canadian Renewable Energy Association
Canadian Society for Unconventional Resources (CSUR)
Canadian Society of Exploration Geophysicists
Canadian Society of Petroleum Geologists
Canadian Well Logging Society
Clean Resource Innovation Network (CRIN)
Explorers and Producers Association of Canada (EPAC)
Gas Processing Association Canada
Independent Contractors and Businesses Association of British Columbia (ICBA)
International Association of Drilling Contractors (US)
International Energy Agency
International Renewable Energy Agency (IRENA)
Maritimes Energy Association
National Energy Board
Natural Resources Canada (NRCan)
Newfoundland Ocean Industries Association (NOIA)
Northern Offshore Federation (UK)
Offshore Contractors’ Association Online (UK)
Ontario Petroleum Institute
Petroleum Equipment Suppliers Association (US)
Petroleum Services Association of Canada
Petroleum Technology Alliance of Canada (PTAC)
Society of Petroleum Engineers – Calgary Section
Society of Petroleum Engineers – Canada Region
The World Renewable Energy Association (WoREA)
US EIA
World Bank
World Energy Council
World Petroleum Council