Visiongain has calculated that the Automatic Passenger Counting & Information System Market will see a total expenditure of $4,269 mn in 2017, including both Automatic Passenger Counting AND Information Systems.
Read on to discover the potential business opportunities available.
Rising demand for real-time transit information coupled with favourable government regulations is anticipated to drive market growth over the forecast period.
An Automated Passenger Counter (APC) is an electronic device available for installation on transit vehicles including buses and rail vehicles which accurately records boarding and alighting data. An information system is a software that helps you organize and analyse data. This makes it possible to answer questions and solve problems relevant to the mission of an organization.
These systems are increasingly being used in various modes of transportation due to associated benefits, thus driving the automated passenger counting and information system market growth. The bus & railway operators are keen to regulate passenger travelling patterns in order to schedule timely bus and railway arrivals & departures and design routes accordingly. These patterns also help in the business development and optimize operational costs.
Healthy economic growth and growing urbanization particularly in the developing economies of the Asia Pacific and Latin America is driving market growth. Favourable government initiatives and strict government regulations such as the prerequisite of ridership data from transit workers on a standard basis are also encouraging the use of automatic passenger counting and information systems.
Industry participants are investing heavily in developing systems suitable to match intricate application necessities. The rising need for evidence of the passengers transported is a key factor anticipated to bolster market growth significantly over the next ten years. Data from automatic passenger counting can benefit companies with respect to the remuneration share from the authorities. It can be further used to draw conclusions and make aligned decisions while planning vehicle operations.
Visiongain’s Automatic Passenger Counting & Information System Market report can keep you informed and up to date with the developments in the Market in Australia, North America, Europe, Asia Pacific, Latin America, The Middle East and Africa.
The report will answer questions such as:
– How is the Automatic Passenger Counting & Information System market evolving?
– What is driving and restraining the Automatic Passenger Counting & Information System market dynamics?
– Which trends and developments will prevail?
– How will the market shares of the regional markets change by 2027 and which geographical region will lead the market in 2027?
– Who are the leading players and what are their prospects over the forecast period?
Five Reasons Why You Must Order and Read This Report Today:
1) The report provides Global Automatic Passenger Counting & Information System Market By Type:
– Automatic passenger counting
– Information system
2) The report provides Global Automatic Passenger Counting & Information System Market By Component:
– Multimedia displays
– Sensors
– Networking & communication devices
– Others (particularly includes public announcement systems)
3) The report provides Global Automatic Passenger Counting & Information System Market By Application:
– Railways
– Roadways
– Others (particularly includes aviation)
4) The report provides Global Automatic Passenger Counting & Information System Market By Region:
– North America (U.S. & Canada)
– Europe (UK, Germany, France, Italy & Spain)
– Asia Pacific (China, India, Japan & Korea)
– Latin America (Brazil & Mexico)
– Middle East & Africa (Saudi Arabia & UAE)
5) The report provides detailed profiles of the leading companies operating within the Automatic Passenger Counting & Information System Market:
– General Electric (GE)
– Siemens AG
– Hitachi Ltd
– Huawei Technologies Co.
– Cisco Systems
– DIALAX Intelcom GmbH
– Iris-GmbH
– HELLA Aglaia
– Eurotech S.p.A.
– Syncromatics Corp.
This independent 172-page report guarantees you will remain better informed than your competitors. With 173 tables and figures examining the Automatic Passenger Counting & Information System Market space, the report gives you a direct, detailed breakdown of the market.
This report is essential reading for you or anyone in the Automatic Passenger Counting & Information System sector. Purchasing this report today will help you to recognise those important market opportunities and understand the possibilities there. I look forward to receiving your order.
Visiongain is a trading partner with the US Federal Government
CCR Ref number: KD4R6
1. Report Overview
1.1 Global Automatic Passenger Counting & Information System Market Overview
1.2 Why You Should Read This Report
1.3 How This Report Delivers
1.4 Key Questions Answered By This Analytical Report Include
1.5 Who is this report for?
1.6 Methodology
1.7 Frequently Asked Questions (FAQ)
1.8 Associated Visiongain Reports
1.9 About Visiongain
2. Introduction to the Automatic Passenger Counting & Information System Market
2.1 Automatic Passenger Counting & Information System Market Structure
2.2 Automatic Passenger Counting & Information System Market Definition
2.3 Automatic Passenger Counting & Information System Submarkets Definition
2.3.1 Type Definition
2.3.2 Component Definition
2.3.3 Application Definition
3. Global Automatic Passenger Counting & Information System Market 2017-2027
3.1 Global Automatic Passenger Counting & Information System Market Forecast 2017-2027
3.2 Global Automatic Passenger Counting & Information System Drivers & Restraints 2017
3.2.1 Global Automatic Passenger Counting & Information System Market Drivers 2017
3.2.2 Global Automatic Passenger Counting & Information System Market Restraints 2017
4. Global Automatic Passenger Counting & Information System Type Forecast 2017-2027
4.1. Global Automatic Passenger Counting & Information System Type
5. Global Automatic Passenger Counting & Information System Component Forecast 2017-2027
5.1 Global Automatic Passenger Counting & Information System Component
6. Global Automatic Passenger Counting & Information System Application Forecast 2017-2027
6.1 Global Automatic Passenger Counting & Information System Application
7.Global Automatic Passenger Counting & Information System Regional Forecast 2017-2027
7.1 North America
7.1.1 U.S.
7.1.2 Canada
7.2 Europe
7.2.1 UK
7.2.2 Germany
7.2.3 France
7.2.4 Italy
7.2.5 Spain
7.3 Asia Pacific
7.3.1 China
7.3.2 India
7.3.3 Japan
7.3.4 Korea
7.4 Latin America
7.4.1 Brazil
7.4.2 Mexico
7.5 The Middle East & Africa
7.5.1 Saudi Arabia
7.5.2 UAE
8. SWOT Analysis of the Automatic Passenger Counting & Information System Market 2017-2027
8.1 SWOT Analysis
9. Porter's Analysis of the Automatic Passenger Counting & Information System Market 2017-2027
9.1 Porter's Analysis
10. PEST Analysis of the Automatic Passenger Counting & Information System Market 2017-2027
10.1 PEST Analysis
11. Leading Companies Automatic Passenger Counting & Information System Market
11.1 General Electric (GE)
11.1.1 Company Overview
11.1.2 Involvement in the Market
11.1.2.1 Financial Analysis
11.1.3 Segmental & Regional Analysis
11.1.4 Research & Development Expense
11.2 Siemens AG
11.2.1 Company Overview
11.2.2 Involvement in the Market
11.2.2.1 Financial Analysis
11.2.3 Segmental Analysis
11.2.4 Research & Development Expense
11.3 Hitachi Ltd.
11.3.1 Company Overview
11.3.2 Involvement in the Market
11.3.2.1 Financial Analysis
11.3.3 Segmental and Regional Analysis
11.4 Huawei Technologies Co., Ltd
11.4.1 Company overview
11.4.2 Involvement in the Market
11.4.2.1 Financial Analysis
11.4.3 Segmental & Regional Analysis
11.4.4 Research & Development Expense
11.5 Cisco Systems
11.5.1 Company Overview
11.5.2 Involvement in the Market
11.5.2.1 Financial Analysis
11.5.3 Segmental & Regional Analysis
11.5.4 Research & Development Expense
11.6 DIALAX Intelcom GmbH (GERMANY)
11.6.1 Company overview
11.6.2 Involvement in the Market
11.7 Iris-GmbH
11.7.1 Company Overview
11.7.2 Involvement in the Market
11.7.2.1 Company’s Product Portfolio
11.8 HELLA Aglaia (HELLA Aglaia Mobile Vision GmbH)
11.8.1 Company Overview
11.8.2 Involvement in the Market
11.8.2.1 Financial Analysis
11.8.2.2 Company’s Product Portfolio
11.8.3 Segmental & Regional Analysis
11.8.4 Research & Development Expense
11.9 Eurotech S.p.A.
11.9.1 Company Overview
11.9.2 Involvement in the Market
11.9.2.1 Financial Analysis
11.9.2.2 Company’s Product Portfolio
11.9.3 Segmental & Regional Analysis
11.10 Syncromatics Corp.
11.10.1 Company Overview
11.10.2 Involvement in the Market
11.10.2.1 Company’s Product Portfolio
11.11 CLEVER DEVICES L.T.D (U.S)
11.11.1 Company overview
11.11.2 Involvement in the Market
11.11.2.1 Company’s Product Portfolio
11.12 Retail Sensing Ltd.
11.12.1 Company Overview
11.12.2 Involvement in the Market
11.12.2.1 Company’s Product Portfolio
11.13 init innovation in traffic systems AG
11.13.1 Company Overview
11.13.2 Involvement in the Market
11.13.2.1 Financial Analysis
11.13.3 Regional Analysis
11.13.4 Research & Development Expense
11.14 Trapeze Group
11.14.1 Company Overview
11.15 Infodev Electronic Designers international Inc. (Canada)
11.15.1 Company overview
11.16 Other Companies Involved in the Automatic Passenger Counting & Information System Market 2017
12. Conclusions and Recommendations
12.1 Key Findings
12.2 Recommendations
13. Glossary
Appendix
Associated Visiongain Reports
Visiongain Report Sales Order Form
Appendix A
Appendix B
Visiongain Report Evaluation Form
List of Tables
Table 1. Automatic Passenger Counting & Information System Market by Regional Market Forecast 2017-2027 (US$m, AGR %, Cumulative)
Table 2. Global Automatic Passenger Counting & Information System Market Forecast 2017-2027 (US$m, AGR %, CAGR %)
Table 3. Global Automatic Passenger Counting & Information System Market Drivers & Restraints 2017
Table 4. Global Automatic Passenger Counting & Information System Type Forecast 2017-2027 (US$m, AGR %, Cumulative)
Table 5. Global Automatic Passenger Counting & Information System Component Forecast 2017-2027 (US$m, AGR %, CAGR %)
Table 6. Global Automatic Passenger Counting & Information System Application Forecast 2017-2027 (US$m, AGR %, CAGR %)
Table 7 Global Automatic Passenger Counting & Information System Submarkets CAGR Forecast 2017-2022, 2022-2027, 2017-2027 (CAGR %)
Table 8. Global Automatic Passenger Counting & Information System By Regions CAGR Forecast (CAGR %)
Table 9. Global Automatic Passenger Counting & Information System Market by Region Market CAGR Forecast 2017-2022, 2022-2027, 2017-2027 (CAGR %)
Table 10. North America Automatic Passenger Counting & Information System Market Forecast by Type 2017-2027 (US$m, AGR %, Cumulative)
Table 11. North America Automatic Passenger Counting & Information System Market Forecast by Component 2017-2027 (US$m, AGR %, Cumulative)
Table 12. North America Automatic Passenger Counting & Information System Market Forecast by Application 2017-2027 (US$m, AGR %, Cumulative)
Table 13. U.S. Automatic Passenger Counting & Information System Market Forecast by Type 2017-2027 (US$m, AGR %, Cumulative)
Table 14. U.S. Automatic Passenger Counting & Information System Market Forecast by Component 2017-2027 (US$m, AGR %, Cumulative)
Table 15. U.S. Automatic Passenger Counting & Information System Market Forecast by Application 2017-2027 (US$m, AGR %, Cumulative)
Table 16. Canada Automatic Passenger Counting & Information System Market Forecast by Type 2017-2027 (US$m, AGR %, Cumulative)
Table 17. Canada Automatic Passenger Counting & Information System Market Forecast by Component 2017-2027 (US$m, AGR %, Cumulative)
Table 18. Canada Automatic Passenger Counting & Information System Market Forecast by Application 2017-2027 (US$m, AGR %, Cumulative)
Table 19. Europe Automatic Passenger Counting & Information System Market Forecast by Type 2017-2027 (US$m, AGR %, Cumulative)
Table 20. Europe Automatic Passenger Counting & Information System Market Forecast by Component 2017-2027 (US$m, AGR %, Cumulative)
Table 21. Europe Automatic Passenger Counting & Information System Market Forecast by Application 2017-2027 (US$m, AGR %, Cumulative)
Table 22. UK Automatic Passenger Counting & Information System Market Forecast by Type 2017-2027 (US$m, AGR %, Cumulative)
Table 23. UK Automatic Passenger Counting & Information System Market Forecast by Component 2017-2027 (US$m, AGR %, Cumulative)
Table 24. UK Automatic Passenger Counting & Information System Market Forecast by Application 2017-2027 (US$m, AGR %, Cumulative)
Table 25. Germany Automatic Passenger Counting & Information System Market Forecast by Type 2017-2027 (US$m, AGR %, Cumulative)
Table 26. Germany Automatic Passenger Counting & Information System Market Forecast by Component 2017-2027 (US$m, AGR %, Cumulative)
Table 27. Germany Automatic Passenger Counting & Information System Market Forecast by Application 2017-2027 (US$m, AGR %, Cumulative)
Table 28. France Automatic Passenger Counting & Information System Market Forecast by Type 2017-2027 (US$m, AGR %, Cumulative)
Table 29. France Automatic Passenger Counting & Information System Market Forecast by Component 2017-2027 (US$m, AGR %, Cumulative)
Table 30. France Automatic Passenger Counting & Information System Market Forecast by Application 2017-2027 (US$m, AGR %, Cumulative)
Table 31. Italy Automatic Passenger Counting & Information System Market Forecast by Type 2017-2027 (US$m, AGR %, Cumulative)
Table 32. Italy Automatic Passenger Counting & Information System Market Forecast by Component 2017-2027 (US$m, AGR %, Cumulative)
Table 33. Italy Automatic Passenger Counting & Information System Market Forecast by Application 2017-2027 (US$m, AGR %, Cumulative)
Table 34. Spain Automatic Passenger Counting & Information System Market Forecast by Type 2017-2027 (US$m, AGR %, Cumulative)
Table 35. Spain Automatic Passenger Counting & Information System Market Forecast by Component 2017-2027 (US$m, AGR %, Cumulative)
Table 36. Spain Automatic Passenger Counting & Information System Market Forecast by Application 2017-2027 (US$m, AGR %, Cumulative)
Table 37. Asia Pacific Automatic Passenger Counting & Information System Market Forecast by Type 2017-2027 (US$m, AGR %, Cumulative)
Table 38. Asia Pacific Automatic Passenger Counting & Information System Market Forecast by Component 2017-2027 (US$m, AGR %, Cumulative)
Table 39. Asia Pacific Automatic Passenger Counting & Information System Market Forecast by Application 2017-2027 (US$m, AGR %, Cumulative)
Table 40. China Automatic Passenger Counting & Information System Market Forecast by Type 2017-2027 (US$m, AGR %, Cumulative)
Table 41. China Automatic Passenger Counting & Information System Market Forecast by Component 2017-2027 (US$m, AGR %, Cumulative)
Table 42. China Automatic Passenger Counting & Information System Market Forecast by Application 2017-2027 (US$m, AGR %, Cumulative)
Table 43. India Automatic Passenger Counting & Information System Market Forecast by Type 2017-2027 (US$m, AGR %, Cumulative)
Table 44. India Automatic Passenger Counting & Information System Market Forecast by Component 2017-2027 (US$m, AGR %, Cumulative)
Table 45. India Automatic Passenger Counting & Information System Market Forecast by Application 2017-2027 (US$m, AGR %, Cumulative)
Table 46. Japan Automatic Passenger Counting & Information System Market Forecast by Type 2017-2027 (US$m, AGR %, Cumulative)
Table 47. Japan Automatic Passenger Counting & Information System Market Forecast by Component 2017-2027 (US$m, AGR %, Cumulative)
Table 48. Japan Automatic Passenger Counting & Information System Market Forecast by Application 2017-2027 (US$m, AGR %, Cumulative)
Table 49. South Korea Automatic Passenger Counting & Information System Market Forecast by Type 2017-2027 (US$m, AGR %, Cumulative)
Table 50. South Korea Automatic Passenger Counting & Information System Market Forecast by Component 2017-2027 (US$m, AGR %, Cumulative)
Table 51. South Korea Automatic Passenger Counting & Information System Market Forecast by Application 2017-2027 (US$m, AGR %, Cumulative)
Table 52. Latin America Automatic Passenger Counting & Information System Market Forecast by Type 2017-2027 (US$m, AGR %, Cumulative)
Table 53. Latin America Automatic Passenger Counting & Information System Market Forecast by Component 2017-2027 (US$m, AGR %, Cumulative)
Table 54. Latin America Automatic Passenger Counting & Information System Market Forecast by Application 2017-2027 (US$m, AGR %, Cumulative)
Table 55. Brazil Automatic Passenger Counting & Information System Market Forecast by Type 2017-2027 (US$m, AGR %, Cumulative)
Table 56. Brazil Automatic Passenger Counting & Information System Market Forecast by Component 2017-2027 (US$m, AGR %, Cumulative)
Table 57. Brazil Automatic Passenger Counting & Information System Market Forecast by Application 2017-2027 (US$m, AGR %, Cumulative)
Table 58. Mexico Automatic Passenger Counting & Information System Market Forecast by Type 2017-2027 (US$m, AGR %, Cumulative)
Table 59. Mexico Automatic Passenger Counting & Information System Market Forecast by Component 2017-2027 (US$m, AGR %, Cumulative)
Table 60. Mexico Automatic Passenger Counting & Information System Market Forecast by Application 2017-2027 (US$m, AGR %, Cumulative)
Table 61. Middle East & Africa Automatic Passenger Counting & Information System Market Forecast by Type 2017-2027 (US$m, AGR %, Cumulative)
Table 62. Middle East & Africa Automatic Passenger Counting & Information System Market Forecast by Component 2017-2027 (US$m, AGR %, Cumulative)
Table 63. Middle East & Africa Automatic Passenger Counting & Information System Market Forecast by Application 2017-2027 (US$m, AGR %, Cumulative)
Table 64. Saudi Arabia Automatic Passenger Counting & Information System Market Forecast by Type 2017-2027 (US$m, AGR %, Cumulative)
Table 65. Saudi Arabia Automatic Passenger Counting & Information System Market Forecast by Component 2017-2027 (US$m, AGR %, Cumulative)
Table 66. Saudi Arabia Automatic Passenger Counting & Information System Market Forecast by Application 2017-2027 (US$m, AGR %, Cumulative)
Table 67. UAE Automatic Passenger Counting & Information System Market Forecast by Type 2017-2027 (US$m, AGR %, Cumulative)
Table 68. UAE Automatic Passenger Counting & Information System Market Forecast by Component 2017-2027 (US$m, AGR %, Cumulative)
Table 69. UAE Automatic Passenger Counting & Information System Market Forecast by Application 2017-2027 (US$m, AGR %, Cumulative)
Table 70. Global Automatic Passenger Counting & Information System Market SWOT Analysis 2017-2027
Table 71. Company Profile – General Electric (GE) Including Established Year, Company Address, Telephone, Website, Number of Employees, Industry, Geographic Operation and Product and Solutions
Table 72. Company Profile – Siemens AG Including Established Year, Company Address, Telephone, Website, Number of Employees, Industry, Geographic Operation and Product and Solutions
Table 73. Company Profile – Hitachi Ltd. Including Established Year, Company Address, Telephone, Website, Number of Employees, Industry, Geographic Operation and Product and Solutions
Table 74. Company Profile – Huawei Technologies Co., Ltd Including Established Year, Company Address, Telephone, Website, Number of Employees, Industry, Geographic Operation and Business Segment
Table 75. Company Profile – Cisco Systems Including Established Year, Company Address, Telephone, Website, Number of Employees, Industry, Geographic Operation and Product and Solutions
Table 76. Company Profile – DIALAX Intelcom GmbH (GERMANY) Including Established Year, Company Address, Telephone, Website, Number of Employees, Industry, Geographic Operation and Product and Solutions
Table 77. Company Profile – Iris-GmbH Including Established Year, Company Address, Telephone, Website, Number of Employees, Industry, Geographic Operation and Product and Solutions
Table 78. Company Profile – HELLA Aglaia (HELLA Aglaia Mobile Vision GmbH) Including Established Year, Company Address, Telephone, Website, Number of Employees, Industry, Geographic Operation and Product and Solutions
Table 79. Company Profile – Eurotech S.p.A. Including Established Year, Company Address, Telephone, Website, Number of Employees, Industry, Geographic Operation and Product and Solutions
Table 80. Company Profile – Syncromatics Corp. Including Established Year, Company Address, Telephone, Website, Number of Employees, Industry, Geographic Operation and Product and Solutions
Table 81. Company Profile – CLEVER DEVICES L.T.D (U.S) Including Established Year, Company Address, Telephone, Website, Key Executives, Number of Employees, Industry, Geographic Operation and Product and Solutions
Table 82. Company Profile – Retail Sensing Ltd. Including Established Year, Company Address, Telephone, Website, Number of Employees, Company Management, Industry, Geographic Operation and Product and Solutions
Table 83. Company Profile – init innovation in traffic systems AG Including Established Year, Company Address, Telephone, Website, Number of Employees, Company Management, Industry, Geographic Operation and Product and Solutions
Table 84. Company Profile – Trapeze Group Including Established Year, Company Address, Telephone, Website, Number of Employees, Company Management, Industry, Geographic Operation and Product and Solutions
Table 85. Company Profile – Infodev Electronic Designers International Inc. (Canada) Including Established Year, Company Address, Telephone, Website, Number of Employees, Industry, Geographic Operation and Product and Solutions
Table 86. Other Companies Involved in the Automatic Passenger Counting & Information System Market 2017 (Company, Submarket Involvement, Location)
List of Figures
Figure 1. Global Automatic Passenger Counting & Information System Market Segmentation Overview
Figure 2. Global Automatic Passenger Counting & Information System Market Forecast 2017-2027 (US$m)
Figure 3. Global Automatic Passenger Counting & Information System Type AGR Forecast 2017-2027 (AGR %)
Figure 4. Global Automatic Passenger Counting & Information System Type Share Forecast 2017 (% Share)
Figure 5. Global Automatic Passenger Counting & Information System Type Share Forecast 2022 (% Share)
Figure 6. Global Automatic Passenger Counting & Information System Type Share Forecast 2027 (% Share)
Figure 7. Global Automatic Passenger Counting & Information System Market Forecast by Type Market 2017-2027 (US$m, Global AGR %)
Figure 8. Global Automatic Passenger Counting & Information System Component AGR Forecast 2017-2027 (AGR %)
Figure 9. Global Automatic Passenger Counting & Information System Component Share Forecast 2017 (% Share)
Figure 10. Global Automatic Passenger Counting & Information System Component Share Forecast 2022 (% Share)
Figure 11. Global Automatic Passenger Counting & Information System Component Share Forecast 2027 (% Share)
Figure 12. Global Automatic Passenger Counting & Information System Market Forecast by Component Market 2017-2027 (US$m, Global AGR %)
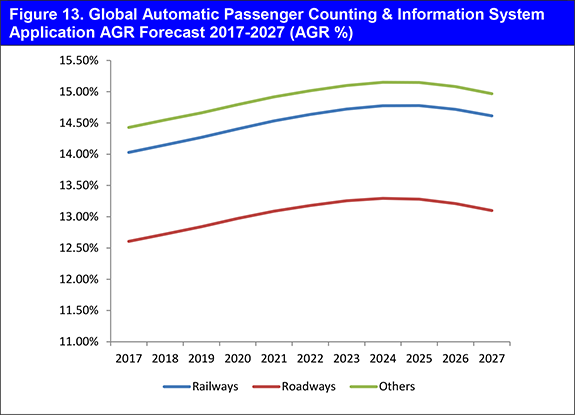
Figure 13. Global Automatic Passenger Counting & Information System Application AGR Forecast 2017-2027 (AGR %)
Figure 14. Global Automatic Passenger Counting & Information System Application Share Forecast 2017 (% Share)
Figure 15. Global Automatic Passenger Counting & Information System Application Share Forecast 2022 (% Share)
Figure 16. Global Automatic Passenger Counting & Information System Application Share Forecast 2027 (% Share)
Figure 17. Global Automatic Passenger Counting & Information System Market Forecast by Application Market 2017-2027 (US$m, Global AGR %)
Figure 18. Global Automatic Passenger Counting & Information Systems Market by Region AGR Forecast 2017-2027 (AGR %)
Figure 19. Global Automatic Passenger Counting & Information System Market Share by Region Market Forecast 2017 (% Share)
Figure 20. Global Automatic Passenger Counting & Information System Market Share by Region Market Forecast 2022 (% Share)
Figure 21. Global Automatic Passenger Counting & Information System Market Share by Region Market Forecast 2027 (% Share)
Figure 22. North America Automatic Passenger Counting & Information System Market Forecast 2017-2027 (US$m, Global AGR %)
Figure 23. North America Automatic Passenger Counting & Information System Market Share by Region Market Forecast 2017 (% Share)
Figure 24. North America Automatic Passenger Counting & Information System Market Share by Region Market Forecast 2022 (% Share)
Figure 25. North America Automatic Passenger Counting & Information System Market Share by Region Market Forecast 2027 (% Share)
Figure 26. U.S. Automatic Passenger Counting & Information System Market Forecast 2017-2027 (US$m, Global AGR %)
Figure 27. Canada Automatic Passenger Counting & Information System Market Forecast 2017-2027 (US$m, Global AGR %)
Figure 28. Europe Automatic Passenger Counting & Information System Market Forecast 2017-2027 (US$m, Global AGR %)
Figure 29. Europe Automatic Passenger Counting & Information System Market Share by Region Market Forecast 2017 (% Share)
Figure 30. Europe Automatic Passenger Counting & Information System Market Share by Region Market Forecast 2022 (% Share)
Figure 31. Europe Automatic Passenger Counting & Information System Market Share by Region Market Forecast 2027 (% Share)
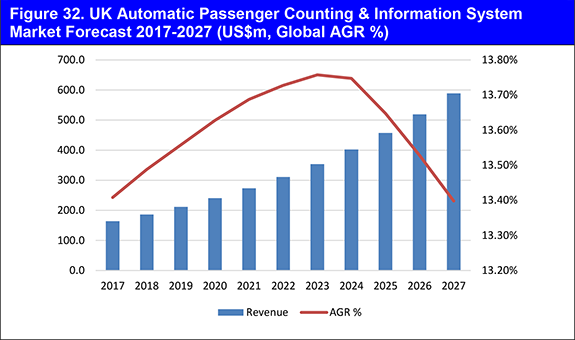
Figure 32. UK Automatic Passenger Counting & Information System Market Forecast 2017-2027 (US$m, Global AGR %)
Figure 33. Germany Automatic Passenger Counting & Information System Market Forecast 2017-2027 (US$m, Global AGR %)
Figure 34. France Automatic Passenger Counting & Information System Market Forecast 2017-2027 (US$m, Global AGR %)
Figure 35. Italy Automatic Passenger Counting & Information System Market Forecast 2017-2027 (US$m, Global AGR %)
Figure 36. Spain Automatic Passenger Counting & Information System Market Forecast 2017-2027 (US$m, Global AGR %)
Figure 37. Asia Pacific Automatic Passenger Counting & Information System Market Forecast 2017-2027 (US$m, Global AGR %)
Figure 38. Asia Pacific Automatic Passenger Counting & Information System Market Share by Region Market Forecast 2017 (% Share)
Figure 39. Asia Pacific Automatic Passenger Counting & Information System Market Share by Region Market Forecast 2022 (% Share)
Figure 40. Asia Pacific Automatic Passenger Counting & Information System Market Share by Region Market Forecast 2027 (% Share)
Figure 41. China Automatic Passenger Counting & Information System Market Forecast 2017-2027 (US$m, Global AGR %)
Figure 42. India Automatic Passenger Counting & Information System Market Forecast 2017-2027 (US$m, Global AGR %)
Figure 43. Japan Automatic Passenger Counting & Information System Market Forecast 2017-2027 (US$m, Global AGR %)
Figure 44. South Korea Automatic Passenger Counting & Information System Market Forecast 2017-2027 (US$m, Global AGR %)
Figure 45. Latin America Automatic Passenger Counting & Information System Market Forecast 2017-2027 (US$m, Global AGR %)
Figure 46. Latin America Automatic Passenger Counting & Information System Market Share by Region Market Forecast 2017 (% Share)
Figure 47. Latin America Automatic Passenger Counting & Information System Market Share by Region Market Forecast 2022 (% Share)
Figure 48. Latin America Automatic Passenger Counting & Information System Market Share by Region Market Forecast 2027 (% Share)
Figure 49. Brazil Automatic Passenger Counting & Information System Market Forecast 2017-2027 (US$m, Global AGR %)
Figure 50. Mexico Automatic Passenger Counting & Information System Market Forecast 2017-2027 (US$m, Global AGR %)
Figure 51. Middle East & Africa Automatic Passenger Counting & Information System Market Forecast 2017-2027 (US$m, Global AGR %)
Figure 52. Middle East & Africa Automatic Passenger Counting & Information System Market Share by Region Market Forecast 2017 (% Share)
Figure 53. Middle East & Africa Automatic Passenger Counting & Information System Market Share by Region Market Forecast 2022 (% Share)
Figure 54. Middle East & Africa Automatic Passenger Counting & Information System Market Share by Region Market Forecast 2027 (% Share)
Figure 55. Saudi Arabia Automatic Passenger Counting & Information System Market Forecast 2017-2027 (US$m, Global AGR %)
Figure 56. UAE Automatic Passenger Counting & Information System Market Forecast 2017-2027 (US$m, Global AGR %)
Figure 57. Porter's Analysis
Figure 58. PEST Analysis
Figure 59. General Electric (GE) Company Revenue Trend, In USD Million (2014 –2016)
Figure 60. General Electric (GE) Revenue Share by Segment– 2016 & 2015 (in %)
Figure 61. General Electric (GE) Revenue Share by Region– 2016 & 2015 (in %)
Figure 62. General Electric (GE) Research & Development Expense (2014 – 2016)
Figure 63. Siemens AG Company Revenue Trend, In USD Million (2014 –2016)
Figure 64. Siemens AG Revenue Share by Segment– 2016 & 2015 (in %)
Figure 65. Siemens AG Research & Development Expense (2014 – 2016)
Figure 66. Hitachi Ltd. Company Revenue Trend, In USD Million (2014 – 2016)
Figure 67. Hitachi Ltd. Revenue Share by Segment– 2016 & 2015 (in %)
Figure 68. Hitachi Ltd. Revenue Share by Region– 2016 & 2015 (in %)
Figure 69. Huawei Technologies Co., Ltd Company Revenue Trend, In USD Million (2014 – 2016)
Figure 70. Huawei Technologies Revenue Share by Segment– 2016 & 2015 (in %)
Figure 71. Huawei Technologies Revenue Share by Region– 2016 & 2015 (in %)
Figure 72. Huawei Technologies Research & Development Expense (2014 – 2016)
Figure 73. Cisco Systems Company Revenue Trend, In USD Million (2014 – 2016)
Figure 74. Cisco Systems Revenue Share by Segment– 2016 & 2015 (in %)
Figure 75. Cisco Systems Revenue Share by Products– 2016 & 2015 (in %)
Figure 76. Cisco Systems Revenue Share by Region– 2016 & 2015 (in %)
Figure 77. Cisco Systems Research & Development Expense (2014 – 2016)
Figure 78. HELLA Aglaia (HELLA Aglaia Mobile Vision GmbH) Company Revenue Trend, In USD Million (2014 – 2016)
Figure 79. HELLA Aglaia Revenue Share by Segment– 2016 & 2015 (in %)
Figure 80. HELLA Aglaia Revenue Share by Region– 2016 & 2015 (in %)
Figure 81. HELLA Aglaia Research & Development Expense (2014 – 2016)
Figure 82. Eurotech S.p.A. Company Revenue Trend, In USD Million (2014 – 2016)
Figure 83. Eurotech S.p.A. Revenue Share by Segment– 2016 & 2015 (in %)
Figure 84. Eurotech S.p.A. Revenue Share by Region– 2016 & 2015 (in %)
Figure 85. init innovation in traffic systems AG Company Revenue Trend, In USD Million (2014 – 2016)
Figure 86. init innovation Revenue Share by Segment– 2016 & 2015 (in %)
Figure 87. init innovation Research & Development Expense (2014 – 2016)


