SAVE $1,184.4 – Normal Price $5,131.08 by ordering here NOW*
* Departmental Licence
Amyotrophic Lateral Sclerosis (ALS)–our new study reveals trends, R&D progress, Pipeline, and predicted revenues
Where is the Amyotrophic Lateral Sclerosis (ALS) market heading? If you are involved in this sector you must read this newly updated report. Visiongain’s report shows you the potential revenues streams to 2030, assessing data, trends, opportunities and business prospects there.
Discover how to stay ahead
Our 200+ page report provides 60+ tables, 150+ charts, and graphs. Read on to discover the most lucrative areas in the industry and the future market prospects. Our new study lets you assess forecasted sales at overall world market and regional level. See financial results, trends, opportunities, and revenue predictions. Much opportunity remains in this growing Amyotrophic Lateral Sclerosis (ALS) market. See how to exploit the opportunities.
Forecasts to 2030 and other analyses reveal the commercial prospects
• In addition to revenue forecasting to 2030, our new study provides you with recent results, growth rates, and market shares.
• You find original analyses, with outlooks and developments.
• Discover qualitative analyses (including market dynamics, drivers, opportunities, restraints and challenges), material profiles and commercial developments, and Porters Five Forces.
Discover sales predictions for the world market and submarkets
Along with revenue prediction for the overall world market, there are 2 segmentations of the Amyotrophic Lateral Sclerosis (ALS) market, with forecasts for treatment and distribution channel each forecasted at a global and regional level.
To access the data contained in this document please email contactus@visiongain.com
Global Amyotrophic Lateral Sclerosis (ALS) Market by Treatment
• Medication
• Stem cell therapy
• Others
Global Amyotrophic Lateral Sclerosis (ALS) Market by Distribution Channel
• Retail Pharmacies
• Hospital Pharmacies
• Others
In addition to the revenue predictions for the overall world market and segments, you will also find revenue forecasts for 4 regional and 13 leading national markets:
• North America:
• US
• Canada
• Europe:
• Germany
• UK
• Italy
• France
• Spain
• Rest of Europe
• Asia-Pacific:
• Japan
• China
• India
• Southeast Asia
• Rest of Asia Pacific
• Rest of the World
• Top Companies
• Mitsubishi Tanabe Pharma Corporation
• Otsuka Pharmaceutical Co., Ltd
• Biogen Inc
• Corestem
• AB Science
• F.Hoffmann-La Roche AG
• Sun Pharmaceutical
• Ionis Pharmaceuticals, Inc
• Amylyx Pharmaceuticals
• BrainStorm Therapeutics
The report also includes profiles and for some of the leading companies in the Amyotrophic Lateral Sclerosis (ALS) market, with a focus on this segment of these companies’ operations.
There will be growth in both developed as well as emerging countries. Our analyses show that the both developed and developing markets, Japan, France, Japan, China in particular, will continue to achieve lucrative revenue growth to 2030.
Leading companies and the potential for market growth
Overall world revenue for Amyotrophic Lateral Sclerosis (ALS) will surpass $600 million in 2020, our work calculates. We predict strong revenue growth through to 2030. Our work identifies which organizations hold the greatest potential. Discover their capabilities, progress, and commercial prospects, helping you stay ahead.
How the Amyotrophic Lateral Sclerosis (ALS) Market report helps you
In summary, our 200+ page report provides you with the following knowledge:
• Revenue forecasts to 2030 for 2 segmentations of the Amyotrophic Lateral Sclerosis (ALS) market, with forecasts for Treatment and Distribution Channel each forecasted at a global and regional level– discover the industry’s prospects, finding the most lucrative places for investments and revenues
• Revenue forecasts to 2030 for 4 regional and 13 key national markets – See forecasts for the Amyotrophic Lateral Sclerosis (ALS) market in North America, Europe, Asia-Pacific, and Rest of the World, Also forecasted is the market in the U.S., Canada, Germany, France, UK, Italy, France, Spain, China, India, Japan, and Southeast Asia.
• Prospects for established firms and those seeking to enter the market– including company profiles for 10 of the major companies involved in the Amyotrophic Lateral Sclerosis (ALS) market
Information found nowhere else
With our newly report title, you are less likely to fall behind in knowledge or miss out on opportunities. See how our work could benefit your research, analyses, and decisions.
Visiongain’s study is for everybody needing commercial analyses for the Amyotrophic Lateral Sclerosis (ALS) market and leading companies. You will find data, trends and predictions.
To access the data contained in this document please email contactus@visiongain.com
Buy our report today Amyotrophic Lateral Sclerosis (ALS) Market Report 2020-2030: Forecasts by Treatment (Medication, Stem Cell Therapy, Others), Distribution Channel (Hospital Pharmacies, Retail Pharmacies, Others), and Geography PLUS Profiles of Leading Companies. Avoid missing out by staying informed – order our report now.
Visiongain is a trading partner with the US Federal Government
CCR Ref number: KD4R6
Do you have any custom requirements we can help you with? Any need for specific country, geo region, market segment or specific company information? Contact us today, we can discuss your needs and see how we can help: sara.peerun@visiongain.com
1 Global Amyotrophic Lateral Sclerosis (ALS) Market 2020-2030
1.1 Executive Summary
1.2 Why You Should Read This Report
1.3 What This Report Delivers
1.4 Key Questions Answered by This Analytical Report Include:
1.5 Who is This Report For?
1.6 Methodology
1.7 Frequently Asked Questions (FAQs)
1.8 Associated Visiongain Reports
1.9 About Visiongain
2 Introduction to the Amyotrophic Lateral Sclerosis (ALS) Market
2.1 Introduction to the Amyotrophic Lateral Sclerosis (ALS)
2.1.1 Symptoms
2.1.2 Diagnosis
2.2 Amyotrophic Lateral Sclerosis (ALS) Segmentation
2.2.1 Amyotrophic Lateral Sclerosis (ALS) Segmentation
2.2.2 Medication
2.2.3 Stem cell therapy
2.2.4 .Others
2.2.5 Retail Pharmacies
2.2.6 Hospital Pharmacies
2.2.7 Others
3 Industry Insights
3.1 Market Drivers
3.1.1 Increasing geriatric population
3.1.2 Increasing awareness regarding ALS support in the community
3.1.3 Increasing pipeline and research
3.2 Market Restraints/Challenges
3.2.1 Large number of failed trial candidates
3.3 Market Opportunities
3.3.1 Countries with highest ratio of geriatric population
3.4 Porter’s five forces
3.4.1 Bargaining Power of Buyers (Low)
3.4.2 Bargaining Power of Suppliers (High)
3.4.3 Threat of Substitutes
3.4.4 Threat of New Entrants
3.4.5 Industry Rivalry
4 Global Amyotrophic Lateral Sclerosis (ALS) Market by Treatment
4.1 Medication Submarket Forecast 2020-2030
4.1.1 Global ALS Market for Medication Segment: Revenue Forecast, V Shaped Recovery
4.1.2 Global ALS Market for Medication Segment: Revenue Forecast, U Shaped Recovery
4.1.3 Global ALS Market for Medication Segment: Revenue Forecast, W Shaped Recovery
4.1.4 Global ALS Market for Medication Segment: Revenue Forecast, L Shaped Recovery
4.2 Stem Cell Therapy Submarket Forecast 2020-2030
4.2.1 Global ALS Market for Stem Cell Therapy Segment: Revenue Forecast, V Shaped Recovery
4.2.2 Global ALS Market for Stem Cell Therapy Segment: Revenue Forecast, U Shaped Recovery
4.2.3 Global ALS Market for Stem Cell Therapy Segment: Revenue Forecast, W Shaped Recovery
4.2.4 Global ALS Market for Stem Cell Therapy Segment: Revenue Forecast, L Shaped Recovery
4.3 Others Submarket Forecast 2020-2030
4.3.1 Global ALS Market for Others Segment: Revenue Forecast, V Shaped Recovery
4.3.2 Global ALS Market for Others Segment: Revenue Forecast, W Shaped Recovery
4.3.3 Global ALS Market for Others Segment: Revenue Forecast, W Shaped Recovery
4.3.4 Global ALS Market for Others Segment: Revenue Forecast, L Shaped Recovery
5 Global Amyotrophic Lateral Sclerosis (ALS) Market by Distribution Channel
5.1 Hospital Pharmacies Submarket Forecast 2020-2030
5.1.1 Global ALS Market for Hospital Pharmacies Segment: Revenue Forecast, V Shaped Recovery
5.1.2 Global ALS Market for Hospital Pharmacies Segment: Revenue Forecast, U Shaped Recovery
5.1.3 Global ALS Market for Hospital Pharmacies Segment: Revenue Forecast, W Shaped Recovery
5.1.4 Global ALS Market for Hospital Pharmacies Segment: Revenue Forecast: L Shaped Recovery
5.2 Retail Pharmacies Submarket Forecast 2020-2030
5.2.1 Global ALS Market for Retail Pharmacies Segment: Revenue Forecast, V Shaped Recovery
5.2.2 Global ALS Market for Retail Pharmacies Segment: Revenue Forecast, U Shaped Recovery
5.2.3 Global ALS Market for Retail Pharmacies Segment: Revenue Forecast, W Shaped Recovery
5.2.4 Global ALS Market for Retail Pharmacies Segment: Revenue Forecast, L Shaped Recovery
5.3 Others Submarket Forecast 2020-2030
5.3.1 Global ALS Market for Others Segment: Revenue Forecast, V Shaped Recovery
5.3.2 Global ALS Market for Others Segment: Revenue Forecast, U Shaped Recovery
5.3.3 Global ALS Market for Others Segment: Revenue Forecast, W Shaped Recovery
5.3.4 Global ALS Market for Others Segment: Revenue Forecast, L Shaped Recovery
6 Regional and Leading National Amyotrophic Lateral Sclerosis (ALS) Forecasts 2020-2030
6.1 Global Amyotrophic Lateral Sclerosis (ALS) by National Market Share Forecast 2020-2030
6.2 North America Amyotrophic Lateral Sclerosis (ALS) Forecast 2020-2030
6.2.1 North America ALS Market: Revenue Forecast, V Shaped Recovery
6.2.2 North America ALS Market: Revenue Forecast, U Shaped Recovery
6.2.3 North America ALS Market: Revenue Forecast, W Shaped Recovery
6.2.4 North America ALS Market: Revenue Forecast, L Shaped Recovery
6.2.5 U.S. Amyotrophic Lateral Sclerosis (ALS) Forecast 2020-2030
6.2.5.1 U.S. ALS Market: Revenue Forecast, V Shaped Recovery
6.2.5.2 U.S. ALS Market: Revenue Forecast, U Shaped Recovery
6.2.5.3 U.S. ALS Market: Revenue Forecast, W Shaped Recovery
6.2.5.4 U.S. ALS Market: Revenue Forecast, L Shaped Recovery
6.2.6 Canada Amyotrophic Lateral Sclerosis (ALS) Forecast 2020-2030
6.2.6.1 Canada ALS Market: Revenue Forecast, V Shaped Recovery
6.2.6.2 Canada ALS Market: Revenue Forecast, U Shaped Recovery
6.2.6.3 Canada ALS Market: Revenue Forecast, W Shaped Recovery
6.2.6.4 Canada ALS Market: Revenue Forecast, L Shaped Recovery
6.3 Europe Amyotrophic Lateral Sclerosis (ALS) Forecast 2020-2030
6.3.1 Europe ALS Market: Revenue Forecast, V Shaped Recovery
6.3.2 Europe ALS Market: Revenue Forecast, U Shaped Recovery
6.3.3 Europe ALS Market: Revenue Forecast, W Shaped Recovery
6.3.4 Europe ALS Market: Revenue Forecast, L Shaped Recovery
6.3.5 Germany Amyotrophic Lateral Sclerosis (ALS) Forecast 2020-2030
6.3.5.1 Germany ALS Market: Revenue Forecast, V Shaped Recovery
6.3.5.2 Germany ALS Market: Revenue Forecast, U Shaped Recovery
6.3.5.3 Germany ALS Market: Revenue Forecast, W Shaped Recovery
6.3.5.4 Germany ALS Market: Revenue Forecast, L Shaped Recovery
6.3.6 UK Amyotrophic Lateral Sclerosis (ALS) Forecast 2020-2030
6.3.6.1 UK ALS Market: Revenue Forecast, V Shaped Recovery
6.3.6.2 UK ALS Market: Revenue Forecast, U Shaped Recovery
6.3.6.3 UK ALS Market: Revenue Forecast, W Shaped Recovery
6.3.6.4 UK ALS Market: Revenue Forecast, L Shaped Recovery
6.3.7 France Amyotrophic Lateral Sclerosis (ALS) Forecast 2020-2030
6.3.7.1 France ALS Market: Revenue Forecast, V Shaped Recovery
6.3.7.2 France ALS Market: Revenue Forecast, U Shaped Recovery
6.3.7.3 France ALS Market: Revenue Forecast, W Shaped Recovery
6.3.7.4 France ALS Market: Revenue Forecast, L Shaped Recovery
6.3.8 Spain Amyotrophic Lateral Sclerosis (ALS) Forecast 2020-2030
6.3.8.1 Spain ALS Market: Revenue Forecast, V Shaped Recovery
6.3.8.2 Spain ALS Market: Revenue Forecast, U Shaped Recovery
6.3.8.3 Spain ALS Market: Revenue Forecast, W Shaped Recovery
6.3.8.4 Spain ALS Market: Revenue Forecast, L Shaped Recovery
6.3.9 Italy Amyotrophic Lateral Sclerosis (ALS) Forecast 2020-2030
6.3.9.1 Italy ALS Market: Revenue Forecast, V Shaped Recovery
6.3.9.2 Italy ALS Market: Revenue Forecast, U Shaped Recovery
6.3.9.3 Italy ALS Market: Revenue Forecast, W Shaped Recovery
6.3.9.4 Italy ALS Market: Revenue Forecast, L Shaped Recovery
6.3.10 Rest of Europe Amyotrophic Lateral Sclerosis (ALS) Forecast 2020-2030
6.3.10.1 Rest of Europe ALS Market: Revenue Forecast, V Shaped Recovery
6.3.10.2 Rest of Europe ALS Market: Revenue Forecast, U Shaped Recovery
6.3.10.3 Rest of Europe ALS Market: Revenue Forecast, W Shaped Recovery
6.3.10.4 Rest of Europe ALS Market: Revenue Forecast, L Shaped Recovery
6.4 Asia Pacific Amyotrophic Lateral Sclerosis (ALS) Forecast 2020-2030
6.4.1 Asia Pacific ALS Market: Revenue Forecast, V Shaped Recovery
6.4.2 Asia Pacific ALS Market: Revenue Forecast, U Shaped Recovery
6.4.3 Asia Pacific ALS Market: Revenue Forecast, W Shaped Recovery
6.4.4 Japan Amyotrophic Lateral Sclerosis (ALS) Forecast 2020-2030
6.4.4.1 Japan ALS Market: Revenue Forecast, V Shaped Recovery
6.4.4.2 Japan ALS Market: Revenue Forecast, U Shaped Recovery
6.4.4.3 Japan ALS Market: Revenue Forecast, W Shaped Recovery
6.4.4.4 Japan ALS Market: Revenue Forecast, L Shaped Recovery
6.4.5 China Amyotrophic Lateral Sclerosis (ALS) Forecast 2020-2030
6.4.5.1 China ALS Market: Revenue Forecast, V Shaped Recovery
6.4.5.2 China ALS Market: Revenue Forecast, U Shaped Recovery
6.4.5.3 China ALS Market: Revenue Forecast, W Shaped Recovery
6.4.5.4 China ALS Market: Revenue Forecast, L Shaped Recovery
6.4.6 India Amyotrophic Lateral Sclerosis (ALS) Forecast 2020-2030
6.4.6.1 India ALS Market: Revenue Forecast, V Shaped Recovery
6.4.6.2 India ALS Market: Revenue Forecast, U Shaped Recovery
6.4.6.3 India ALS Market: Revenue Forecast, W Shaped Recovery
6.4.6.4 India ALS Market: Revenue Forecast, L Shaped Recovery
6.4.7 Southeast Asia Amyotrophic Lateral Sclerosis (ALS) Forecast 2020-2030
6.4.7.1 Southeast Asia ALS Market: Revenue Forecast, V Shaped Recovery
6.4.7.2 Southeast Asia ALS Market: Revenue Forecast, U Shaped Recovery
6.4.7.3 Southeast Asia ALS Market: Revenue Forecast, W Shaped Recovery
6.4.7.4 Southeast Asia ALS Market: Revenue Forecast, L Shaped Recovery
6.4.8 Rest of APAC Amyotrophic Lateral Sclerosis (ALS) Forecast 2020-2030
6.4.8.1 Rest of Asia Pacific ALS Market: Revenue Forecast, V Shaped Recovery
6.4.8.2 Rest of Asia Pacific ALS Market: Revenue Forecast, U Shaped Recovery
6.4.8.3 Rest of Asia Pacific ALS Market: Revenue Forecast, W Shaped Recovery
6.4.8.4 Rest of Asia Pacific ALS Market: Revenue Forecast, L Shaped Recovery
6.5 Rest of the World Amyotrophic Lateral Sclerosis (ALS) Forecast 2020-2030
6.5.1 Rest of the World ALS Market: Revenue Forecast, V Shaped Recovery
6.5.2 Rest of the World ALS Market: Revenue Forecast, U Shaped Recovery
6.5.3 Rest of the World ALS Market: Revenue Forecast, W Shaped Recovery
6.5.4 Rest of the World ALS Market: Revenue Forecast, L Shaped Recovery
7 Leading Companies in the Amyotrophic Lateral Sclerosis (ALS)
7.1 Market Share Analysis & FDA-Approved Drugs
7.1.1 Radicava (Mitsubishi Tanabe Pharma America)
7.1.2 Rilutek, (Generic)
7.1.3 Tiglutik
7.1.4 Nuedexta
7.2 Mitsubishi Tanabe Pharma Corporation
7.2.1 Total Company Sales (US$ million) 2016 –2019
7.2.2 Products / Services
7.2.3 Mergers & Acquisitions (M&A) Activity
7.3 Otsuka Pharmaceutical Co., Ltd
7.3.1 Total Company Sales (US$ million) 2016 - 2019
7.3.2 Products / Services
7.4 Biogen Inc
7.4.1 Total Company Sales (US$ million) 2016 - 2019
7.4.2 Products / Services
7.5 Corestem
7.5.1 Total Company Sales (US$ million) 2016 - 2019
7.5.2 Products / Services
7.6 AB Science
7.6.1 Total Company Sales (US$ million) 2016 - 2018
7.6.2 Products / Services
7.6.3 New Drug Approvals
7.7 F.Hoffmann-La Roche AG
7.7.1 Total Company Sales (US$ million) 2016 - 2019
7.7.2 Products / Services
7.8 Sun Pharmaceutical
7.8.1 Total Company Sales (US$ million) 2016 - 2019
7.8.2 Products / Services
7.9 Ionis Pharmaceuticals, Inc
7.9.1 Total Company Sales (US$ million) 2016 - 2019
7.9.2 Products / Services
7.9.3 New Drug Developments & Approvals
7.10 Amylyx Pharmaceuticals
7.10.1 Products / Services
7.10.2 New Drug Developments & Approvals
7.11 BrainStorm Therapeutics
7.11.1 Products / Services
7.11.2 New Drug Developments & Approvals
8 Conclusions and Recommendations
9 Glossary
Appendix A: About Visiongain
Appendix B: Visiongain report evaluation form
List of Figures
Figure 1. Global Amyotrophic Lateral Sclerosis (ALS) Revenue Forecast 2020-2030 (US $ million, AGR%)
Figure 1. Global Amyotrophic Lateral Sclerosis (ALS)Market: Revenue Forecast, V Shaped Recovery, 2020-2030
Figure 2. Global Amyotrophic Lateral Sclerosis (ALS)Market: Revenue Forecast, U Shaped Recovery, 2020-2030
Figure 3. Global Amyotrophic Lateral Sclerosis (ALS)Market: Revenue Forecast, W Shaped Recovery,2020-2030
Figure 4. Global Amyotrophic Lateral Sclerosis (ALS)Market: Revenue Forecast, L Shaped Recovery,2020-2030
Figure 5. Global Amyotrophic Lateral Sclerosis (ALS)Market Share, 2019
Figure 6. Amyotrophic Lateral Sclerosis (ALS) Segmentation,2020
Figure 7. Global Amyotrophic Lateral Sclerosis (ALS) Revenue Forecast 2020-2030 (US $ million, AGR %)
Figure 8. Global population projections by region, 2015-2025, Million
Figure 9. Global population breakdown, by Age group, 2017
Figure 10. Global life expectancy, 2006-2016
Figure 11. Global Fertility Projections 1975-2030
Figure 12. ALS SHAREABLE GRAPHICS
Figure 13. ALS Clinical Trials Phase Distribution, 2020-2030
Figure 14. Porter’s Five Forces,2020
Figure 15. Amyotrophic Lateral Sclerosis (ALS) Market by Treatment
Figure 16. Global Amyotrophic Lateral Sclerosis (ALS) Revenue Forecast 2020-2030 (US $mn)
Figure 17. Global Amyotrophic Lateral Sclerosis (ALS) Revenue Forecast 2020-2030 Treatment (%)
Figure 18. Global Medication Revenue Forecast 2020-2030 (US$ million, AGR %)
Figure 19. Global ALS Market for Medication Segment: Revenue Forecast, V Shaped Recovery, 2020-2030, (US$ million, AGR %)
Figure 20. Global ALS Market for Medication Segment: Revenue Forecast, U Shaped Recovery, 2020-2030, (US$ million, AGR %)
Figure 21. Global ALS Market for Medication Segment: Revenue Forecast, W Shaped Recovery 2020-2030, (US$ million, AGR %)
Figure 22. Global ALS Market for Medication Segment: Revenue Forecast, L Shaped Recovery
Figure 23. Global Stem Cell Therapy Revenue Forecast 2020-2030 (US$ million, AGR %)
Figure 24. Global ALS Market for Stem Cell Therapy Segment: Revenue Forecast, V Shaped Recovery (US$ million, AGR %)
Figure 25. Global ALS Market for Stem Cell Therapy Segment: Revenue Forecast, U Shaped Recovery (US$ million, AGR %)
Figure 26. Global ALS Market for Stem Cell Therapy Segment: Revenue Forecast, W Shaped Recovery (US$ million, AGR %)
Figure 27. Global ALS Market for Stem Cell Therapy Segment: Revenue Forecast, L Shaped Recovery (US$ million, AGR %)
Figure 28. Global Others Revenue Forecast 2020-2030 (US$ million, AGR %)
Figure 29. Global ALS Market for Others Segment: Revenue Forecast, V Shaped Recovery (US$ million, AGR %)
Figure 30. Global ALS Market for Others Segment: Revenue Forecast, U Shaped Recovery (US$ million, AGR %)
Figure 31. Global ALS Market for Others Segment: Revenue Forecast, W Shaped Recovery (US$ million, AGR %)
Figure 32. Global ALS Market for Others Segment: Revenue Forecast, L Shaped Recovery (US$ million, AGR %)
Figure 33. Amyotrophic Lateral Sclerosis (ALS) Market by Distribution Channel
Figure 34. Global Amyotrophic Lateral Sclerosis (ALS) Revenue Forecast 2020-2030, By Distribution Channel (%)
Figure 35. Global Amyotrophic Lateral Sclerosis (ALS) Revenue Forecast 2020-2030 Distribution Channel (%)
Figure 36. Global Hospital Pharmacies Revenue Forecast 2020-2030 (US$ million, AGR %)
Figure 37. Global ALS Market for Hospital Pharmacies Segment: Revenue Forecast, V Shaped Recovery (US$ million, AGR %)
Figure 38. Global ALS Market for Hospital Pharmacies Segment: Revenue Forecast, U Shaped Recovery (US$ million, AGR %)
Figure 39. Global ALS Market for Hospital Pharmacies Segment: Revenue Forecast, W Shaped Recovery (US$ million, AGR %)
Figure 40. Global ALS Market for Hospital Pharmacies Segment: Revenue Forecast, L Shaped Recovery (US$ million, AGR %)
Figure 41. Global Retail Pharmacies Revenue Forecast 2020-2030 (US$ million, AGR %)
Figure 42. Global ALS Market for Retail Pharmacies Segment: Revenue Forecast, V Shaped Recovery (US$ million, AGR %)
Figure 43. Global ALS Market for Retail Pharmacies Segment: Revenue Forecast, U Shaped Recovery (US$ million, AGR %)
Figure 44. Global ALS Market for Retail Pharmacies Segment: Revenue Forecast, W Shaped Recovery (US$ million, AGR %)
Figure 45. Global ALS Market for Retail Pharmacies Segment: Revenue Forecast, L Shaped Recovery (US$ million, AGR %)
Figure 46. Global Others Revenue Forecast 2020-2030 (US$ million, AGR %)
Figure 47. Global ALS Market for Others Segment: Revenue Forecast, V Shaped Recovery (US$ million, AGR %)
Figure 48. Global ALS Market for Others Segment: Revenue Forecast, U Shaped Recovery (US$ million, AGR %)
Figure 49. Global ALS Market for Others Segment: Revenue Forecast, W Shaped Recovery (US$ million, AGR %)
Figure 50. Global ALS Market for Retail Pharmacies Segment: Revenue Forecast, L Shaped Recovery (US$ million, AGR %)
Figure 51. Global Amyotrophic Lateral Sclerosis (ALS) Revenue Forecast 2020-2030 Regional (%)
Figure 52. North America Amyotrophic Lateral Sclerosis (ALS) Forecast 2020-2030 (US$ million, AGR %)
Figure 53. North America ALS Market: Revenue Forecast, V Shaped Recovery (US$ million, AGR %)
Figure 54. North America ALS Market: Revenue Forecast, U Shaped Recovery
Figure 55. North America ALS Market: Revenue Forecast, W Shaped Recovery
Figure 56. North America ALS Market: Revenue Forecast, L Shaped Recovery (US$ million, AGR %)
Figure 57. U.S. Prevalence of Amyotrophic Lateral Sclerosis (ALS), by Age
Group
Figure 58. U.S. Amyotrophic Lateral Sclerosis (ALS) Forecast 2020-2030 (US$ million, AGR %)
Figure 59. U.S.ALS Market: Revenue Forecast, V Shaped Recovery (US$ million, AGR %)
Figure 60. U.S.ALS Market: Revenue Forecast, U Shaped Recovery (US$ million, AGR %)
Figure 61. U.S.ALS Market: Revenue Forecast, W Shaped Recovery (US$ million, AGR %)
Figure 62. U.S.ALS Market: Revenue Forecast, L Shaped Recovery (US$ million, AGR %)
Figure 63. Canada Amyotrophic Lateral Sclerosis (ALS) Forecast 2020-2030 (US$ million, AGR %)
Figure 64. Canada ALS Market: Revenue Forecast, V Shaped Recovery (US$ million, AGR %)
Figure 65. Canada ALS Market: Revenue Forecast, U Shaped Recovery (US$ million, AGR %)
Figure 66. Canada ALS Market: Revenue Forecast, W Shaped Recovery (US$ million, AGR %)
Figure 67. Canada ALS Market: Revenue Forecast, L Shaped Recovery (US$ million, AGR %)
Figure 68. Europe Amyotrophic Lateral Sclerosis (ALS) Forecast 2020-2030 (US$ million, AGR %)
Figure 69. Europe ALS Market: Revenue Forecast, V Shaped Recovery (US$ million, AGR %)
Figure 70. Europe ALS Market: Revenue Forecast, U Shaped Recovery (US$ million, AGR %)
Figure 71. Europe ALS Market: Revenue Forecast, W Shaped Recovery (US$ million, AGR %)
Figure 72. Europe ALS Market: Revenue Forecast, L Shaped Recovery (US$ million, AGR %)
Figure 73. Germany Amyotrophic Lateral Sclerosis (ALS) Forecast 2020-2030 (US$ million, AGR %)
Figure 74. Germany ALS Market: Revenue Forecast, V Shaped Recovery (US$ million, AGR %)
Figure 75. Germany ALS Market: Revenue Forecast, U Shaped Recovery (US$ million, AGR %)
Figure 76. Germany ALS Market: Revenue Forecast, W Shaped Recovery (US$ million, AGR %)
Figure 77. Germany ALS Market: Revenue Forecast, L Shaped Recovery (US$ million, AGR %)
Figure 78. UK Amyotrophic Lateral Sclerosis (ALS) Forecast 2020-2030 (US$ million, AGR %)
Figure 79. UK ALS Market: Revenue Forecast, V Shaped Recovery (US$ million, AGR %)
Figure 80. UK ALS Market: Revenue Forecast, U Shaped Recovery (US$ million, AGR %)
Figure 81. UK ALS Market: Revenue Forecast, W Shaped Recovery (US$ million, AGR %)
Figure 82. UK ALS Market: Revenue Forecast, L Shaped Recovery (US$ million, AGR %)
Figure 83. France Amyotrophic Lateral Sclerosis (ALS) Forecast 2020-2030 (US$ million, AGR %)
Figure 84. France ALS Market: Revenue Forecast, V Shaped Recovery (US$ million, AGR %)
Figure 85. France ALS Market: Revenue Forecast, U Shaped Recovery (US$ million, AGR %)
Figure 86. France ALS Market: Revenue Forecast, W Shaped Recovery (US$ million, AGR %)
Figure 87. France ALS Market: Revenue Forecast, L Shaped Recovery (US$ million, AGR %)
Figure 88. Spain Amyotrophic Lateral Sclerosis (ALS) Forecast 2020-2030 (US$ million, AGR %)
Figure 89. Spain ALS Market: Revenue Forecast, V Shaped Recovery (US$ million, AGR %)
Figure 90. Spain ALS Market: Revenue Forecast, U Shaped Recovery (US$ million, AGR %)
Figure 91. Spain ALS Market: Revenue Forecast, W Shaped Recovery (US$ million, AGR %)
Figure 92. Spain ALS Market: Revenue Forecast, L Shaped Recovery (US$ million, AGR %)
Figure 93. Italy Amyotrophic Lateral Sclerosis (ALS) Forecast 2020-2030 (US$ million, AGR %)
Figure 94. Italy ALS Market: Revenue Forecast, V Shaped Recovery (US$ million, AGR %)
Figure 95. Italy ALS Market: Revenue Forecast, U Shaped Recovery (US$ million, AGR %)
Figure 96. Italy ALS Market: Revenue Forecast, W Shaped Recovery (US$ million, AGR %)
Figure 97. Italy ALS Market: Revenue Forecast, L Shaped Recovery (US$ million, AGR %)
Figure 98. Rest of Europe Amyotrophic Lateral Sclerosis (ALS) Forecast 2020-2030 (US$ million, AGR %)
Figure 99. Rest of Europe ALS Market: Revenue Forecast, V Shaped Recovery (US$ million, AGR %)
Figure 100. Rest of Europe ALS Market: Revenue Forecast, U Shaped Recovery (US$ million, AGR %)
Figure 101. Rest of Europe ALS Market: Revenue Forecast, W Shaped Recovery (US$ million, AGR %)
Figure 102. Rest of Europe ALS Market: Revenue Forecast, L Shaped Recovery (US$ million, AGR %)
Figure 103. Asia Pacific Amyotrophic Lateral Sclerosis (ALS) Forecast 2020-2030 (US$ million, AGR %)
Figure 104. Asia Pacific ALS Market: Revenue Forecast, V Shaped Recovery (US$ million, AGR %)
Figure 105. Asia Pacific ALS Market: Revenue Forecast, U Shaped Recovery (US$ million, AGR %)
Figure 106. Asia Pacific ALS Market: Revenue Forecast, W Shaped Recovery (US$ million, AGR %)
Figure 107. Asia Pacific ALS Market: Revenue Forecast, L Shaped Recovery (US$ million, AGR %)
Figure 108. Japan Amyotrophic Lateral Sclerosis (ALS) Forecast 2020-2030 (US$ million, AGR %)
Figure 109. Japan ALS Market: Revenue Forecast, V Shaped Recovery (US$ million, AGR %)
Figure 110. Japan ALS Market: Revenue Forecast, U Shaped Recovery (US$ million, AGR %)
Figure 111. Japan ALS Market: Revenue Forecast, W Shaped Recovery (US$ million, AGR %)
Figure 112. Japan ALS Market: Revenue Forecast, L Shaped Recovery (US$ million, AGR %)
Figure 113. China Amyotrophic Lateral Sclerosis (ALS) Forecast 2020-2030 (US$ million, AGR %)
Figure 114. China ALS Market: Revenue Forecast, V Shaped Recovery (US$ million, AGR %)
Figure 115. China ALS Market: Revenue Forecast, U Shaped Recovery (US$ million, AGR %)
Figure 116. China ALS Market: Revenue Forecast, W Shaped Recovery (US$ million, AGR %)
Figure 117. China ALS Market: Revenue Forecast, L Shaped Recovery (US$ million, AGR %)
Figure 118. India Amyotrophic Lateral Sclerosis (ALS) Forecast 2020-2030 (US$ million, AGR %)
Figure 119. India ALS Market: Revenue Forecast, V Shaped Recovery (US$ million, AGR %)
Figure 120. India ALS Market: Revenue Forecast, U Shaped Recovery (US$ million, AGR %)
Figure 121. India ALS Market: Revenue Forecast, W Shaped Recovery (US$ million, AGR %)
Figure 122. India ALS Market: Revenue Forecast, L Shaped Recovery (US$ million, AGR %)
Figure 123. Southeast Asia Amyotrophic Lateral Sclerosis (ALS) Forecast 2020-2030 (US$ million, AGR %)
Figure 124. Southeast Asia ALS Market: Revenue Forecast, V Shaped Recovery (US$ million, AGR %)
Figure 125. Southeast Asia ALS Market: Revenue Forecast, U Shaped Recovery (US$ million, AGR %)
Figure 126. Southeast Asia ALS Market: Revenue Forecast, W Shaped Recovery (US$ million, AGR %)
Figure 127. Southeast Asia ALS Market: Revenue Forecast, L Shaped Recovery (US$ million, AGR %)
Figure 128. Rest of APAC Amyotrophic Lateral Sclerosis (ALS) Forecast 2020-2030 (US$ million, AGR %)
Figure 129. Rest of Asia Pacific ALS Market: Revenue Forecast, V Shaped Recovery (US$ million, AGR %)
Figure 130. Rest of Asia Pacific ALS Market: Revenue Forecast, U Shaped Recovery (US$ million, AGR %)
Figure 131. Rest of Asia Pacific ALS Market: Revenue Forecast, W Shaped Recovery (US$ million, AGR %)
Figure 132. Rest of Asia Pacific ALS Market: Revenue Forecast, L Shaped Recovery (US$ million, AGR %)
Figure 133. Rest of the World Amyotrophic Lateral Sclerosis (ALS) Forecast 2020-2030 (US$ million, AGR %)
Figure 134. Rest of the World ALS Market: Revenue Forecast, V Shaped Recovery (US$ million, AGR %)
Figure 135. Rest of the World ALS Market: Revenue Forecast, U Shaped Recovery (US$ million, AGR %)
Figure 136. Rest of the World ALS Market: Revenue Forecast, W Shaped Recovery (US$ million, AGR %)
Figure 137. Rest of the World ALS Market: Revenue Forecast, L Shaped Recovery (US$ million, AGR %)
Figure 138. ALS Market Share Analysis, 2020
Figure 139. ALS Functional Rating Scale–Revised (ALSFRS-R) after 24 weeks
Figure 140. Total Company Sales (US$ million)2016 – 2019
Figure 141. Total Company Sales (US$ million) 2016 – 2019
Figure 142. Total Company Sales (US$ million) 2016 – 2019
Figure 143. Total Company Sales (US$ million) 2016 – 2019
Figure 144. Total Company Sales (US$ million)(US$ million), 2016 – 2018
Figure 145. Total Company Sales (US$ millions), 2016– 2019
Figure 146. Total Company Sales (US$ million) 2016 – 2019
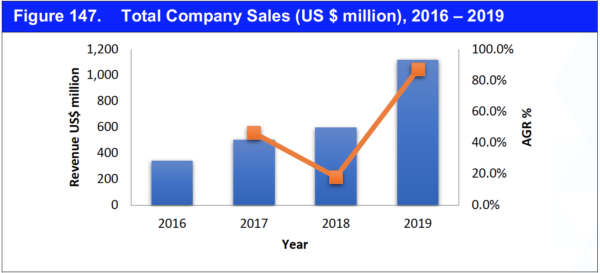
Figure 147. Total Company Sales (US $ million), 2016 – 2019
Figure 148. Products / Services
Figure 149. Products / Services
Figure 150. Global Amyotrophic Lateral Sclerosis (ALS)market, 2019-2030
Figure 151. Global Amyotrophic Lateral Sclerosis (ALS) Revenue Forecast 2020-2030 Treatment (%)
Figure 152. Global Amyotrophic Lateral Sclerosis (ALS) Revenue Forecast 2020-2030Distribution Channel (%)
List of Tables
Table 1. Executive Summary
Table 2. Global Amyotrophic Lateral Sclerosis (ALS) Revenue Forecast 2020-2030 (US $ million, AGR %, CAGR %)
Table 3. ALS clinical trials landscape,2020
Table 4. ALS Failed Trial Candidates
Table 5. Top 20 Countries With the Largest Percentage of Older Adults
Table 6. Top Countries Largest Share of People Age 65-85
Table 7. Key Factors Affecting the Bargaining Power of Buyer
Table 8. Key Factors Affecting the Bargaining Power of Suppliers
Table 9. Key Factors Affecting the Threat of Substitutes
Table 10. Key Factors Affecting the Threat of New Entrants
Table 11. Key Factors Affecting the Industry Rivalry
Table 12. Global Amyotrophic Lateral Sclerosis (ALS) Revenue Forecast 2020-2030 Treatment (US$ million, AGR %)
Table 13. Global Medication Revenue Forecast 2020-2030 (US$ million, AGR %)
Table 14. Global Stem Cell Therapy Revenue Forecast 2020-2030 (US$ million, AGR %)
Table 15. Global Others Revenue Forecast 2020-2030 (US$ million, AGR %)
Table 16. Global Amyotrophic Lateral Sclerosis (ALS) Revenue Forecast 2020-2030 Distribution Channel (US$ million, AGR %)
Table 17. Hospital Pharmacies Revenue Forecast 2020-2030 (US$ million, AGR %)
Table 18. Global Retail Pharmacies Revenue Forecast 2020-2030 (US$ million, AGR %)
Table 19. Global Others Revenue Forecast 2020-2030 (US$ million, AGR %)
Table 20. North America Lateral Sclerosis (ALS) Revenue Forecast, by Country 2020-2030 Treatment (US$ million, AGR %)
Table 21. North America Lateral Sclerosis (ALS) Revenue Forecast 2020-2030 Treatment (US$ million, AGR %)
Table 22. North America Lateral Sclerosis (ALS) Revenue Forecast 2020-2030 Distribution Channel (US$ million, AGR %)
Table 23. U.S. Amyotrophic Lateral Sclerosis (ALS) Forecast 2020-2030 (US$ million, AGR %)
Table 24. Canada Amyotrophic Lateral Sclerosis (ALS) Forecast 2020-2030 (US$ million, AGR %)
Table 25. Europe Lateral Sclerosis (ALS) Revenue Forecast, by Country 2020-2030 Treatment (US$ million, AGR %)
Table 26. Europe Lateral Sclerosis (ALS) Revenue Forecast 2020-2030 Treatment (US$ million, AGR %)
Table 27. Europe Lateral Sclerosis (ALS) Revenue Forecast 2020-2030 Distribution Channel (US$ million, AGR %)
Table 28. Germany Amyotrophic Lateral Sclerosis (ALS) Forecast 2020-2030 (US$ million, AGR %)
Table 29. UK Amyotrophic Lateral Sclerosis (ALS) Forecast 2020-2030 (US$ million, AGR %)
Table 30. France Amyotrophic Lateral Sclerosis (ALS) Forecast 2020-2030 (US$ million, AGR %)
Table 31. Spain Amyotrophic Lateral Sclerosis (ALS) Forecast 2020-2030 (US$ million, AGR %)
Table 32. Italy Amyotrophic Lateral Sclerosis (ALS) Forecast 2020-2030 (US$ million, AGR %)
Table 33. Rest of Europe Amyotrophic Lateral Sclerosis (ALS) Forecast 2020-2030 (US$ million, AGR %)
Table 34. Asia Pacific Lateral Sclerosis (ALS) Revenue Forecast 2020-2030 Treatment (US$ million, AGR %)
Table 35. Asia Pacific Lateral Sclerosis (ALS) Revenue Forecast 2020-2030 Distribution Channel (US$ million, AGR %)
Table 36. Japan Amyotrophic Lateral Sclerosis (ALS) Forecast 2020-2030 (US$ million, AGR %)
Table 37. China Amyotrophic Lateral Sclerosis (ALS) Forecast 2020-2030 (US$ million, AGR %)
Table 38. India Amyotrophic Lateral Sclerosis (ALS) Forecast 2020-2030 (US$ million, AGR %)
Table 39. Rest of APAC Amyotrophic Lateral Sclerosis (ALS) Forecast 2020-2030 (US$ million, AGR %)
Table 40. Rest of APAC Amyotrophic Lateral Sclerosis (ALS) Forecast 2020-2030 (US$ million, AGR %)
Table 41. Rest of the World Lateral Sclerosis (ALS) Revenue Forecast 2020-2030 Treatment (US$ million, AGR %)
Table 42. Rest of the World Lateral Sclerosis (ALS) Revenue Forecast 2020-2030 Distribution Channel (US$ million, AGR %)
Table 43. Company overview
Table 44. Products / Services
Table 45. Mergers & Acquisitions (M&A) Activity
Table 46. Company overview
Table 47. Products / Services
Table 48. Company overview
Table 49. Products / Services
Table 50. Company overview
Table 51. Products / Services
Table 52. Company overview
Table 53. Products / Services
Table 54. New Drug Approvals
Table 55. Company overview
Table 56. Products / Services
Table 57. Company overview
Table 58. Products / Services
Table 59. Company overview
Table 60. Products / Services
Table 61. New Drug Developments & Approvals
Table 62. Company overview
Table 63. New Drug Developments & Approvals
Table 64. Company overview
Table 65. New Drug Developments & Approvals
 Market Report 2020-2030")


