Visiongain’s new 155 pages report assesses that the global Alpha Olefins market will reach $9.82 billion in 2017.
Are you involved in Alpha Olefins or need to understand its market dynamics? If so, then you must read this report
It’s vital that you keep your knowledge up to date. You need this report.
Market scope: This brand new report from Visiongain is a completely fresh market assessment of the Alpha Olefins market based upon the latest information. Our new market study contains forecasts, original analysis, company profiles and, most crucially, fresh conclusions. The report gives detailed forecasts and analysis of the Alpha Olefins markets by region and end-use sectors.
Alpha Olefins Market 2017-2027 report responds to your need for definitive market data:
• Where are the Alpha Olefins market opportunities?
• 156 tables, charts, and graphs reveal market data allowing you to target your strategy more effectively
• When will the Alpha Olefins market grow?
• Global, national and the Alpha Olefins submarket forecasts and analysis from 2017-2027 illustrate the market progression
• Which Alpha Olefins submarkets will flourish from 2017-2027?
• Polyethylene Submarket 2017-2027
• Detergent Alcohol Submarket 2017-2027
• Synthetic Lubricant Submarket 2017-2027
• Others Submarket 2017-2027
• 1-Butene Submarket 2017-2027
• 1-Hexene Submarket 2017-2027
• 1-Octene Submarket 2017-2027
• 1-Decene Submarket 2017-2027
• 1-Dodecene Submarket 2017-2027
• Others Submarket 2017-2027
• Where are the regional Alpha Olefins market opportunities from 2017-2027?
Focused regional forecasts and analysis explore the future opportunities
• North America forecast 2017-2027
• Europe forecast 2017-2027
• Asia Pacific forecast 2017-2027
• CSA forecast 2017-2027
• MEA forecast 2017-2027
• What are the factors influencing Alpha Olefins market dynamics?
• SWOT analysis explores the factors
• Research and development (R&D) strategy
• Supply and demand dynamics
• Advances in product quality
• Who are the leading Alpha Olefins companies?
• We reveal market share, positioning, capabilities, product portfolios, R&D activity, services, focus, strategies, M&A activity, and future outlook
• Royal Dutch Shell
• ExxonMobil Corporation
• Chevron Phillips Chemical Company
• Dow Chemical Co.
• Saudi Basic Industries Corporation
• Other companies of interest
• Idemitsu Kosan Co.
• Mitsubishi Chemical Corporation
• Qatar Chemical Company Ltd
• Sasol Limited
• INEOS Oligomers
• Who should read this report?
• Anyone within the Alpha Olefins value chain, including
• Raw material suppliers
• R&D specialists
• CEO’s
• COO’s
• CIO’s
• Business development managers
• Marketing managers
• Technologists
• Investors
• Banks
• Government agencies
• Contractors
Get our report today Alpha Olefins Market 2017-2027: Forecast by Type (1-Butene, 1-Hexene, 1-Octene, 1-Decene, 1-Dodecene), Application (Polyethylene, Detergent Alcohol, Synthetic Lubricant) plus Leading Players. Avoid missing out – order our report now.
Visiongain is a trading partner with the US Federal Government
CCR Ref number: KD4R6
1. Alpha Olefins Market Overview
1.1 Alpha Olefins Market Segmentation
1.2 Alpha Olefins Market Definition
1.3 Research Methodology
1.3.1 Primary Research
1.3.2 Secondary Research
1.3.3 Market Evaluation & Forecasting Methodology
1.4 Assumptions
1.5 Years Considered for Study
1.6 Why You Should Read This Report
1.7 How this Report Delivers
1.8 Key Questions Answered by This Analytical Report Include:
1.9 Who is This Report For?
1.10 Frequently Asked Questions (FAQ)
1.11 Associated Visiongain Reports
1.12 About Visiongain
1.13 How This Report Delivers
1.14 Key Questions Answered by This Analytical Report Include:
2. Introduction to the Alpha Olefins Market
2.1 Market Sizing and Growth Opportunity Analysis
2.2 Key Raw Material Analysis
2.3 Introduction to Alpha Olefin Technologies
2.3.1 Ethylene oligomerization processes
2.3.2 Chevron Phillips Chemicals’ Ethylene Oligomerization (Ziegler Process)
2.3.3 INEOS’ Ethylene Oligomerization (Modified Ziegler Process)
2.3.4 Shell’s Ethylene Oligomerization (Shell Higher Olefins Process - SHOP)
2.3.5 Idemitsu’s Ethylene Oligomerization Process
2.3.6 Exxon’s Ethylene Oligomerization Process
2.3.7 Dupont’s Versipol Process
2.3.8 Sabic/Linde Alpha-SABLIN Process
3. Global Alpha Olefins Market Dynamics
3.1 The Alpha Olefins Market Drivers
3.1.1 Growing end-use industries
3.1.2 Easy Availability of Key Raw Materials
3.2 The Alpha Olefins Market Restraint
3.2.1 Declining downstream demand in Europe
3.3 The Alpha Olefins Market Pricing Analysis
3.4 Alpha Olefins - Key Growth Prospects, 2017-2027
4. Global Alpha Olefins Market Region Forecast (2017-2027)
4.1 North America
4.1.1 U.S.
4.2 Europe
4.2.1 Germany
4.2.2 UK
4.3 Asia Pacific
4.3.1 China
4.3.2 India
4.4 Central and South America
4.4.1 Brazil
4.5 Middle East & Africa
4.5.1 Saudi Arabia
5. Global Alpha Olefins Market Application Forecast (2017-2027)
5.1 Introduction
5.2 Polyethylene
5.3 Detergent Alcohol
5.4 Synthetic Lubricant
5.5 Others
6. Global Alpha Olefins Market Type Forecast (2017-2027)
6.1 Introduction
6.2 1-Butene
6.3 1-Hexene
6.4 1-Octene
6.5 1-Decene
6.6 1-Dodecene
6.7 Others
7. Industry Trends
7.1 Alpha Olefins - Porter’s Five Forces Analysis
7.1.1 Bargaining Power of Suppliers:
7.1.2 Threat of New Entrants:
7.1.3 Bargaining Power of Buyers:
7.1.4 Internal Rivalry:
7.1.5 Threat of Substitute:
7.2 PESTEL Analysis
8. Leading Companies in Alpha Olefins Market
8.1 Royal Dutch Shell PLC
8.2 ExxonMobil Corporation
8.3 Chevron Phillips Chemical Company LLC
8.4 Dow Chemical Co.
8.5 Saudi Basic Industries Corporation (SABIC)
8.6 Idemitsu Kosan Co., Ltd.
8.7 Mitsubishi Chemical Corp.
8.8 Qatar Chemical Company Ltd (Q-chem)
8.9 Sasol Limited
8.10 INEOS Oligomers
9. Conclusions & Recommendations
9.1 Alpha Olefins Market Outlook
9.2 Top 3 Fastest Growing Alpha Olefins Types
9.3 Top 3 Fastest Growing Alpha Olefins Applications
9.3.1 Top 3 Fastest Growing Regional Alpha Olefins Markets
9.4 Strategic benchmarking of key players
10. Glossary
Associated Visiongain Reports
Visiongain Report Sales Order Form
Appendix A
About Visiongain
Appendix B
Visiongain report evaluation form
List of Tables
Table 1.1 Regional Alpha Olefins Markets Forecasts ($Mn, AGR%), 2017-2027
Table 4.1 Global Alpha Olefins Market by Region, Market Forecast 2017-2027 (Kilo Tons, AGR %)
Table 4.2 Global Alpha Olefins Market by Region, Market Forecast 2017-2027 (US$m, AGR %)
Table 4.3 North America Alpha Olefins Market by Type, Market Forecast 2017-2027 (Kilo Tons, AGR %)
Table 4.4 North America Alpha Olefins Market by Type, Market Forecast 2017-2027 (US$m, AGR %)
Table 4.5 North America Alpha Olefins Market by Application, Market Forecast 2017-2027 (US$m, AGR %)
Table 4.6 U.S. Alpha Olefins Market by Type, Market Forecast 2017-2027 (Kilo Tons, AGR %)
Table 4.7 U.S. Alpha Olefins Market by Type, Market Forecast 2017-2027 (US$m, AGR %)
Table 4.8 U.S. Alpha Olefins Market by Application, Market Forecast 2017-2027 (Kilo Tons, AGR %)
Table 4.9 U.S. Alpha Olefins Market by Application, Market Forecast 2017-2027 (US$m, AGR %)
Table 4.10 Europe Alpha Olefins Market by Type, Market Forecast 2017-2027 (Kilo Tons, AGR %)
Table 4.11 Europe Alpha Olefins Market by Type, Market Forecast 2017-2027 (US$m, AGR %)
Table 4.12 Europe Alpha Olefins Market by Type, Market Forecast 2017-2027 (US$m, AGR %)
Table 4.13 Europe Alpha Olefins Market by Application, Market Forecast 2017-2027 (Kilo Tons, AGR %)
Table 4.14 Europe Alpha Olefins Market by Application, Market Forecast 2017-2027 (US$m, AGR %)
Table 4.15 Germany Alpha Olefins Market by Type, Market Forecast 2017-2027 (US$m, AGR %)
Table 4.16 Germany Alpha Olefins Market by Application, Market Forecast 2017-2027 (Kilo Tons, AGR %)
Table 4.17 Germany Alpha Olefins Market by Application, Market Forecast 2017-2027 (US$m, AGR %)
Table 4.18 UK Alpha Olefins Market by Type, Market Forecast 2017-2027 (Kilo Tons, AGR %)
Table 4.19 UK Alpha Olefins Market by Type, Market Forecast 2017-2027 (US$m, AGR %)
Table 4.20 UK Alpha Olefins Market by Application, Market Forecast 2017-2027 (Kilo Tons, AGR %)
Table 4.21 UK Alpha Olefins Market by Application, Market Forecast 2017-2027 (US$m, AGR %)
Table 4.22 Asia Pacific Alpha Olefins Market by Type, Market Forecast 2017-2027 (Kilo Tons, AGR %)
Table 4.23 Asia Pacific Alpha Olefins Market by Type, Market Forecast 2017-2027 (US$m, AGR %)
Table 4.24 Asia Pacific Alpha Olefins Market by Application, Market Forecast 2017-2027 (Kilo Tons, AGR %)
Table 4.25 Asia Pacific Alpha Olefins Market by Application, Market Forecast 2017-2027 (US$m, AGR %)
Table 4.26 China Alpha Olefins Market by Type, Market Forecast 2017-2027 (US$m, AGR %)
Table 4.27 China Alpha Olefins Market by Application, Market Forecast 2017-2027 (Kilo Tons, AGR %)
Table 4.28 China Alpha Olefins Market by Application, Market Forecast 2017-2027 (US$m, AGR %)
Table 4.29 India Alpha Olefins Market by Type, Market Forecast 2017-2027 (Kilo Tons, AGR %)
Table 4.30 India Alpha Olefins Market by Type, Market Forecast 2017-2027 (US$m, AGR %)
Table 4.31 India Alpha Olefins Market by Application, Market Forecast 2017-2027 (Kilo Tons, AGR %)
Table 4.32 India Alpha Olefins Market by Application, Market Forecast 2017-2027 (US$m, AGR %)
Table 4.33 CSA Alpha Olefins Market by Type, Market Forecast 2017-2027 (Kilo Tons, AGR %)
Table 4.34 CSA Alpha Olefins Market by Type, Market Forecast 2017-2027 (US$m, AGR %)
Table 4.35 CSA Alpha Olefins Market by Application, Market Forecast 2017-2027 (Kilo Tons, AGR %)
Table 4.36 CSA Alpha Olefins Market by Application, Market Forecast 2017-2027 (US$m, AGR %)
Table 4.37 Brazil Alpha Olefins Market by Type, Market Forecast 2017-2027 (Kilo Tons, AGR %)
Table 4.38 Brazil Alpha Olefins Market by Type, Market Forecast 2017-2027 (US$m, AGR %)
Table 4.39 Brazil Alpha Olefins Market by Application, Market Forecast 2017-2027 (Kilo Tons, AGR %)
Table 4.40 Brazil Alpha Olefins Market by Application, Market Forecast 2017-2027 (US$m, AGR %)
Table 4.41 MEA Alpha Olefins Market by Type, Market Forecast 2017-2027 (Kilo Tons, AGR %)
Table 4.42 MEA Alpha Olefins Market by Type, Market Forecast 2017-2027 (US$m, AGR %)
Table 4.43 MEA Alpha Olefins Market by Application, Market Forecast 2017-2027 (Kilo Tons, AGR %)
Table 4.44 MEA Alpha Olefins Market by Application, Market Forecast 2017-2027 (US$m, AGR %)
Table 4.45 Saudi Arabia Alpha Olefins Market by Type, Market Forecast 2017-2027 (Kilo Tons, AGR %)
Table 4.46 Saudi Arabia Alpha Olefins Market by Type, Market Forecast 2017-2027 (US$m, AGR %)
Table 4.47 Saudi Arabia Alpha Olefins Market by Application, Market Forecast 2017-2027 (Kilo Tons, AGR %)
Table 4.48 Saudi Arabia Alpha Olefins Market by Application, Market Forecast 2017-2027 (US$m, AGR %)
Table 5.1 Global Alpha Olefins Market by Application, Market Forecast 2017-2027 (Kilo Tons, AGR %)
Table 5.2 Global Alpha Olefins Market by Application, Market Forecast 2017-2027 (Revenue, AGR %)
Table 5.3 Global Polyethylene Market by Region, Market Forecast 2017-2027 (Kilo Tons, AGR %)
Table 5.4 Global Polyethylene Market by Region, Market Forecast 2017-2027 (Revenue, AGR %)
Table 5.5 Global Detergent Alcohol Market by Region, Market Forecast 2017-2027 (Kilo Tons, AGR %)
Table 5.6 Global Detergent Alcohol Market by Region, Market Forecast 2017-2027 (Revenue, AGR %)
Table 5.7 Global Synthetic Lubricant Market by Region, Market Forecast 2017-2027 (Kilo Tons, AGR %)
Table 5.8 Global Synthetic Lubricant Market by Region, Market Forecast 2017-2027 (Revenue, AGR %)
Table 5.9 Global Other Alpha Olefins Market by Region, Market Forecast 2017-2027 (Revenue, AGR %)
Table 6.1 Global 1-Butene Market by Region, Market Forecast 2017-2027 (Kilo Tons, AGR %)
Table 6.2 Global 1-Butene Market by Region, Market Forecast 2017-2027 (Revenue, AGR %)
Table 6.3 Global 1-Hexene Market by Region, Market Forecast 2017-2027 (Kilo Tons, AGR %)
Table 6.4 Global 1-Octene Market by Region, Market Forecast 2017-2027 (Kilo Tons, AGR %)
Table 6.5 Global 1-Octene Market by Region, Market Forecast 2017-2027 (Revenue, AGR %)
Table 6.6 Global 1-Decene Market by Region, Market Forecast 2017-2027 (Kilo Tons, AGR %)
Table 6.7 Global 1-Decene Market by Region, Market Forecast 2017-2027 (Revenue, AGR %)
Table 6.8 Global 1-Dodecene Market by Region, Market Forecast 2017-2027 (Kilo Tons, AGR %)
Table 6.9 Global 1-Dodecene Market by Region, Market Forecast 2017-2027 (Revenue, AGR %)
Table 6.10 Global Other Alpha Olefin Type Market by Region, Market Forecast 2017-2027 (Kilo Tons, AGR %)
Table 6.11 Global Other Alpha Olefin Type Market by Region, Market Forecast 2017-2027 (Revenue, AGR %)
Table 8.1 Royal Dutch Shell PLC: Overview (2017)
Table 8.2 ExxonMobil Corporation: Overview (2017)
Table 8.3 Chevron Phillips Chemical Company LLC: Overview (2017)
Table 8.4 Dow Chemical Co.: Overview (2017)
Table 8.5 SABIC: Overview (2017)
Table 8.6 Idemitsu Kosan Co., Ltd: Overview (2017)
Table 8.7 Mitsubishi Chemical Corp: Overview (2017)
Table 8.8 Qatar Chemical Company Ltd: Overview (2017)
Table 8.9 Sasol Limited: Overview (2017)
Table 8.10 INEOS Oligomers: Overview (2017)
List of Figures
Figure 1.1 Alpha Olefins Market Forecast ($Mn, AGR%), 2017-2027
Figure 1.2 Global Alpha Olefins Market Segmentation
Figure 2.1 Regional Alpha Olefins Markets Forecasts ($Mn, AGR%), 2017-2027
Figure 3.1 Global Ethylene Production, 2008–2014 (Million Tons)
Figure 3.2 GDP and growth rates of key petrochemical producing regions in Europe, 2015 (USD Billion, Percent)
Figure 3.3 Price Trend Analysis
Figure 3.4 Key Growth Prospects, 2017-2027
Figure 4.1 Global Alpha Olefins Market by Region, 2016 v/s 2027 (Kilo Tons)
Figure 4.2 Global Alpha Olefins Market by Region, 2016 v/s 2027 (USD Million)
Figure 4.3 North America Alpha Olefins Market by Type, 2016 v/s 2027 (Kilo Tons)
Figure 4.4 North America Alpha Olefins Market by Type, 2016 v/s 2027 (USD Million)
Figure 4.5 North America Alpha Olefins Market by Application, 2016 v/s 2027 (Kilo Tons)
Figure 4.6 North America Alpha Olefins Market by Application, 2016 v/s 2027 (USD Million)
Figure 4.7 U.S. Alpha Olefins Market by Type, 2016 v/s 2027 (Kilo Tons)
Figure 4.8 U.S. Alpha Olefins Market by Application, 2016 v/s 2027 (USD Million)
Figure 4.9 Europe Alpha Olefins Market By Type, 2016 V/S 2027 (Kilo Tons)
Figure 410 Europe Alpha Olefins Market by Type, 2016 v/s 2027 (USD Million)
Figure 4.11 Europe Alpha Olefins Market by Application, 2016 v/s 2027 (Kilo Tons)
Figure 4.12 Europe Alpha Olefins Market by Application, 2016 v/s 2027 (USD Million)
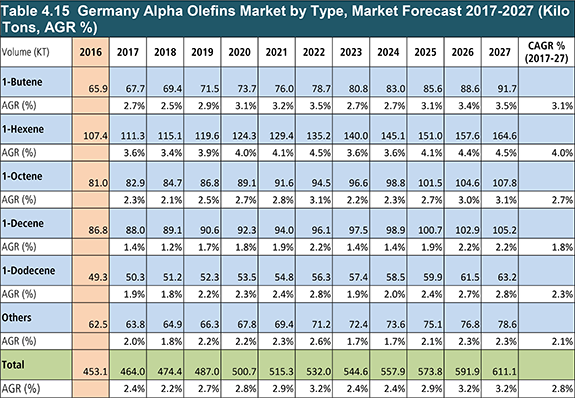
Figure 4.13 Germany Alpha Olefins Market by Type, Market Forecast 2017-2027 (Kilo Tons, AGR %)
Figure 4.14 Germany Alpha Olefins Market by Application, 2016 v/s 2027 (Kilo Tons)
Figure 4.15 UK Alpha Olefins Market by Application, 2016 v/s 2027 (Kilo Tons)
Figure 4.16 Asia Pacific Alpha Olefins Market by Type, 2016 v/s 2027 (Kilo Tons)
Figure 4.17 Asia Pacific Alpha Olefins Market by Type, 2016 v/s 2027 (USD Million)
Figure 4.18 Asia Pacific Alpha Olefins Market by Application, 2016 v/s 2027 (Kilo Tons)
Figure 4.19 Asia Pacific Alpha Olefins Market by Application, 2016 v/s 2027 (USD Million)
Figure 4.20 China Alpha Olefins Market by Type, 206 v/s 2027 (Kilo Tons)
Figure 4.21 China Alpha Olefins Market by Application, 2016 v/s 2027 (Kilo Tons)
Figure 4.22 India Alpha Olefins Market by Type, Market Forecast 2017-2027 (Kilo Tons, AGR %)
Figure 4.23 India Alpha Olefins Market by Application, 2016 v/s 2027 (Kilo Tons)
Figure 4.24 CSA Alpha Olefins Market by Application, 2016 v/s 2027 (Kilo Tons)
Figure 4.25 CSA Alpha Olefins Market by Type 2016 v/s 2027 (Kilo Tons)
Figure 4.26 CSA Alpha Olefins Market by Application, 2016 v/s 2027 (USD Million)
Figure 4.27 Brazil Alpha Olefins Market by Type, 2016 v/s 2027 (Kilo Tons)
Figure 4.28 Brazil Alpha Olefins Market by Application, 2016 v/s 2027 (Kilo Tons)
Figure 4.29 MEA Alpha Olefins Market by Type, 2016 v/s 2027 (Kilo Tons)
Figure 4.30 MEA Alpha Olefins Market by Type, 2016 v/s 2027 (USD Million)
Figure 4.31 MEA Alpha Olefins Market by Application, 2016 v/s 2027 (Kilo Tons)
Figure 4.32 MEA Alpha Olefins Market by Application, 2016 v/s 2027 (USD Million)
Figure 4.33 Saudi Arabia Alpha Olefins Market by Type, 2016 v/s 2027 (Kilo Tons)
Figure 4.34 Saudi Arabia Alpha Olefins Market by Application, 2016 v/s 2027 (Kilo Tons)
Figure 5.1 Global Alpha Olefins Market by Application, 2016 v/s 2027 (Kilo Tons)
Figure 5.2 Global Alpha Olefins Market by Application, 2016 v/s 2027 (USD Million)
Figure 5.3 Global Polyethylene Market by Region, 2016 v/s 2027 (Kilo Tons)
Figure 5.4 Global Polyethylene Market by Region, 2016 v/s 2027 ($ Million)
Figure 5.5 Global Detergent Alcohol Market by Region, 2016 v/s 2027 (Kilo Tons)
Figure 5.6 Global Detergent Alcohol Market by Region, 2016 v/s 2027 (USD Million)
Figure 5.7 Global Synthetic Lubricant Market by Region, 2016 v/s 2027 (Kilo Tons)
Figure 5.8 Global Synthetic Lubricant Market by Region, 2016 v/s 2027 (USD Million)
Table 5.9 Global Other Alpha Olefins Market by Region, Market Forecast 2017-2027 (Kilo Tons, AGR %)
Figure 5.10 Global Other Alpha Olefins Market by Region, 2016 v/s 2027 (Kilo Tons)
Figure 5.11 Global Other Alpha Olefins Market by Region, 2016 v/s 2027 (USD Million)
Figure 6.1 Global 1-Butene Market by Region, 2016 v/s 2027 (Kilo Tons)
Figure 6.2 Global 1-Butene Market by Region, 2016 v/s 2027 (USD Million)
Figure 6.3 Global 1-Hexene Market by Region, 2016 v/s 2027 (Kilo Tons)
Table 6.4 Global 1-Hexene Market by Region, Market Forecast 2017-2027 (Revenue, AGR %)
Figure 6.5 Global 1-Hexene Market by Region, 2016 v/s 2027 (USD Million)
Figure 6.6 Global 1-Octene Market by Region, 2016 v/s 2027 (Kilo Tons)
Figure 6.7 Global 1-Octene Market by Region, 2016 v/s 2027 (USD Million)
Figure 6.8 Global 1-Decene Market by Region, 2016 v/s 2027 (Kilo Tons)
Figure 6.9 Global 1-Decene Market by Region, 2016 v/s 2027 (USD Million)
Figure 6.10 Global 1-Dodecene Market by Region, 2016 v/s 2027 (Kilo Tons)
Figure 6.11 Global 1-Dodecene Market by Region, 2016 v/s 2027 (USD Million)
Figure 6.12 Global Other Alpha Olefin Type Market by Region, 2016 v/s 2027 (Kilo Tons)
Figure 6.13 Global Other Alpha Olefin Type Market by Region, 2016 v/s 2027 (USD Million)
Figure 7.1 Porter’s Five Forces Analysis
Figure 9.1 Top 3 Fastest Growing Alpha Olefins Types (AGR%), 2017-2027
Figure 9.2 Top 3 Fastest Growing Alpha Olefins Applications (AGR%), 2017-2027
Figure 9.3 Top 3 Fastest Growing Regional Alpha Olefins Markets (AGR %), 2017-2027


