The latest report from business intelligence provider Visiongain offers comprehensive analysis of the global Internet of Things market. Visiongain assesses that this market will generate revenues of $1,352 billion in 2018.
Internet of Things (IoT) Outlook
We expect that in the next five years, IoT will further penetrate several different industries and human activities, ranging from the home to the transportation industry, even affecting healthcare systems. IoT has not only allowed for machine-to-machine and machine to object communications but is radically changing how we perform daily activities such as driving or shopping for daily goods, generating great value for enterprises in the form of increases in production and efficiency. This is an example of the business critical news that you need to know about – and more importantly, you need to read Visiongain’s objective analysis of how this will impact your company and the IoT industry more broadly. How are you and your company reacting to these changes? Are you sufficiently informed?
How this report will benefit you
Read on to discover how you can exploit the future business opportunities emerging in the internet of things sector. Visiongain’s new study tells you and tells you NOW.
The 169 page report provides clear detailed insight into the global Internet of Things market, including 92 in-Depth tables, charts and graphs. It reveals the key drivers and challenges affecting the market.
By ordering and reading our brand new report today you will be better informed and ready to act.
Report Scope
• How is the Internet of Things Market evolving?
• Global Internet of Things market forecasts from 2018-2028
• Regional Internet of Things market forecasts from 2018-2028 covering
– Asia-Pacific
– Latin America
– Europe
– Middle East and Africa
– North America
• Country level Internet of Things forecasts from 2018-2028 covering
– China
– USA
– Japan
– France
– UK
– Germany
– India
– Russia
– Italy
– Brazil
– Row
• Internet of Things submarket forecasts from 2018-2028 covering:
– Industrial IoT
– Automotive & Transportation IoT
– Healthcare IoT
– Consumer Electronics IoT
– Others IoT
• Analysis of the key factors driving growth in the global and regional / country level Internet of Things markets from 2018-2028
• Analysis of game changing technological trends being employed by the leading players and how these will shape the Internet of Things industry.
• Who are the leading IoT players and what are their prospects over the forecast period?
• SWOT analysis of the major strengths and weaknesses of the IoT market, together with the opportunities available and the key threats faced.
• Market conclusions & recommendations.
How will you benefit from this report?
• This report will keep your knowledge base up to speed. Don’t get left behind
• This report will reinforce strategic decision-making based upon definitive and reliable market data
• You will learn how to exploit new technological trends
• You will be able to realise your company’s full potential within the market
• You will better understand the competitive landscape and identify potential new business opportunities & partnerships
Who should read this report?
• Anyone within the IoT value chain.
• Internet of Things vendors
• M2M Vendors
• Mobile equipment vendors
• Mobile infrastructure solution providers
• Mobile network operators (MNO)
• M2M service providers
• Device manufacturers (OEM)
• Chip set vendors
• Electricity utility companies,
• Grid security vendors, smart grid
• IT vendors and service providers
• CEO’s
• COO’s
• CIO’s
• Business development managers
• Marketing managers
• Technologists
• Suppliers
• Investors
• Banks
• Government agencies
• Contractors
Visiongain’s study is intended for anyone requiring commercial analyses for the top companies in the IoT market. You will find data, trends and predictions.
Buy our report today Internet of Things (IoT) Market Report 2018-2028: Analysis of Machine to Machine (M2M), Big Data & Cloud Technologies. Forecasts for Consumer Electronics (Smartphones, Smart Home, Energy & Utilities, Safety & Security, Smart Appliances, Connected Devices), Industrial (Oil & Energy, Agriculture, Retail, Manufacturing), Automotive & Transportation (Aviation, Maritime, Connected Vehicles), Healthcare (Telemedicine, Fitness & Activity), Other (Fixed Broadband, Fixed Communications, Government). Avoid missing out by staying informed – order our report now.
Visiongain is a trading partner with the US Federal Government
CCR Ref number: KD4R6
1. Executive Summary
1.1 Internet of Things Concept Making Inroads to Revolutionize the Global Economy
1.2 Market Definition
1.3 Market Segmentation
1.4 Benefits of This Report
1.5 Methodology
1.6 Frequently Asked Questions (FAQ)
1.7 About Visiongain
1.8 Associated Visiongain Reports
2. Introduction to the Internet of Things Market
2.1 What Defines the Internet of Things?
2.2 M2M Technology is the Backbone behind the Massive Potential in the Internet of Things Market
2.3 A Benefits Derived From Internet of Things
2.4 Cloud to Play Pivotal Role in the Internet of Things Industry Boom
2.5 Growth in the Wireless Sector
3. Global Internet of Things Market
3.1 Market Definition
3.2 Global Internet of Things Market Forecast 2018-2028
3.3 Global Internet of Things Connections Forecast 2018-2028
4. Global Internet of Things Submarket Forecasts 2018-2028
4.1 What are the Leading Submarkets in Visiongain’s Internet of Things Revenue Forecast 2018-2028?
4.1.1 Global Internet of Things Revenue Submarket Forecast AGR & CAGR
4.1.2 Consumer Electronics IoT Submarket Leading the Internet of Things with a Market Share of 30.1% In 2018
4.2 Industrial IoT
4.2.1 Industrial Internet of Things Submarket Forecast Summary 2018-2028
4.3 Automotive & Transportation IoT
4.3.1 Automotive & Transportation IoT Submarket Forecast Summary 2018-2028
4.4 Healthcare IoT
4.4.1 Healthcare IoT Submarket Forecast Summary 2018-2028
4.5 Consumer Electronics IoT
4.5.1 Recent Development in Consumers Electronics in the North America and Europe IoT Market
4.5.2 Consumer Electronics IoT Submarket Forecast Summary 2018-2028
4.6 Others IoT Submarket Forecast Summary 2018-2028
5. Regional Internet of Things Forecasts 2018-2028
5.1 Overview
5.2 Asia Pacific Leading Region in Terms of Revenue in 2018
5.2.1 Regional Internet of Things Revenue Forecast AGR & CAGR
5.2.2 Asia Pacific Leading Regional Internet of Things Market Shares in 2018 with 37.5%
5.3 Top 10 National Internet of Things Market Forecasts 2018-2028
5.3.1 U.S.A Macroeconomic factor Analysis
5.3.2 China Macroeconomic factor Analysis
5.3.3 UK Macroeconomic factor Analysis
5.3.4 Japan Macroeconomic factor Analysis
5.3.5 Germany Macroeconomic factor Analysis
5.3.6 France Macroeconomic factor Analysis
5.3.7 Italy Macroeconomic factor Analysis
5.3.8 Russia Macroeconomic factor Analysis
5.3.9 Brazil Macroeconomic factor Analysis
5.3.10 India Macroeconomic factor Analysis
6. SWOT Analysis of the IoT Market 2018
6.1 Strength: Global IoT Market 2018
6.2 Weakness: Global IoT Market 2018
6.3 Opportunity: Global IoT Market 2018
6.4 Threat: Global IoT Market 2018
7. Leading Companies in the IoT Market
7.1 Amazon
7.1.1 Amazon Financials
7.1.2 Amazon IoT Key Developments
7.2 Apple Inc.
7.2.1 Apple Inc.’s IoT Strategy
7.2.2. Apple Inc. Financials
7.2.3 Apple Inc.’s IoT Key Developments
7.3 AT&T
7.3.1 AT& T Financials
7.3.2 AT&T Business Aims
7.3.3 AT&T’s Position in the Market
7.3.4 AT&T IoT Key Developments
7.4 Cisco
7.4.1 Cisco Financials
7.4.2 Cisco IoT Key Developments
7.5 General Electric
7.5.1 General Electric Financials
7.5.2 General Electric IoT Key Developments
7.6 Google
7.6.1 Google IoT Key Developments
7.7 HP
7.7.1 HP Financials
7.7.2 HP IoT Key Developments
7.8 IBM
7.8.1 IBM Key Financials
7.8.2 IBM IoT Key Developments
7.9 Intel Corporation
7.9.1 Intel Corporation Key Financials
7.9.2 Intel Corporation IoT Key Developments
7.10 Microsoft
7.10.1 Retail
7.10.2 Healthcare
7.10.3 Automotive
7.10.4 Microsoft Key Financials
7.10.5 Microsoft IoT Key Developments
7.11 Silver Spring Networks
7.11.1 Silver Spring Networks Company Financials
7.11.2 Silver Spring Networks Key Developments
7.12 Schneider Electric SE
7.12.1 Schneider Electric SE Company Financials
7.12.2 Schneider Electric SE Key Developments
7.13 Qualcomm
7.13.1 Qualcomm Key Financials
7.13.2 Qualcomm IoT Key Developments
7.14 Samsung Electronics Co., Ltd.
7.14.1 Samsung Electronics Co., Ltd. Key Financials
7.14.2 Samsung Electronics Co., Ltd. IoT Key Developments
7.15 Philips N.V.
7.15.1 Philips N.V. Company Financials 2014 -2016
7.15.2 Philips N.V. Key Developments
7.16 Other Leading Companies in the IoT Market
8. Conclusions
8.1 Internet of Things Market Drivers
8.1.1 Cost savings
8.1.2 Creating New Revenue Streams
8.1.3 Connected Devices Growing Rapidly
8.1.4 IoT Gaining Popularity
8.1.5 Evolving ecosystem of IoT along with significant developments in the IoT market
8.1.6 Increasing need for energy saving solutions
8.1.7 Rising need of the customer for convenience and safety
8.2 Internet of Things Market Opportunities
8.2.1 Enhanced Market Segmentation
8.2.2 IoT Can be expanded to Any Vertical
8.2.3 Network Coverage
8.2.4 Telematics and Telemetry Increasing Efficiency
8.2.5 Service Providers Need to Expand Offerings
8.2.6 M2M Creating Scope for Development of New Applications
8.2.7 Numerous Government Initiatives to Promote Green Building and Green Cities
8.2.8 Customer Expectation from Connected Home
8.3 Internet of Things Market Challenges
8.3.1 Lack of Universal Standards
8.3.2 Security Concerns
8.3.3 IoT Solutions Can Be Expensive
8.3.4 Limited Awareness
8.4 Way Forward
8.4.1 Increase in M2M Partnerships
8.4.2 Standardisation
8.4.3 Measuring Data
8.4.4 New Business Models
8.5 Recommendations
8.5.1 What is the present market scenario?
8.5.2 Which region should be targeted?
9. Glossary
Associated Visiongain Reports
Visiongain Report Sales Order Form
Appendix A
About Visiongain
Appendix B
Visiongain report evaluation form
List of Figures
Figure 3.1 Internet of Things Submarket Segmentation
Figure 3.2 Global Internet of Things Market Forecast 2018-2028($ billion, AGR %)
Figure 3.3 Global Internet of Things Connections Forecast 2018-2028 (billion, AGR %)
Figure 4.1 Global Internet of Things Revenue Submarket Forecast 2018-2028 ($ billion)
Figure 4.2 Global Internet of Things Revenue Submarket AGR Forecast 2018-2022 (AGR %)
Figure 4.3 Global Internet of Things Market Share Forecast by Type 2018 (%)
Figure 4.4 Global Internet of Things Market Share Forecast by Type 2023(%)
Figure 4.5 Global Internet of Things Market Share Forecast by Type 2028(%)
Figure 4.6 Industrial Internet of Things Submarket Revenue Forecast 2018-2028($ billion, AGR %)
Figure 4.7 Industrial Internet of Things Submarket Share Forecast 2018, 2023 and 2028 (% Share)
Figure 4.8 Automotive & Transportation IoT Submarket Revenue Forecast 2018-2028($ billion, AGR %)
Figure 4.9 Automotive & Transportation IoT Submarket Share Forecast 2018, 2023 and 2028 (% Share)
Figure 4.10 Healthcare IoT Submarket Revenue Forecast 2018-2028($ billion, AGR %)
Figure 4.11 Healthcare IoT Submarket Share Forecast 2018, 2023 and 2028 (% Share)
Figure 4.12 Consumer Electronics IoT Submarket Revenue Forecast 2018-2028($ billion, AGR %)
Figure 4.13 Consumer Electronics IoT Submarket Share Forecast 2018, 2023 and 2028(% Share)
Figure 4.14 Others IoT Submarket Revenue Forecast 2018-2028($ billion, AGR %)
Figure 4.15 Others IoT Submarket Share Forecast 2018, 2023 and 2028 (% Share)
Figure 5.1 Regional Internet of Things Revenue Forecast 2018-2028 ($ billion)
Figure 5.2 Regional Internet of Things Revenue AGR Forecast 2018-2028 (AGR %)
Figure 5.3 Regional Internet of Things Market Share Forecast 2018 (%)
Figure 5.4 Regional Internet of Things Market Share Forecast 2023 (%)
Figure 5.5 Regional Internet of Things Market Share Forecast 2028 (%)
Figure 5.6 Top 10 National Internet of Things Market Forecast 2018-2028 ($ Billions, AGR%, % Share)
Figure 7.1 Amazon Financial Analysis
Figure 7.2 Amazon Financial Analysis By Region and Business Segment
Figure 7.3 Apple Inc. Financial Analysis
Figure 7.4 Apple Inc. Financial Analysis By Region and Business Segment
Figure 7.5 AT&T Financial Analysis
Figure 7.6 AT&T Financial Analysis By Region and Business Segment
Figure 7.7 Cisco Financial Analysis
Figure 7.8 Cisco Financial Analysis By Region and By Business Segment
Figure 7.9 General Electric Financial Analysis
Figure 7.10 General Electric Financial Analysis By Region and By Business Segment
Figure 7.11 HP Financial Analysis
Figure 7.12 HP Financial Analysis By Region and By Business Segment
Figure 7.13 IBM MessageSight System
Figure 7.14 IBM Financial Analysis
Figure 7.15 IBM Financial Analysis By Region and By Business Segment
Figure 7.16 Intel Corporation Financial Analysis
Figure 7.17 Intel Corporation Financial Analysis By Region and By Business Segment
Figure 7.18 Microsoft Azure Intel Corporationligent Systems
Figure 7.19 Microsoft Financial Analysis
Figure 7.20 Microsoft Financial Analysis By Region and By Business Segment
Figure 7.21: Silver Spring Networks Total Company Revenue 2012-2016
Figure 7.22: Silver Spring Networks Market Revenue By Region, 2014-2016
Figure 7.23 Schneider Electric SE Total Company Sales 2011-2016 (US$m)
Figure 7.24 Schneider Electric SE Sales by Geography 2013-2016 (US$m, Total Company Sales)
Figure 7.25 Qualcomm Financial Analysis
Figure 7.26 Qualcomm Financial Analysis By Region and By Business Segment
Figure 7.27 Samsung Electronics Co., Ltd. Financial Analysis
Figure 7.28 Samsung Electronics Co., Ltd. Financial Analysis By Region and By Business Segment
Figure 7.29 Philips N.V. Total Company Sales 2014-2016 (US$m)
List of Tables
Table 3.1 Global Internet of Things Market Forecast 2017-2028 ($ billion, AGR %, CAGR%, Cumulative)
Table 3.2 Global Internet of Things Connections Forecast 2017-2022 (billion, AGR %, CAGR%, Cumulative)
Table 4.1 Global Internet of Things Revenue Submarket Forecast 2018-2028 ($billion, AGR, CAGR)
Table 4.2 Global Internet of Things Revenue Submarket CAGR Forecast (%) 2018-2023, 2023-2028, and 2018-2028
Table 4.3 Global Internet of Things Market Share Forecast by Type 2018-2028 (%)
Table 4.4 Industrial Internet of Things Submarket Revenue Forecast 2018-2028 ($ billion, AGR %, CAGR%, Cumulative)
Table 4.5 Automotive & Transportation IoT Submarket Revenue Forecast 2018-2028 ($ billion, AGR %, CAGR%, Cumulative)
Table 4.6 Healthcare IoT Submarket Revenue Forecast 2018-2028 ($ billion, AGR %, CAGR%, Cumulative)
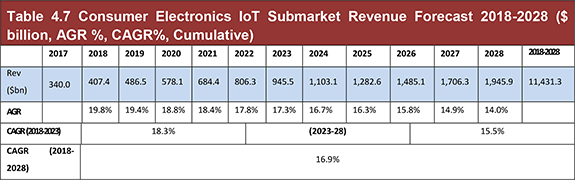
Table 4.7 Consumer Electronics IoT Submarket Revenue Forecast 2018-2028 ($ billion, AGR %, CAGR%, Cumulative)
Table 4.8 Others IoT Submarket Revenue Forecast 2018-2028 ($ billion, AGR %, CAGR%, Cumulative)
Table 5.1 Regional Internet of Things Revenue Forecast 2018-2028 ($ billion)
Table 5.2 Regional Internet of Things Revenue CAGR Forecast (%) 2018-2023, 2023-2028, and 2018-2028
Table 5.3 Regional Internet of Things Market Share Forecast 2018-2028 (%)
Table 5.4 Top 10 National Internet of Things Market Forecast 2018-2028 ($ Billions, AGR%, % Share)
Table 5.4 Top 10 National Internet of Things Market Forecast 2018-2028 ($ Billions, AGR%, % Share) (continued)
Table 6.1 SWOT Analysis of the Internet of Things Market 2018
Table 7.1: Amazon IoT Market Key Developments
Table 7.2: Apple Inc., IoT Market Key Developments
Table 7.3 AT&T M2M Solution, Assets, and Advantages
Table 7.4: AT&T, IoT Market Key Developments
Table 7.5: Cisco IoT Market Key Developments
Table 7.6: General Electric IoT Market Key Developments
Table 7.7: Google IoT Market Key Developments
Table 7.8: HP IoT Market Key Developments
Table 7.9 IBM Adept Performance Management Solution Focus Areas
Table 7.10: IBM IoT Market Key Developments
Table 7.11: Intel Corporation IoT Market Key Developments
Table 7.12 Windows Embedded Product Portfolio
Table 7.13: Microsoft IoT Market Key Developments
Table 7.14: Silver Spring Networks Market Products / Services (Product Segment, Products)
Table 7.15 Silver Spring Networks Recent Developments
Table 7.16 Schneider Electric SE Total Company Sales 2011-2016 (US$m, AGR %)
Table 7.17 Schneider Electric SE Recent Developments
Table 7.18: Qualcomm IoT Market Key Developments
Table 7.19: Samsung Electronics Co., Ltd. IoT Market Key Developments
Table 7.20 Philips N.V. Recent Developments
Table 7.21 Other Leading Companies in the IoT Market 2017 (Company, Product /service)
Table 7.21 Other Leading Companies in the IoT Market 2017 (Company, Product /service) (continued)
Table 7.21 Other Leading Companies in the IoT Market 2017 (Company, Product /service) (continued)
7 Layers
Aeris Communications
Aeroscout
Alien Technology
Amazon
Apple Inc.
Arkessa
Arrayent
AT&T
Atos Origin SA
Augusta Systems
AVIDwireless
Axeda
Best Buy
CalAmp
CETECOM
Cisco
Cisco
Clearconnex
Comtrol
Connect One
Connected Development
Coronis
DataOnline
DataRemote
Dell
Deutsche Telekom
Digi International
Dust Networks
Echelon
eDevice
ei3
Ember
Enfora
Esprida
Eurotech
Exosite
Feeney Wireless
Gemalto
General Electric
Globalstar
Google
Honeywell International
HP
Huawei
Hughes Telematics
IBM
IBM
ILS Technology
iMetrik Solutions
Inilex
Inmarsat
Intel Corporation
Intel Corporation
Iridium Communications
Itron
Janus Remote Communications
Laird Technologies
Lantronix
LG
M2M Communications
M2M DataSmart
Marvell
MEMSIC
Microchip Technology
Microsoft
Millennial Net
Mocana
Morey
Motorola
MOXA
nPhase
Omnilink Systems
ORBCOMM
Palantiri Systems
Panasonic
Pedigree Technologies
Perle Systems
Philips N.V.
Precidia Technologies
Qualcomm
Qualcomm
Red Bend Software
RF Code Inc.
RF Monolithics
Rogers Communications
Samsung
Savi Technology
Schneider Electric SE
SENA Technologies
SensorLogic
Sigma Designs
Silver Spring Networks
Sixnet
SkyTel
Sony
Swisscom
Synchronoss Technologies
Telular
TELUS Mobility
Tendril Networks
Texas Instruments
ThingMagic
Tridium
Trimble
ublox
V2COM
WebTech Wireless
Wyless Group
Xact Technology
ZTE
List of Organizations
CASAGRAS project
Consumer Electronics Show (CES)
KAA Project
The Alliance for Telecommunications Industry Solutions (ATIS) of the U.S
The Association of Radio Industries and Businesses (ARIB) and the Telecommunication
Technology Committee (TTC) of Japan
The China Communications Standards Association (CCSA)
The European Telecommunications Standards Institute (ETSI)
The Telecommunications Industry Association (TIA) of the U.S.
The Telecommunications Technology Association (TTA) of Korea
The UK's Department for Energy and Climate Change (DECC)
World Wide Developers Conference Community (WWDC)