How this report will benefit you
Read on to discover how you can exploit the future business opportunities emerging in this sector.
In this brand new 180-page report you will receive 67 tables and 50 figures– all unavailable elsewhere.
The 180-page report provides clear detailed insight into the Hepatits C Therapies market. Discover the key drivers and challenges affecting the market.
By ordering and reading our brand new report today you stay better informed and ready to act.
The revenue of the Hepatitis C market in 2016 is estimated at $19bn and is expected to grow at a CAGR of 1.7% in the first half of the forecast period. Oral antivirals accounted for the largest share of the market in 2016, this segment generated $18.7bn.
Read on to discover how this definitive report can transform your own research and save you time.
The new market assessment benefits research, analysis and planning in seven main ways:
• World HCV market revenue to 2027 – discover that industry’s overall sales potential
• Two product classes’ revenues to 2027 – investigate categories at world level, finding the most lucrative and promising therapy classes
• Eight leading drugs’ revenues to 2027 – find sales predictions for top and emerging products, seeing how agents compete and succeed
• 11 national markets in the Americas, Europe and Asia covered, with forecasts to 2027 – discover the best countries for trade expansion
• Activities of established, rising and emerging companies – hear about firms’ products, capabilities, advances, collaborations and outlooks
• R&D for antiviral medicines – investigate progress in that industry, exploring technological, clinical and commercial opportunities
• Analysis of what stimulates and restrains that industry and market – assess challenges, strengths, competition and opportunities, helping you succeed.
There you explore business intelligence with research, opinions and predictions found only in that work.
Trying our investigation now lets you discover trends, opportunities and prospects
For treating hepatitis C virus, our report shows you data, trends, opportunities and multilevel sales forecasts. So, avoid missing out. Instead please get that new analysis here now.
Report highlights
• 192 pages, 67 tables and 50 figures
• Hepatitis C Market Therapies Market Forecast from 2017 to 2027
• This report also breaks down the revenue forecast for the main submarkets:
• Oral Antivirals
• Interferons
• Analysis of the Oral Antivirals drugs market. Revenue forecasts to 2027 are provided for the following drugs:
• Harvoni
• Sovaldi
• Epclusa
• Daklinza
• Analysis of the Interferons drugs market. Revenue forecasts to 2027 are provided for the following drugs:
• Pegasys
• PegIntron
• Analysis of key players in Hepatitis C Therapeutics
• Gilead Sciences
• Merck and Co.
• Roche
• Bristol Myers Squibb
• Janssen
• Achillion Pharmaceuticals
• Regional Hepatitis C market forecasts from 2017-2027
• US forecast 2017-2027,
• China forecast 2017-2027
• Japan forecast 2017-2027
• India forecast 2017-2027
• Germany forecast 2017-2027
• UK forecast 2017-2027
• France forecast 2017-2027
• Brazil Forecast 2017-2027
• Russia Forecast 2017-2027
• Key questions answered
• What does the future hold for the Hepatitis C Therapies industry?
• Where should you target your business strategy?
• What technologies give the most promising candidates for new drugs?
• Which disruptive technologies should you invest in?
• Which companies should you form strategic alliances with?
• Which company is likely to success and why?
• What business models should you adopt?
• What industry trends should you be aware of?
• Which is the company with the highest expected revenue from 2017 to 2027?
• Where lie the best geographical opportunities for selling those antivirals?
• Why will the HCV drug market expand, and what limits its sales growth?
• How will companies overcome challenges in serving regulators, patients and payers?
• Target audience
• Leading Hepatitis C companies
• Suppliers
• Contractors
• Technologists
• R&D staff
• Consultants
• Analysts
• CEO’s
• CIO’s
• COO’s
• Business development managers
• Investors
• Governments
• Agencies
• Industry organisations
• Banks
With our study you see how that market can develop and perform, benefiting your reputation for insight and authority.
Visiongain is a trading partner with the US Federal Government
CCR Ref number: KD4R6
1. Report Overview
1.1 Overview of the World Market for Hepatitis C Therapies
1.2 Why You Should Read This Report
1.3 How This Report Delivers
1.4 Main Questions Answered by this Analysis
1.5 Who is this Study For?
1.6 Methods of Research and Analysis
1.7 Frequently Asked Questions (FAQs)
1.8 Some Associated Reports
1.9 About Visiongain
2. Introduction to Hepatitis C Therapies
2.1 A Breif History of Hepatitis C and Treatments
2.2 Genotypes
2.3 Symptoms: Acute and Chronic Hepatitis C
2.4 Diagnosing Hepatitis C: The Asymptomatic Nature
2.5 Risk Factors for Hepatitis C
2.6 Incidence and Prevalence Patterns
2.7 Hepatitis C: Treatment and Prevention
2.8 Antivirals: Inhibiting Virus Replication
2.8.1 Protease Inhibitors
2.8.2 Polymerase Inhibitors
2.8.3 NS5A Replication Complex Inhibitors
2.9 Interferons: Dual Mode of Action
2.9.1 Combination Therapy: Treatment with Interferons and Antivirals
2.9.2 Interferon-Free Regimens
2.10 Hepatitis C and the Need for a Vaccine
3. The World Hepatitis C Therapies Market, 2017-2027
3.1 Hepatitis C Therapies Market, 2015 and 2016
3.2 The Hepatitis C Therapies Market: Revenue Forecast, 2016-2027
3.3 Rising Awareness and Screening: Expanding Treatment Population
3.4 Generic Competition in the Hepatitis C Therapies Market
3.5 Biosimilar Interferons
3.6 Direct-Acting Antivirals (DAAs): A Change in Therapeutic Landscape
3.7 Oral Antivirals Submarket
3.8 Oral Antivirals Submarket: Revenue Forecast, 2016-2027
3.9 A Strong Developmental Pipeline to Drive Market Growth
3.10 All-Oral Treatments for Hepatitis C: Improving Tolerability
3.11 Interferons Submarket
3.12 Standard of Care for Hepatitis C
3.13 Drawbacks to Interferon Therapy
3.14 Declining Revenues 2008-2016
3.15 Interferons Submarket: Revenue Forecast, 2016-2027
3.16 Next Generation Interferons: A Potential Advance or Lateral Move?
3.17 Hepatitis C Vaccines Submarket
3.18 Hepatitis C Therapies: Submarket Shares 2016, 2021 and 2027
4. Leading National Hepatitis C Markets, 2016-2027
4.1 Global Prevalence of Hepatitis C, 2016
4.2 The Importance of Asia
4.3 Hepatitis C Therapies Market: Regional Breakdown, 2016
4.4 Hepatitis C Therapies Market: Regional Forecast, 2016-2027
4.5 US Hepatitis C Market
4.5.1 Population Movement and Hepatitis C
4.5.2 The Affordable Care Act and Hepatitis C
4.5.3 Increased Screening towards Target Population
4.5.4 The US Revenue Forecast, 2016-2027
4.6 Leading EU Markets for Hepatitis C Therapies
4.7 Regional Prevalence
4.8 EU5 Hepatitis C Market, 2016
4.8.1 EU5 Hepatitis C Market: Revenue Forecasts, 2016-2027
4.8.2 Italy Hepatitis C Market: Revenue Forecasts, 2016-2027
4.8.3 Spain Hepatitis C Market: Revenue Forecasts, 2016-2027
4.8.4 Germany Hepatitis C Market: Revenue Forecasts, 2016-2027
4.8.5 UK Hepatitis C Market: Revenue Forecasts, 2016-2027
4.8.6 France Hepatitis C Market: Revenue Forecasts, 2016-2027
4.9 Hepatitis C in Asia
4.10 China Hepatitis C Market
4.10.1 Decline in Incidence of Hepatitis C
4.10.2 Rising Middle Class
4.10.3 Hepatitis C Outbreaks
4.10.4 Domestic Drug and Vaccine Development
4.10.5 China: Revenue Forecast, 2016-2027
4.11 Japan
4.11.1 Hepatitis C in Japan
4.11.2 Japan: Revenue Forecast, 2016-2027
4.12 India
4.12.1 Low Awareness Rates
4.12.2 India: Revenue Forecast, 2016-2027
4.13 Russia
4.13.1 Low Treatment Rates and High Drug Cost Limiting Market
4.13.2 Adverse Impact of Western Sanctions on Russian Pharma Market
4.13.3 Russia: Revenue Forecast, 2016-2027
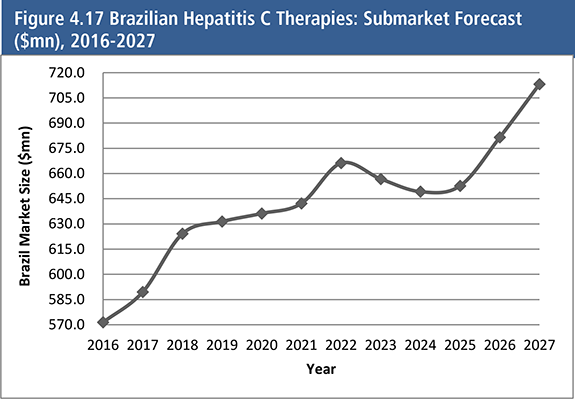
4.14 Brazil
4.14.1 Current Disease Prevalence
4.14.2 Brazil: Revenue Forecast, 2016-2027
5. Leading Hepatitis C Therapies: Market Prospects 2016 to 2027
5.1 Leading Hepatitis C Therapies, 2016-2027
5.2 Harvoni (Gilead Sciences)
5.2.1 Gilead-AbbVie Dispute over Ledipasvir/Sofosbuvir Patents
5.2.2 Harvoni Revenue Forecast, 2016-2027
5.3 Sovaldi (Gilead Sciences)
5.3.1 Recent Revenue Analysis
5.3.2 Gilead Licenses Generic Substitute for Sovaldi for Production and Sales in Developing Countries
5.3.3 Sovaldi Revenue Forecast, 2016-2027
5.4 Epclusa (Merck & Co.)
5.4.1 Epclusa: Revenue Forecast, 2016-2027
5.5 Daklinza (Bristol-Myers Squibb)
5.5.1 Daklinza Revenue Forecast, 2016-2027
5.6 Zepatier (Merck & Co.)
5.6.1 Zepatier Revenue Forecast, 2016-2027
5.7 Sunvepra (Bristol-Myers Squibb)
5.7.1 Sunvepra: Synergistic Effect with Daklinza
5.7.2 Sunvepra Revenue Forecast, 2016-2027
5.8 Pegasys (Roche)
5.8.1 Recent Revenue Analysis
5.8.2 Label Expansions and Lifecycle Management Strategies
5.8.3 Pegasys Revenue Forecast, 2016-2027
5.9 PegIntron (Merck & Co.)
5.9.1 Recent Revenue Analysis
5.9.2 Competition from Interferon Biosimilars
5.9.3 Enhancing Drug Life Cycle
5.9.4 PegIntron Revenue Forecast, 2016-2027
5.10 Olysio (Janssen/Medivir)
5.10.1 Recent Revenue Analysis
5.10.2 Combination Regimen of Sovaldi and Olysio
5.10.3 Olysio Revenue Forecast, 2016-2027
6. Hepatitis C Therapies Market: Leading R&D Pipeline Candidates, 2016
6.1 Introduction to Hepatitis C Therapy Candidates
6.2 Glecaprevir/Pibrentasvir (Abbvie)
6.3 Sofosbuvir/Velpatasvir/Voxilaprevir (Gilead Sciences)
6.4 Uprifosbuvir/Grazoprevir/Ruzasvir (Merck and Co.)
6.5 AL-335/Odalasvir/Simeprevir (Achillion and Janssen)
6.6 Protease Inhibitors Pipeline
6.6.1 Sovaprevir (Achillion Pharmaceuticals): Playing Catch Up
6.6.2 Danoprevir (Roche): Testing Out Combination Regimens
6.6.3 Lomibuvir (Vertex Pharmaceuticals)
6.6.4 ABT-493 (AbbVie)
6.6.5 GS-9857 (Gilead Sciences)
6.7 Polymerase Inhibitors Pipeline
6.7.1 ACH-2928 (Achillion Pharmaceuticals)
6.7.2 BMS-791325 (Bristol-Myers Squibb): Phase II
6.7.3 TMC-647055 (Janssen): Phase II
6.7.4 Mercitabine (Roche/Pharmasset): Broad Spectrum Treatment
6.7.5 Setrobuvir (Roche): Non-Nucleoside Inhibitor
6.7.6 VX-135 (Vertex Pharmaceuticals): Interferon- and Ribavirin-Free Regimens
6.7.7 GS-9669 (Gilead Sciences)
6.7.8 PPI-383 (Presidio Pharmaceuticals)
6.8 NS5A Inhibitors Pipeline
6.8.1 ABT-530 (AbbVie)
6.8.2 Samatisvir (Merck & Co.): Acquired from Idenix
6.8.3 GS-5816 (Gilead Sciences)
6.8.4 PPI-668 (Presidio Pharmaceuticals)
6.9 Interferon Pipeline
6.9.1 Locteron (Biolex): Controlled Release Formulation
6.9.2 Peginterferon Lambda-1a (Bristol-Myers Squibb): Improved Side Effects Profile
6.10 Novel Inhibitors
6.10.1 SCY-635 (SCYNEXIS)
6.10.2 Miraversen (Santaris)
6.10.3 GS-9620 (Gilead Sciences)
6.10.4 RG-101 (Regulus Therapeutics)
6.10.5 Leading Hepatitis C Vaccine Pipeline Candidates, 2017
6.10.6 ChronVac-C (ChronTech Pharma/Inovio Pharmaceuticals): Therapeutic Vaccine in Phase II Trials
6.10.7 GI-5005 (GlobeImmune): Yeast-Based Hepatitis C Vaccine
6.10.8 INO-8000 HCV (Inovio Pharmaceuticals): Therapeutic Vaccine in Phase I Trials
6.10.9 Okairos Inc.: Prophylactic and Therapeutic Vaccine Candidates
7. Leading Companies in the Hepatitis C Therapies Market
7.1 Leading Market Players, 2015 and 2016
7.2 Gilead Sciences
7.2.1 Product Overview and Performance, 2015 and 2016
7.2.2 Recent Developments: Gilead Sciences Acquires Pharmasset
7.2.3 Hepatitis Pipeline: Strong and Diverse
7.2.4 Future Outlook: Strongest Pipeline than Any Other Company
7.3 Johnson & Johnson (Janssen Pharmaceuticals)
7.3.1 Product Overview and Performance, 2015 and 2016
7.3.2 Recent Developments: Acquisition of Alios BioPharma
7.3.3 Hepatitis Pipeline
7.3.4 Future Outlook: Combination Regimens with Olysio
7.4 Roche
7.4.1 Product Overview and Performance, 2015 and 2016
7.4.2 Recent Developments: Partnership with Anadys
7.4.3 Hepatitis Pipeline
7.4.4 Future Outlook: Slowing Demand May Affect Market Dominance
7.5 Bristol-Myers Squibb
7.5.1 Product Overview and Performance, 2015 and 2016
7.5.2 Recent Developments: Strengthening Product Pipeline Through Acquisitions
7.5.2.1 Bristol-Myers Squibb Acquires Inhibitex
7.5.3 Hepatitis Pipeline: Strong Future Position in Hepatitis C
7.5.4 Future Outlook: Market Set For Intense Competition
7.6 Merck & Co.
7.6.1 Product Overview and Performance, 2015 and 2016
7.6.2 Recent Developments: Merck & Co. Acquires Idenix
7.6.3 Hepatitis Pipeline
7.6.4 Future Outlook: Company Pins Hopes on Launch of Pipeline Therapies
7.7 Leading Hepatitis C Pipeline Companies, 2017
7.8 Gilead Sciences
7.9 Merck & Co.
7.10 AbbVie (Formerly Abbott Laboratories): New Venture into Hepatitis C
7.11 Achillion Pharmaceuticals: Next Target for Acquisition
7.11.1 Achillion and Gilead
7.11.2 Achillion and Janssen
8. Hepatitis C Therapies Market: Industry Trends, 2016-2027
8.1 SWOT Analysis of the World Hepatitis C Therapies and Vaccines Market, 2016-2027
8.1.1 Strengths and Weaknesses in the Hepatitis C Therapies Market, 2016-2027
8.1.1.1 Interferon Therapy Has Drawbacks
8.1.1.2 Genotype 1: A Common but Difficult to Treat Form of Hepatitis C
8.1.2 Opportunities and Threats in the Hepatitis C Therapies Market, 2016-2027
8.1.2.1 Hepatitis Screening and Diagnosis
8.1.2.2 Raising Awareness and Overcoming Social Stigma
8.1.2.3 Personalised Therapy
8.1.2.4 HIV Co-Infection
8.1.2.5 Asia
8.2 STEP Analysis of the World Hepatitis C Therapies and Vaccines Market, 2016-2027
8.2.1 Social Development
8.2.1.1 Social Implications in China
8.2.2 Technological Advances
8.2.3 Economic Pressures
8.2.4 Political Issues
8.3 Hepatitis C Vaccines
8.4 Oral Direct-Acting Antivirals
8.5 Nucleoside and Non-Nucleoside Polymerase Inhibitors
8.6 Combining Protease and Polymerase Inhibitors
8.7 The Need for Ribavirin
8.8 Twelve-Week Treatment Target
8.9 Pharmaceutical Investment in Hepatitis C
8.9.1 Licensing and Partnering Deals
8.9.2 Acquisitions in Hepatitis C
8.9.3 Other Companies of Note for Hepatitis Treatment Developments
9. Conclusions
9.1 State of the Hepatitis C Therapies Market, 2016 and 2017
9.2 Growth in the Hepatitis C Therapies Market, 2016-2027
9.2.1 Rise of Direct-Acting Antivirals in Hepatitis C
9.2.2 Asia as a Hepatitis C Drug Market
9.3 Concluding Remarks
Associated Visiongain Reports
Visiongain Report Sales Order Form
About Visiongain
Visiongain Report Evaluation Form
List of Tables
Table 1.1 Submarket Forecasts of Hepatitis C Therapies, 2016-2027
Table 2.1 Global Pattern of Hepatitis C Genotypes and Subtypes, 2016
Table 2.2 Approved Antiviral Subtypes for Hepatitis C, 2016
Table 3.1 Hepatitis C Therapies Market ($mn) by Sector and Market Share (%) 2015
Table 3.2 Hepatitis C Therapies Market ($mn) and Market Share (%) by Sector, 2016
Table 3.3 Hepatitis C Therapies Market: Overall Market Forecast of Currently Approved Drugs and Predicted Approvals ($mn), AGR (%) and CAGR (%), 2016-2027
Table 3.4 Hepatitis C Therapies Market: Revenue Forecasts by Segment ($mn), AGR (%) and CAGR (%), 2016-2027
Table 3.5 Selected Biosimilar Interferon Alpha Therapies Approved in Emerging National Markets, 2016
Table 3.6 Leading Hepatitis C Antivirals: Revenue Shares by Drug ($mn) and Market Share (%), 2016
Table 3.7 Oral Antivirals Submarket: Revenue Forecast ($mn), AGR (%) and CAGR (%), 2016-2027
Table 3.8 Interferons Submarket: Revenue ($mn) and Market Share (%) by Drug, 2016
Table 3.9 Interferons Submarket: Revenue Forecast ($mn), AGR (%) and CAGR (%) 2016-2027
Table 3.10 Hepatitis C Submarket Shares (%), 2016, 2021 & 2027
Table 4.1 Global Prevalence of Chronic
Table 4.2 Hepatitis C Therapies: Revenue ($mn) and Market Share (%) by Region, 2016
Table 4.3 Hepatitis C Therapies: Overall Market and Revenue Forecasts ($mn) by Region, AGR (%) and CAGR (%) 2016-2027
Table 4.4 US Hepatitis C Therapies Market: Forecast ($mn), AGR (%) and CAGR (%) 2016-2027
Table 4.5 EU5 Hepatitis C Therapies Revenue ($mn), EU5 Market Share (%) and Global Market Share (%) by Country, 2016
Table 4.6 EU5 Hepatitis C Therapies Market: Overall Revenue Forecasts ($mn), AGR (%) and CAGR (%) 2016-2027
Table 4.7 Italian Hepatitis C Therapies: Forecast ($mn), AGR (%) and CAGR (%) 2016-2027
Table 4.8 Spanish Hepatitis C Therapies: Forecast ($mn), AGR (%) and CAGR (%) 2016-2027
Table 4.9 German Hepatitis C Therapies: Forecast ($mn), AGR (%) and CAGR (%) 2016-2027
Table 4.10 UK Hepatitis C Therapies: Forecast ($mn), ARG (%) and CAGR (%) 2016-2027
Table 4.11 French Hepatitis C Therapies: Forecast ($mn), AGR (%) and CAGR (%) 2016-2027
Table 4.12 Chinese Hepatitis C Therapies: Forecast ($mn), 2016-2027
Table 4.13 Japanese Hepatitis C Therapies: Forecast ($mn), AGR (%) and CAGR (%) 2016-2027
Table 4.14 Indian Hepatitis C Therapies: Forecast ($mn), AGR (%) and CAGR (%) 2016-2027
Table 4.15 Russian Hepatitis C Therapies: Forecast ($mn), AGR (%) and CAGR (%) 2016-2027
Table 4.16 Brazilian Hepatitis C Therapies: Forecast ($mn), AGR (%) and CAGR (%) 2016-2027
Table 5.1 Selected Leading Hepatitis C Therapies ($mn) and Market Share (%), 2016
Table 5.2 Harvoni: Key Facts, 2017
Table 5.3 Harvoni: Revenue Forecast ($mn), AGR (%) and CAGR (%) 2016-2027
Table 5.4 Sovaldi: Key Facts, 2017
Table 5.5 Sovaldi: Revenue ($mn) by Region, Q1-Q2 2017
Table 5.6 Sovaldi: Revenue Forecast ($mn), AGR (%) and CAGR (%) 2016-2027
Table 5.7 Epclusa: Key Facts, 2017
Table 5.8 Epclusa: Revenue Forecast ($mn), AGR (%) and CAGR (%) B2016-2027
Table 5.9 Daklinza: Key Facts, 2017
Table 5.10 Daklinza: Revenue Forecast ($mn), AGR (%) and CAGR (%) 2016-2027
Table 5.11 Zepatier: Key Facts, 2017
Table 5.12 Zepatier: Revenue Forecast ($mn), AGR and CAGR (%) and 2016-2027
Table 5.13 Sunvepra: Key Facts, 2017
Table 5.14 Sunvepra: Revenue Forecast ($mn), AGR (%) and CAGR (%) 2016-2027
Table 5.15 Pegasys: Key Facts, 2017
Table 5.16 Pegasys: Revenue Forecast ($mn), AGR (%) and CAGR (%) 2016-2027
Table 5.17 PegIntron: Key Facts, 2017
Table 5.18 PegIntron: Revenue Forecast ($mn), AGR (%) and CAGR (%), 2016-2027
Table 5.19 Olysio: Key Facts, 2017
Table 5.20 Olysio: Revenue ($mn) by Region, Q1-Q2 2017
Table 5.21 Olysio: Revenue Forecast ($mn), AGR (%) and CAGR (%), 2016-2027
Table 7.1 Hepatitis C Therapies: Revenue ($mn) and Market Share (%) by Company, 2015
Table 7.2 Hepatitis C Therapies: Revenue ($mn) and Market Share (%) by Company, 2016
Table 7.3 Gilead Sciences: Revenue ($mn) and Revenue Share (%) by Therapeutic Area, 2016
Table 7.4 Gilead Sciences: Hepatitis C Pipeline, 2016
Table 7.5 Roche: Hepatitis C Pipeline, 2016
Table 7.6 Pegasys: Revenue ($mn) and Market Share (%), 2016, 2021 & 2027
Table 7.7 Bristol-Myers Squibb: Hepatitis Pipeline, 2016
Table 7.8 Merck & Co: Pharmaceutical Revenue ($mn) and Revenue Share (%) by Therapeutic Area, 2016
Table 7.9 Gilead Sciences: Hepatitis C All-Oral Regimens, 2016
Table 7.10 Merck & Co.: Hepatitis C All-Oral Regimens, 2016
Table 7.11 AbbVie: Hepatitis C All-Oral Regimens, 2016
Table 7.12 Achillion Pharmaceuticals: Hepatitis C All-Oral Regimens, 2016
Table 8.1 Hepatitis C Therapies Market: Strengths and Weaknesses, 2016
Table 8.2 Hepatitis C Therapies Market: Opportunities and Threats, 2016-2027
Table 8.3 Liver Cancer: Deaths by Region, 2016
Table 9.1 Hepatitis C Therapies: Revenue ($mn) by Drug and Segment, 2016, 2021 & 2027
Table 9.2 Leading Hepatitis C Therapies: Patent Expiries and Peak Revenues ($mn)
List of Figures
Figure 2.1 A Brief History of Hepatitis, 1947-2016
Figure 3.1 Hepatitis C Therapies Market by Segment (%), 2015
Figure 3.2 Hepatitis C Therapies Market by Segment (%), 2016
Figure 3.3 Hepatitis C Therapies Market: Overall Market Forecast ($mn), 2016-2027
Figure 3.4 Global Hepatitis C Therapies Market: Drivers and Restraints, 2016-2027
Figure 3.5 Leading Hepatitis C Antivirals Submarket Share (%), 2016
Figure 3.6 Oral Antivirals Market: Drivers and Restraints, 2016-2027
Figure 3.7 Oral Antivirals Submarket: Revenue Forecast ($mn), 2016-2027
Figure 3.8 Interferons Submarket: Market Share (%) by Drug, 2016
Figure 3.9 Interferons Submarket: Revenue Forecast ($mn), 2016-2027
Figure 3.10 Interferons Submarket: Drivers and Restraints, 2016-2027
Figure 3.11 Hepatitis C Submarket Shares ($mn), 2016, 2021 & 2027
Figure 4.1 Chronic Hepatitis C: Global Prevalence (%) by Region, 2016
Figure 4.2 Hepatitis C Therapies: Market Share (%) by Region, 2016
Figure 4.3 Hepatitis C Therapies: Market Share (%) by Region, 2021
Figure 4.4 Hepatitis C Therapies: Market Share (%) by Region, 2027
Figure 4.5 US Hepatitis C Therapies: Submarket Forecast ($mn), 2016-2027
Figure 4.6 EU5 Hepatitis C Therapies: Market Share (%) by Country, 2016
Figure 4.7 EU5 Hepatitis C Therapies: Submarket Forecast ($mn), 2016-2027
Figure 4.8 Italian Hepatitis C Therapies: Submarket Forecast ($mn), 2016-2027
Figure 4.9 Spanish Hepatitis C Therapies: Submarket Forecast ($mn), 2016-2027
Figure 4.10 German Hepatitis C Therapies: Submarket Forecast ($mn), 2016-2027
Figure 4.11 UK Hepatitis C Therapies: Submarket Forecast ($mn), 2016-2027
Figure 4.12 French Hepatitis C Therapies: Submarket Forecast ($mn), 2016-2027
Figure 4.13 Chinese Hepatitis C Therapies: Submarket Forecast ($mn), 2016-2027
Figure 4.14 Japanese Hepatitis C Therapies: Submarket Forecast ($mn), 2016-2027
Figure 4.15 Indian Hepatitis C Therapies: Submarket Forecast ($mn), 2016-2027
Figure 4.16 Russian Hepatitis C Therapies: Submarket Forecast ($mn), 2016-2027
Figure 4.17 Brazilian Hepatitis C Therapies: Submarket Forecast ($mn), 2016-2027
Figure 5.1 Harvoni: Revenue Forecast (mn), 2016-2027
Figure 5.2 Sovaldi: Revenue ($mn) by Region, Q1-Q2, 2017
Figure 5.3 Sovaldi: Revenue Forecast ($mn), 2016-2027
Figure 5.4 Epclusa: Revenue Forecast ($mn), 2016-2027
Figure 5.5 Daklinza: Revenue Forecast ($mn), 2016-2027
Figure 5.6 Zepatier: Revenue Forecast ($mn), 2016-2027
Figure 5.7 Sunvepra: Revenue Forecast ($mn), 2016-2027
Figure 5.8 Pegasys: Historical Revenue ($mn), 2011-2016
Figure 5.9 Pegasys: Revenue Forecast ($mn), 2016-2027
Figure 5.10 PegIntron: Recent Revenue ($mn), 2013-2017
Figure 5.11 PegIntron: Revenue Forecast ($mn), 2016-2027
Figure 5.12 Olysio: Recent Revenue ($mn), US and ROW, Q1-Q2, 2017
Figure 5.13 Olysio: Revenue Forecast ($mn), 2016-2027
Figure 7.1 Hepatitis C Therapies: Market Share (%) by Company, 2015
Figure 7.2 Hepatitis C Therapies: Market Share (%) by Company, 2016
Figure 7.3 Gilead Sciences: Revenue Share (%) by Therapeutic Area, 2016
Figure 7.4 Johnson & Johnson: Key Events in the Hepatitis C Drug Market, 2011-2016
Figure 7.5 Pegasys: Revenue ($mn), 2016, 2021 & 2027
Figure 7.6 Merck & Co: Revenue Share (%) by Therapeutic Area, 2016
Figure 8.1 Liver Cancer: Deaths by Region, 2016
Figure 9.1 Hepatitis C Therapies: Revenue ($mn) by Segment, 2016, 2021 & 2027