Visiongain assesses that the global Well Intervention market will experience Capex of $10,677m in 2017. Read on to discover the potential business opportunities available.
Emerging regions are set to witness rigorous oil & gas field development, which is driving the need for well intervention services. The occurrence of massive unmapped hydrocarbon rich reserves availability in onshore and offshore basins along with high dependence of numerous economies in the industry are set to propel the market growth in the near future. The surge of exploration and production activities in countries such as Russia, Norway, Malaysia, and Australia is anticipated to positively influence the overall industry growth. The high rate of deep sea and ultra-deep-sea explorations particularly in the North Sea, South China Sea, Gulf of Mexico and the Persian Gulf is estimated to drive well intervention demand over the forecast period.
With reference to this report, the global well intervention market is being segmented based on application into offshore and onshore services. The study further segments global well intervention market based on services into logging & bottom hole survey, tubing/packer failure & repair, stimulation, remedial cementing, zonal isolation, sand control services, artificial lift, fishing, re-perforation and others.
The report will answer questions such as:
• How is the Well Intervention market evolving?
• What is driving and restraining the Well Intervention market dynamics?
• What are the market shares of the end-use sectors/resin types submarkets within the overall Well Intervention market in 2017?
• How will each end-use sector/resin type Well Intervention submarket grow over the forecast period and how much revenue will these submarkets account for in 2027?
• Which trends and developments will prevail and how will these shifts be responded to?
• How will the market shares of the national markets change by 2027 and which geographical region will lead the market in 2027?
• Who are the leading players and what are their prospects over the forecast period?
Five Reasons Why You Must Order and Read This Report Today:
1) The report provides market share and detailed profiles of the leading companies operating within the Well Intervention market:
– Halliburton
– Schlumberger
– Superior Energy Services
– Baker Hughes
– GE Oil & Gas
– Archer Limited
– Lupatech SA
2) The global well intervention market has been segmented into offshore and onshore based on the application as well as by geography. The report covers the 5 regions plus analysis of 15 other countries, see the prospects in the 5 Regional markets and countries:
– North America Well Intervention Market Forecast 2017-2027
– Europe Well Intervention Market Forecast 2017-2027
– Asia Pacific Well Intervention Market Forecast 2017-2027
– Central and South America Well Intervention Market Forecast 2017-2027
– Middle East and Africa Well Intervention Market Forecast 2017-2027
– US Well Intervention Market Forecast & Analysis 2017-2027
– Canada Well Intervention Market Forecast & Analysis 2017-2027
– Russia Well Intervention Market Forecast & Analysis 2017-2027
– UK Well Intervention Market Forecast & Analysis 2017-2027
– Norway Well Intervention Market Forecast & Analysis 2017-2027
– Denmark Well Intervention Market Forecast & Analysis 2017-2027
– China Well Intervention Market Forecast & Analysis 2017-2027
– India Well Intervention Market Forecast & Analysis 2017-2027
– Malaysia Well Intervention Market Forecast & Analysis 2017-2027
– Australia Well Intervention Market Forecast & Analysis 2017-2027
– Brazil Well Intervention Market Forecast & Analysis 2017-2027
– Mexico Well Intervention Market Forecast & Analysis 2017-2027
– Argentina Well Intervention Market Forecast & Analysis 2017-2027
– Saudi Arabia Well Intervention Market Forecast & Analysis 2017-2027
– Well Intervention Market Forecast & Analysis 2017-2027
3) Learn about the following business-critical issues:
– Increasing energy demand
– Growing oil & gas production
– Shift towards renewable energy sources
– Stringent environment norms
This independent 133-page report guarantees you will remain better informed than your competition. With 141 tables and figures examining the Well Intervention market space, the report gives you a visual, one-stop breakdown of your market including capital expenditure forecasts from 2017-2027, keeping your knowledge that one step ahead helping you to succeed.
This report is essential reading for you or anyone in the energy sector who wish to expand into different sectors or explore a new region for expansion of their existing operations. Purchasing this report today will help you to recognise those important market opportunities and understand the possibilities there. I look forward to receiving your order.
Visiongain is a trading partner with the US Federal Government
CCR Ref number: KD4R6
1. Report Overview
1.1 Global Well Intervention Overview
1.2 Global Well Intervention Market Application
1.3 Global Well Intervention Market By Service
1.4 How This Report Delivers
1.5 Key Questions Answered by This Analytical Report Include:
1.6 Who Is This Report For?
1.7 Methodology
1.8 Associated Visiongain Reports
1.9 Frequently Asked Questions (FAQ)
2. Executive Summary
2.1 Market Size & Future Prospects
2.2 What Is Well Intervention?
2.3 Market Insights
3. Market Segmentation
3.1 Global Well Intervention Market Forecast 2017-2027
3.2 Well Intervention Market Key Trends
3.3 Well Intervention Market Dynamics
3.4 Drivers
3.4.1 Increasing Energy Demand
3.4.2. Growing Oil & Gas Production
3.5 Restraints
3.5.1 Shift Towards Renewable Energy Sources
3.5.2 Stringent Environment Regulations
3.6 Opportunities
3.6.1 Untapped Oil Reserves
3.7 Industry Outlook
3.8 Well Intervention Market – PESTLE Analysis
3.9 Industry Analysis
4. Well Intervention Market By Services 2017-2027
4.1 Well Intervention Market For Logging & Bottomhole Survey (LBS) 2017-2027
4.2 Well Intervention Market For Tubing/Packer Failure& Repair (TFR) 2017-2027
4.3 Well Intervention Market For Stimulation 2017-2027
4.4 Well Intervention Market For Remedial Cementing 2017-2027
4.5 Well Intervention Market For Zonal Isolation 2017-2027
4.6 Well Intervention Market For Sand Control Services 2017-2027
4.7 Well Intervention Market For Artificial Lift 2017-2027
4.8 Well Intervention Market For Fishing 2017-2027
4.9 Well Intervention Market For Re-Perforation 2017-2027
4.10 Well Intervention Market For Others 2017-2027
5. Well Intervention Market By Application 2017-2027
5.1 Onshore
5.2 Offshore
6. Well Intervention Markets By Geography
6.1 Global Well Intervention Markets
6.2 North America Well Intervention Market Forecast & Analysis 2017-2027
6.2.1 US Well Intervention Market Forecast & Analysis 2017-2027
6.2.2 Canada Well Intervention Market Forecast & Analysis 2017-2027
6.3 Europe Well Intervention Market Forecast & Analysis 2017-2027
6.3.1 Russia Well Intervention Market Forecast & Analysis 2017-2027
6.3.2 UK Well Intervention Market Forecast & Analysis 2017-2027
6.3.3 Norway Well Intervention Market Forecast & Analysis 2017-2027
6.3.4 Denmark Well Intervention Market Forecast & Analysis 2017-2027
6.3.5 Other European Countries Well Intervention Market Forecast & Analysis 2017-2027
6.4 Asia Pacific Well Intervention Market Forecast & Analysis 2017-2027
6.4.1 China Well Intervention Market Forecast & Analysis 2017-2027
6.4.2 India Well Intervention Market Forecast & Analysis 2017-2027
6.4.3 Malaysia Well Intervention Market Forecast & Analysis 2017-2027
6.4.4 Australia Well Intervention Market Forecast & Analysis 2017-2027
6.4.5 Rest of Asia Pacific Countries Well Intervention Market Forecast & Analysis 2017-2027
6.5 Central & South America (CSA) Well Intervention Market Forecast & Analysis 2017-2027
6.5.1 Brazil Well Intervention Market Forecast & Analysis 2017-2027
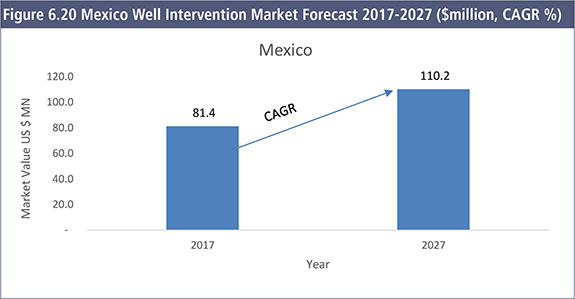
6.5.2 Mexico Well Intervention Market Forecast & Analysis 2017-2027
6.5.3 Argentina Well Intervention Market Forecast & Analysis 2017-2027
6.5.4 Rest of Latin America Well Intervention Market Forecast & Analysis 2017-2027
6.6 Middle East & Africa (MEA) Well Intervention Market Forecast & Analysis 2017-2027
6.6.1 Saudi Arabia Well Intervention Market Forecast & Analysis 2017-2027
6.6.2 UAE Well Intervention Market Forecast & Analysis 2017-2027
6.6.4 Rest of Middle East & Africa Well Intervention Market Forecast & Analysis 2017-2027
7. SWOT Analysis Of The Well Intervention Market 2017-2027
7.1 SWOT Analysis Of The Well Intervention Market 2017-2027
8. Well Intervention Market - Company Profiles
8.1 Halliburton Company
8.1.1 Halliburton Company Overview
8.1.2 Halliburton Financial Analysis
8.1.3 Halliburton Segmental and Regional Analysis
8.1.4 Halliburton Strategic Initiative
8.1.4.1 Mergers & Acquisitions
8.1.4.2 Partnerships, Collaborations and Agreements
8.1.4.3 Product Launch
8.2 Schlumberger Limited
8.2.1 Schlumberger Company Overview
8.2.2 Schlumberger Financial Analysis
8.2.3 Schlumberger Segmental and Regional Analysis
8.2.4 Schlumberger Strategic Initiative
8.2.4.1 Partnerships, Collaborations and Agreements
8.2.4.2 Product Launch
8.2.4.3 Mergers & Acquisitions
8.3 Superior Energy Services, Inc.
8.3.1 Superior Energy Services Company Overview
8.3.2 Superior Energy Services Segmental and Regional Analysis
8.4 Baker Hughes Incorporated
8.4.1 Baker Hughes Company Overview
8.4.2 Baker Hughes Financial Analysis
8.4.3 Baker Hughes Regional Analysis
8.4.4 Baker Hughes Strategic Initiative
8.4.4.1 Product Launch
8.4.4.2 Partnerships, Collaborations and Agreements
8.4.4.3 Mergers & Acquisitions
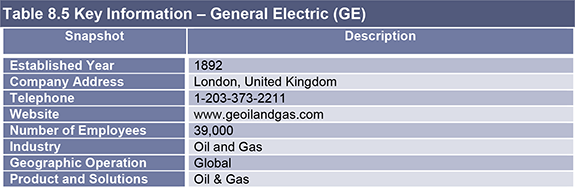
8.5 GE Oil & Gas
8.5.1 GE Oil & Gas Company Overview
8.5.2 GE Oil & Gas Financial Analysis
8.5.3 GE Oil & Gas Regional Analysis
8.6 Archer Limited
8.6.1 Archer Limited Company Overview
8.6.2 Archer Limited Financial Analysis
8.6.3 Archer Limited Segmental and Regional Analysis
8.6.4 Archer Limited Strategic Initiative
8.6.4.1 Product Launch
8.7 Lupatech SA
8.7.1 Lupatech SA Company Overview
8.7.2 Lupatech SA Financial Analysis
8.7.3 Lupatech SA Segmental and Regional Analysis
8.8 Other Leading Companies
9. Conclusions and Recommendations
9.1 Well Intervention Market Study Conclusion
9.2 Well Intervention Market Study Recommendations
10. Glossary
Appendix
Associated Visiongain Reports
Visiongain Report Sales Order Form
Appendix A
Appendix B
Visiongain Report Evaluation Form
List of Tables
Table 3.1 Well Intervention Market Forecast 2017-2027 ($Mn, AGR %, CAGR %)
Table 3.2 Key Trends of the Global Well Intervention Market 2017
Table 3.3 Global Well Intervention Market Drivers, Restraints and Opportunities
Table 3.4 Oil reserves in major countries
Table 4.1 Well Intervention Market by Service Forecast 2017-2027 ($Mn, AGR %, CAGR)
Table 4.2 Well Intervention Market by End-Use Industry Forecast CAGR (%) 2017-2027, 2017-2022, and 2022-2027
Table 4.3 Well Intervention Market for LBS Forecast 2017-2027 ($Mn, AGR %, CAGR %)
Table 4.4 Well Intervention Market for TFR Industry Forecast 2017-2027 ($Mn, AGR %, CAGR %)
Table 4.5 Well Intervention Market for Stimulation Forecast 2017-2027 ($Mn, AGR %, CAGR %)
Table 4.6 Well Intervention Market for Remedial Cementing Forecast 2017-2027 ($Mn, AGR %, CAGR %)
Table 4.7 Well Intervention Market for Zonal Isolation Forecast 2017-2027 ($Mn, AGR %, CAGR %)
Table 4.8 Well Intervention Market for Sand Control Services Forecast 2017-2027 ($Mn, AGR %, CAGR %)
Table 4.9 Well Intervention Market for Artificial Lift Forecast 2017-2027 ($Mn, AGR %, CAGR %)
Table 4.10 Well Intervention Market for Fishing Forecast 2017-2027 ($Mn, AGR %, CAGR %)
Table 4.11 Well Intervention Market for Re-Perforation Forecast 2017-2027 ($Mn, AGR %, CAGR %)
Table 4.12 Well Intervention Market for Other Services Forecast 2017-2027 ($Mn, AGR %, CAGR %)
Table 5.1 Well Intervention Market by Application Forecast 2017-2027 ($Mn, AGR %, CAGR %)
Table 5.2 Well Intervention Market by End-Use Industry Forecast CAGR (%) 2017-2027, 2017-2022, and 2022-2027
Table 5.3 Well Intervention Market for Onshore Forecast 2017-2027 ($Mn, AGR %, CAGR %)
Table 5.4 Well Intervention Market for Re-Perforation Forecast 2017-2027 ($Mn, AGR %, CAGR %)
Table 6.1 Well Intervention Market by Region Forecast 2017-2027 ($Mn, AGR %, CAGR %)
Table 6.2 North America Well Intervention Market Forecast 2017-2027 ($million, CAGR %)
Table 6.3 US Well Intervention Market Forecast 2017-2027 ($million, AGR %, CAGR %)
Table 6.4 Canada Well Intervention Market Forecast 2017-2027 ($million, AGR %, CAGR %)
Table 6.5 Europe Well Intervention Market Forecast 2017-2027 ($million, CAGR %)
Table 6.6 Russia Well Intervention Market Forecast 2017-2027 ($million, AGR %, CAGR %)
Table 6.7 UK Well Intervention Market Forecast 2017-2027 ($million, AGR %, CAGR %)
Table 6.8 Norway Well Intervention Market Forecast 2017-2027 ($million, AGR %, CAGR %)
Table 6.9 Denmark Well Intervention Market Forecast 2017-2027 ($million, AGR %, CAGR %)
Table 6.10 Other European Countries Well Intervention Market Forecast 2017-2027 ($million, AGR %, CAGR %)
Table 6.11 Asia Pacific Well Intervention Market Forecast 2017-2027 ($million, CAGR %)
Table 6.12 China Well Intervention Market Forecast 2017-2027 ($million, AGR %, CAGR %)
Table 6.13 India Well Intervention Market Forecast 2017-2027 ($million, AGR %, CAGR %)
Table 6.14 Malaysia Well Intervention Market Forecast 2017-2027 ($million, AGR %, CAGR %)
Table 6.15 Australia Well Intervention Market Forecast 2017-2027 ($million, AGR %, CAGR %)
Table 6.16 Rest of Asia Pacific Well Intervention Market Forecast 2017-2027 ($million, AGR %, CAGR %)
Table 6.17 CSA Well Intervention Market Forecast 2017-2027 ($million, CAGR %)
Table 6.18 Brazil Well Intervention Market Forecast 2017-2027 ($million, AGR %, CAGR %)
Table 6.19 Mexico Well Intervention Market Forecast 2017-2027 ($million, AGR %, CAGR %, Cumulative)
Table 6.20 Argentina Well Intervention Market Forecast 2017-2027 ($million, AGR %, CAGR %)
Table 6.21 Rest of Latin America Well Intervention Market Forecast 2017-2027 ($million, AGR %, CAGR %)
Table 6.22 MEA Well Intervention Market Forecast 2017-2027 ($million, CAGR %)
Table 6.23 Saudi Arabia Well Intervention Market Forecast 2017-2027 ($million, AGR %, CAGR %)
Table 6.24 UAE Well Intervention Market Forecast 2017-2027 ($million, AGR %, CAGR %)
Table 6.25 Rest of the Middle East & Africa Well Intervention Market Forecast 2017-2027 ($million, AGR %, CAGR %)
Table 7.1 SWOT Analysis of the Well Intervention Market 2017-2027
Table 8.1 Key Information –Halliburton Company
Table 8.2 Key Information – Schlumberger Limited
Table 8.3 Key Information – Superior Energy Services, Inc.
Table 8.4 Key Information – Baker Hughes Incorporated
Table 8.5 Key Information – General Electric (GE)
Table 8.6 Key Information – Archer Limited
Table 8.7 Key Information – Lupatech SA
Table 9.1 Global Well Intervention Market Summary 2017 - 2027 (Market Value, CAGR %)
List of Figures
Figure 1.1 Proven Crude Oil Reserves By Country (Billion Barrels)
Figure 1.2 Global Well Intervention Market Segmentation by Application
Figure 1.3 Global Well Intervention Market Segmentation by Service
Figure 2.1 Global well intervention market, revenue (USD Million), 2017-2027
Figure 2.2 Well Intervention Conveyance Methods
Figure 2.3 Well Intervention Market Snapshot (2017 vs. 2027)
Figure 2.4 Onshore application is expected to dominate the Well Intervention Market until 2027 (USD Million)
Figure 2.5 Emerging Economies accelerating the Growth of Global Well Intervention Market (USD Million)
Figure 3.1 Global Well Intervention Market Segmentation
Figure 3.2 Key Industry Trends
Figure 3.3 PESTLE ANALYSIS
Figure 3.4 Well Intervention Market, Porter’s Five Force Model
Figure 4.1 Well Intervention Market by Service Industry Forecast 2017-2027 ($Mn)
Figure 4.2 Well Intervention End-Use Market Share Forecast 2017, 2022, 2027 (%)
Figure 4.3 Well Intervention Market by End-Use Industry Forecast 2017-2027 AGR (%)
Figure 4.4 Well Intervention Market for LBS Forecast 2017-2027 ($Mn, AGR %)
Figure 4.5 Well Intervention Market for TFR Industry Forecast 2017-2027 ($Mn, AGR %)
Figure 4.6 Well Intervention Market for Stimulation Industry Forecast 2017-2027 ($Mn, AGR %)
Figure 4.7 Well Intervention Market for Remedial Cementing Industry Forecast 2017-2027 ($Mn, AGR %)
Figure 4.8 Well Intervention Market for Zonal Isolation Forecast 2017-2027 ($Mn, AGR %)
Figure 4.9 Well Intervention Market for Sand Control Services Forecast 2017-2027 ($Mn, AGR %)
Figure 4.10 Well Intervention Market for Artificial Lift Forecast 2017-2027 ($Mn, AGR %)
Figure 4.11 Well Intervention Market for Fishing Services Forecast 2017-2027 ($Mn, AGR %)
Figure 4.12 Well Intervention Market for Re-Perforation Forecast 2017-2027 ($Mn, AGR %)
Figure 4.13 Well Intervention Market for Other Services Forecast 2017-2027 ($Mn, AGR %)
Figure 5.1 Well Intervention Market by Application Forecast 2017-2027 ($Mn)
Figure 5.2 Well Intervention Application Market Share Forecast 2017, 2022, 2027 (%)
Figure 5.3 Well Intervention Market by Application Forecast 2017-2027 AGR (%)
Figure 5.4 Well Intervention for Onshore Market Forecast 2017-2027 ($Mn, AGR %)
Figure 5.5 Well Intervention for Re-Perforation Market Forecast 2017-2027 ($Mn, AGR %)
Figure 6.1 Global Well Intervention Market, By Region Market Value Forecast 2017-2027
Figure 6.2 Global Well Intervention Market, By Region Market Value AGR Forecast 2017-2027 (AGR %)
Figure 6.3 Well Intervention Regional Market Share Forecast 2017, 2022, 2027 (%)
Figure 6.4 North America Well Intervention Market Forecast 2017-2027 ($million, AGR %)
Figure 6.5 US Well Intervention Market Forecast 2017-2027 ($million, CAGR %)
Figure 6.6 Canada Well Intervention Market Forecast 2017-2027 ($million, CAGR %)
Figure 6.7 Europe Well Intervention Market Forecast 2017-2027 ($million, AGR %)
Figure 6.8 Russia Well Intervention Market Forecast 2017-2027 ($million, CAGR %)
Figure 6.9 UK Well Intervention Market Forecast 2017-2027 ($million, CAGR %)
Figure 6.10 Norway Well Intervention Market Forecast 2017-2027 ($million, CAGR %)
Figure 6.11 Denmark Well Intervention Market Forecast 2017-2027 ($million, CAGR %)
Figure 6.12 Other European Countries Well Intervention Market Forecast 2017-2027 ($million, CAGR %)
Figure 6.13 Asia Pacific Well Intervention Market Forecast 2017-2027 ($million, AGR %)
Figure 6.14 China Well Intervention Market Forecast 2017-2027 ($million, CAGR %)
Figure 6.15 India Well Intervention Market Forecast 2017-2027 ($million, CAGR %)
Figure 6.16 Malaysia Well Intervention Market Forecast 2017-2027 ($million, CAGR %)
Figure 6.17 Australia Well Intervention Market Forecast 2017-2027 ($million, CAGR %)
Figure 6.18 Rest of Asia Pacific Well Intervention Market Forecast 2017-2027 ($million, CAGR %)
Figure 6.19 CSA Well Intervention Market Forecast 2017-2027 ($million, AGR %)
Figure 6.20 Brazil Well Intervention Market Forecast 2017-2027 ($million, CAGR %)
Figure 6.21 Mexico Well Intervention Market Forecast 2017-2027 ($million, CAGR %)
Figure 6.22 Argentina Well Intervention Market Forecast 2017-2027 ($million, CAGR %)
Figure 6.23 Rest of Latin America Well Intervention Market Forecast 2017-2027 ($million, CAGR %)
Figure 6.24 MEA Well Intervention Market Forecast 2017-2027 ($million, CAGR %)
Figure 6.25 Saudi Arabia Well Intervention Market Forecast 2017-2027 ($million, CAGR %)
Figure 6.26 UAE Well Intervention Market Forecast 2017-2027 ($million, AGR %)
Figure 6.27 Rest of the Middle East & Africa Well Intervention Market Forecast 2017-2027 ($million, CAGR %)
Figure 8.1 Halliburton Company Revenue Trend, In USD Million (2014 – 2016)
Figure 8.2 Halliburton Revenue Share by Segment– 2016
Figure 8.3 Halliburton Revenue Share by Segment – 2015
Figure 8.4 Halliburton Revenue Share by Region– 2016
Figure 8.5 Halliburton Revenue Share by Region – 2015
Figure 8.6 Schlumberger Company Revenue Trend, In USD Million (2014 – 2016)
Figure 8.7 Schlumberger Revenue Share by Segment– 2016
Figure 8.8 Schlumberger Revenue Share by Segment – 2015
Figure 8.9 Schlumberger Revenue Share by Region – 2016
Figure 8.10 Schlumberger Revenue Share by Region – 2015
Figure 8.11 Superior Energy Revenue Share by Segment– 2016
Figure 8.12 Superior Energy Revenue Share by Segment – 2015
Figure 8.13 Superior Energy Revenue Share by Region– 2016
Figure 8.14 Superior Energy Revenue Share by Region – 2015
Figure 8.15 Baker Hughes Company Revenue Trend, In USD Million (2014 – 2016)
Figure 8.16 Baker Hughes Revenue Share by Region– 2016
Figure 8.17 Baker Hughes Revenue Share by Region – 2015
Figure 8.18 GE Oil & Gas Company Revenue Trend, In USD Million (2014 – 2016)
Figure 8.19 GE Oil & Gas Revenue Share by Region– 2016
Figure 8.20 Revenue Share by Region – 2015
Figure 8.21 Archer Limited Company Revenue Trend, In USD Million (2014 – 2016)
Figure 8.22 Archer Limited Revenue Share by Segment– 2016
Figure 8.23 Archer Limited Revenue Share by Segment – 2015
Figure 8.24 Archer Limited Revenue Share by Region– 2016
Figure 8.25 Archer Limited Revenue Share by Region – 2015
Figure 8.26 Lupatech SA Company Revenue Trend, In USD Million (2014 – 2016)
Figure: 8.27 Lupatech SA Revenue Share by Segment– 2016
Figure: 8.28 Lupatech SA Revenue Share by Segment – 2015
Figure 8.29 Lupatech SA Revenue Share by Region– 2016
Figure 8.30 Lupatech SA Revenue Share by Region – 2015
Abbot Group
Acteon
Aibel
Aker BP ASA
Aker Solutions
Amec Foster Wheeler
Apache North Sea Limited
Archer Limited
Baker Hughes
BP
Calfrac Well Services
Cameron
Canary, LLC
CGG
CH2M HILL
Challenger LTD
Chevron
China Oilfield Services
Clariant Oil Services
ConocoPhillips Scandinavia AS
Core Laboratories, Inc.
Corex
Cyntech
Denca Services Limited
DOF Subsea
Energeia Oil & Gas
Engineers India Limited
ENI
Ensco plc
ESG Solutions
Expro International Group
Fairfield Energy
FairfieldNodal
Flowserve
Fluor Corporation
Fugro
Gaia Earth Sciences
Gazprom Neft
GE Oil & Gas
GE VetcoGray
Geokinetics
Geophysical Service
Geoservices
Gibson Energy
GK Processing www.gkprocessing.com
Grup Servicii Petroliere
Gyrodata
Halliburton Company
Helix Energy Solutions Group
Hill International
Hunting plc
Ingrain, Inc.
J&L Supply Co.
Jacobs Engineering Group
Key Energy Services
Kodiak Coil Tubing
Lamprell Energy
Landmark Software and Services
Larsen & Toubro
Lupatech SA
Magma Global
Marathon Oil
McDermott International
MHWirth
MODEC
Moody International Group
Nabors Industries
Nalco Champion
National Oilwell Varco
Neftex Petroleum
Oceaneering International Inc.
O-Tex Pumping
Peak Well Systems
Petrobras
Petrofac
PJP4
Precision Drilling
Qserv
Ratnam Energy Pvt Ltd
READ Cased Hole Ltd
Repsol Norge AS
Repsol Sinopec Resources UK
Saipem
Saudi Aramco
Schlumberger
Schlumberger Limited
Scomi
Score Group plc
Seaboard International
Semco Maritime
ShawCor
Shell U.K. Limited
Siemens Oil & Gas Division
Smith International
Statoil
Stewart & Stevenson
Subsea_7
Summit ESP
Superior Energy Services
Superior Energy Services
Swire
TAM International
TechnipFMC
Tecnicas Reunidas
Tesco Corporation
Tracerco
Transocean
Trican Well Service
Trinidad Drilling
Wasco Energy
Weatherford
Weatherford International
Weir Group
WellDynamics
Wellstream
Welltec
WesternGeco
Wood Group
Workover Solutions
WorleyParsons
Xperts Oilfield Services
YPF
Zenith Oilfield Technology
Government Agencies and Other Organisations Mentioned in This Report
Bureau of Safety and Environmental Enforcement (BSEE)
Department of Business, Energy & Industrial Strategy (DBEIS)
Department of Energy & Climate Change (DECC)
Energy & Industrial Strategy (DBEIS)
Environmental Protection Agency (EPA)
Himalayan Action Research Center (HARC)
Nigerian National Petroleum Corporation (NNPC)
Organisation for Economic Co-operation and Development (OECD)
Organisation for Economic Co-operation and Development (OPEC)
Petroleum Safety Authority Norway (PSA)
Resource Conservation and Recovery Act (RCRA)
United Nations Department of Economic and Social Affairs (UNDESA)


